Trikala Airbnb Market Analysis 2026: Short Term Rental Data & Vacation Rental Statistics in Thessaly and Central Greece, Greece
Is Airbnb profitable in Trikala in 2026? Explore comprehensive Airbnb analytics for Trikala, Thessaly and Central Greece, Greece to uncover income potential. This 2026 STR market report for Trikala, based on AirROI data from February 2025 to January 2026, reveals key trends in the market of 233 active listings.
Whether you're considering an Airbnb investment in Trikala, optimizing your existing vacation rental, or exploring rental arbitrage opportunities, understanding the Trikala Airbnb data is crucial. Navigating the high regulation landscape is key to maximizing your short term rental income potential. Let's dive into the specifics.
Key Trikala Airbnb Performance Metrics Overview
Monthly Airbnb Revenue Variations & Income Potential in Trikala (2026)
Understanding the monthly revenue variations for Airbnb listings in Trikala is key to maximizing your short term rental income potential. Seasonality significantly impacts earnings. Our analysis, based on data from the past 12 months, shows that the peak revenue month for STRs in Trikala is typically December, while June often presents the lowest earnings, highlighting opportunities for strategic pricing adjustments during shoulder and low seasons. Explore the typical Airbnb income in Trikala across different performance tiers:
- Best-in-class properties (Top 10%) achieve $1,716+ monthly, often utilizing dynamic pricing and superior guest experiences.
- Strong performing properties (Top 25%) earn $1,161 or more, indicating effective management and desirable locations/amenities.
- Typical properties (Median) generate around $667 per month, representing the average market performance.
- Entry-level properties (Bottom 25%) see earnings around $345, often with potential for optimization.
Average Monthly Airbnb Earnings Trend in Trikala
Trikala Airbnb Occupancy Rate Trends (2026)
Maximize your bookings by understanding the Trikala STR occupancy trends. Seasonal demand shifts significantly influence how often properties are booked. Typically, Decembersees the highest demand (peak season occupancy), while June experiences the lowest (low season). Effective strategies, like adjusting minimum stays or offering promotions, can boost occupancy during slower periods. Here's how different property tiers perform in Trikala:
- Best-in-class properties (Top 10%) achieve 61%+ occupancy, indicating high desirability and potentially optimized availability.
- Strong performing properties (Top 25%) maintain 39% or higher occupancy, suggesting good market fit and guest satisfaction.
- Typical properties (Median) have an occupancy rate around 21%.
- Entry-level properties (Bottom 25%) average 10% occupancy, potentially facing higher vacancy.
Average Monthly Occupancy Rate Trend in Trikala
Average Daily Rate (ADR) Airbnb Trends in Trikala (2026)
Effective short term rental pricing strategy in Trikala involves understanding monthly ADR fluctuations. The Average Daily Rate (ADR) for Airbnb in Trikala typically peaks in December and dips lowest during March. Leveraging Airbnb dynamic pricing tools or strategies based on this seasonality can significantly boost revenue. Here's a look at the typical nightly rates achieved:
- Best-in-class properties (Top 10%) command rates of $190+ per night, often due to premium features or locations.
- Strong performing properties (Top 25%) achieve nightly rates of $135 or more.
- Typical properties (Median) charge around $103 per night.
- Entry-level properties (Bottom 25%) earn around $79 per night.
Average Daily Rate (ADR) Trend by Month in Trikala
Get Live Trikala Market Intelligence 👇

Explore Real-time Analytics
Airbnb Seasonality Analysis & Trends in Trikala (2026)
Peak Season (December, November, August)
- Revenue averages $1,236 per month
- Occupancy rates average 33.7%
- Daily rates average $131
Shoulder Season
- Revenue averages $769 per month
- Occupancy maintains around 26.1%
- Daily rates hold near $116
Low Season (May, June, July)
- Revenue drops to average $640 per month
- Occupancy decreases to average 23.1%
- Daily rates adjust to average $114
Seasonality Insights for Trikala
- The Airbnb seasonality in Trikala shows highly seasonal trends requiring careful strategy. While the sections above show seasonal averages, it's also insightful to look at the extremes:
- During the high season, the absolute peak month showcases Trikala's highest earning potential, with monthly revenues capable of climbing to $1,889, occupancy reaching a high of 41.8%, and ADRs peaking at $153.
- Conversely, the slowest single month of the year, typically falling within the low season, marks the market's lowest point. In this month, revenue might dip to $615, occupancy could drop to 22.1%, and ADRs may adjust down to $109.
- Understanding both the seasonal averages and these monthly peaks and troughs in revenue, occupancy, and ADR is crucial for maximizing your Airbnb profit potential in Trikala.
Seasonal Strategies for Maximizing Profit
- Peak Season: Maximize revenue through premium pricing and potentially longer minimum stays. Ensure high availability.
- Low Season: Offer competitive pricing, special promotions (e.g., extended stay discounts), and flexible cancellation policies. Target off-season travelers like remote workers or budget-conscious guests.
- Shoulder Seasons: Implement dynamic pricing that balances peak and low rates. Target weekend travelers or specific events. Offer slightly more flexible terms than peak season.
- Regularly analyze your own performance against these Trikala seasonality benchmarks and adjust your pricing and availability strategy accordingly.
Best Areas for Airbnb Investment in Trikala (2026)
Exploring the top neighborhoods for short-term rentals in Trikala? This section highlights key areas, outlining why they are attractive for hosts and guests, along with notable local attractions. Consider these locations based on your target guest profile and investment strategy.
| Neighborhood / Area | Why Host Here? (Target Guests & Appeal) | Key Attractions & Landmarks |
|---|---|---|
| Trikala City Center | The historical and cultural hub of Trikala, attracting tourists with its rich history and local attractions. Ideal for visitors wanting to explore the city on foot with easy access to shops, restaurants, and cultural sites. | Trikala Fortress, Koursoum Mosque, Varousi District, Asclepius Church, Trikala Archaeological Museum |
| Meteora | A UNESCO World Heritage Site renowned for its stunning monasteries perched on cliffs. A major tourist destination for those seeking spiritual and natural beauty, making it a prime location for short-term rentals. | Meteora Monasteries, Hiking trails, Kastraki village, Kalambaka, St. Stephen's Monastery |
| Kalambaka | The town at the foot of Meteora, serving as a base for visitors exploring the monasteries. Offers numerous dining and accommodation options, making it an attractive area for Airbnb hosts. | Meteora views, Local tavernas, Kalambaka's Old Town, Theopetra Cave |
| Pinakates Village | A picturesque traditional village in central Greece, perfect for those looking to experience authentic Greek village life. Attracts tourists interested in nature and tranquility away from urban areas. | Traditional architecture, Stunning landscapes, Local hiking trails, Village festivals |
| Pertouli | A mountain area known for its natural beauty and outdoor activities. Offers a unique retreat experience for both summer and winter sports enthusiasts, ideal for those looking for adventure stays. | Pertouli Ski Center, Hiking trails, Natural hot springs, Beautiful forests |
| Karditsa | A charming town close to Trikala with a rich local culture and beautiful parks. Provides a mix of urban tourism and access to nature, appealing to a diverse range of guests. | Lake Plastira, Karditsa's parks, Local museums, Agricultural fairs |
| Lake Plastira | A stunning artificial lake surrounded by mountains, providing opportunities for outdoor activities like hiking, cycling, and water sports. Perfect for nature lovers seeking peaceful stays. | Water sports, Hiking trails, Scenic viewpoints, Eagles Nest Cafe |
| Great Meteoron Monastery area | Close to Meteora and rich in historical significance, this area attracts tourists interested in the religious heritage of Greece and offers a calm environment for reflection and relaxation. | Great Meteoron Monastery, Kalambaka town, Panagia Monastery, Natural beauty |
Understanding Airbnb License Requirements & STR Laws in Trikala (2026)
Yes, Trikala, Thessaly and Central Greece, Greece enforces high STR regulations. Obtaining a license and ensuring compliance is almost certainly required according to current 2026 STR laws. Always verify the latest short term rental regulations and Airbnb license requirements directly with local government authorities for Trikala to ensure full compliance before hosting.
(Source: AirROI data, 2026, based on 92% licensed listings)
Top Performing Airbnb Properties in Trikala (2026)
Benchmark your potential! Explore examples of top-performing Airbnb properties in Trikalabased on Trailing Twelve Month (TTM) revenue. Analyze their characteristics, revenue, occupancy rate, and ADR to understand what drives success in this market.

4-seasons pool villa-near METEORA
Entire Place • 4 bedrooms
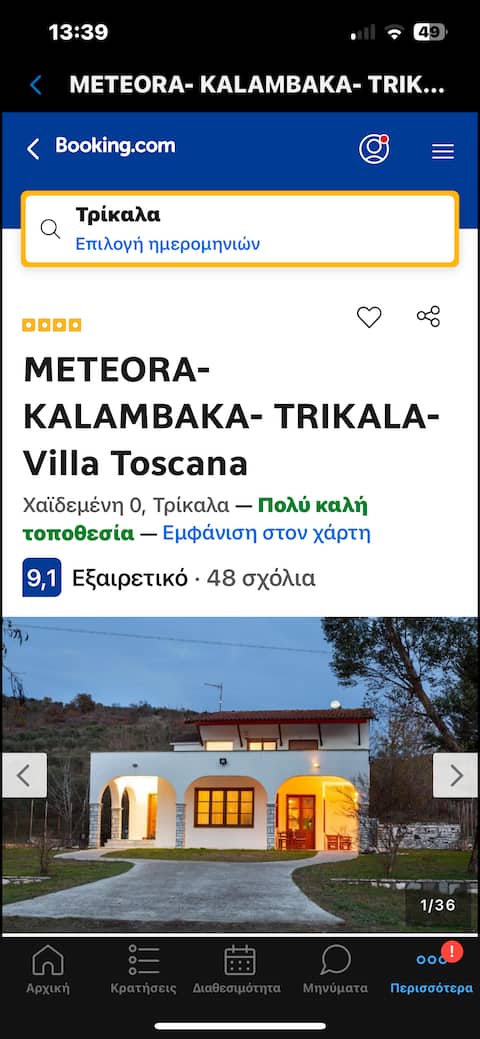
Meteora - Kalambaka - Trikala - Villa Toscana
Entire Place • 4 bedrooms

Sunny and Spacious Luxury House
Entire Place • 3 bedrooms
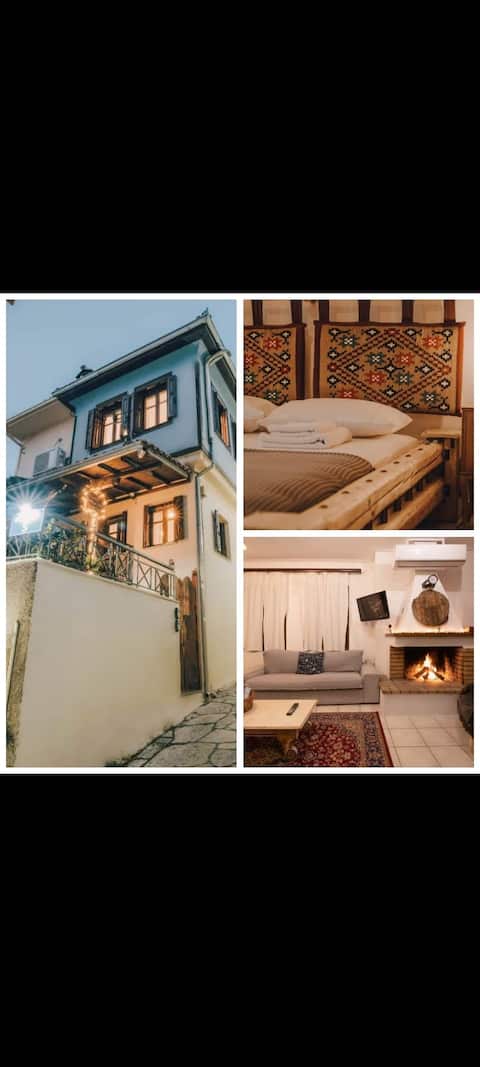
Varousi Traditional house in old town of Trikala2
Entire Place • 3 bedrooms
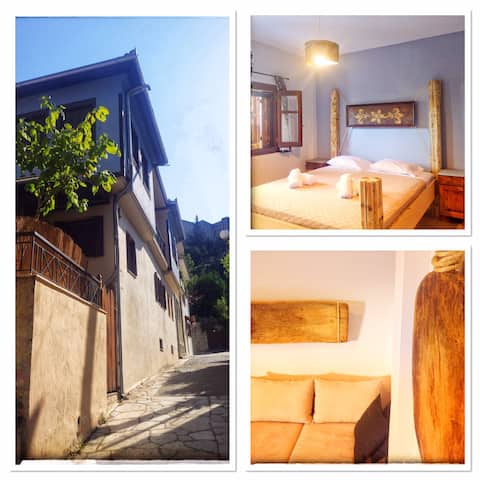
Varousi.Traditional house in old town of Trikala 1
Entire Place • 2 bedrooms

Το σπίτι δίπλα από το ποτάμι
Entire Place • 2 bedrooms
Note: Performance varies based on location, size, amenities, seasonality, and management quality. Data reflects the past 12 months.
Top Performing Airbnb Hosts in Trikala (2026)
Learn from the best! This table showcases top-performing Airbnb hosts in Trikala based on the number of properties managed and estimated total revenue over the past year. Analyze their scale and performance metrics.
| Host Name | Properties | Grossing Revenue | Stay Reviews | Avg Rating |
|---|---|---|---|---|
| Kostantinos | 11 | $141,710 | 317 | 4.98/5.0 |
| Athanasios | 6 | $71,983 | 297 | 4.94/5.0 |
| Smart Town BnB | 16 | $67,466 | 58 | 4.95/5.0 |
| Nikolaos | 1 | $33,948 | 29 | 4.93/5.0 |
| Vaios | 1 | $27,648 | 97 | 4.71/5.0 |
| Vintage Suites Trikala | 3 | $26,606 | 4 | Not Rated |
| Δημητριος | 2 | $26,493 | 35 | 4.97/5.0 |
| Dimitra | 6 | $25,623 | 9 | 5.00/5.0 |
| Βασιλης | 2 | $25,509 | 387 | 4.83/5.0 |
| Charoula | 2 | $23,343 | 608 | 4.91/5.0 |
Analyzing the strategies of top hosts, such as their property selection, pricing, and guest communication, can offer valuable lessons for optimizing your own Airbnb operations in Trikala.
Dive Deeper: Advanced Trikala STR Market Data (2026)
Ready to unlock more insights? AirROI provides access to advanced metrics and comprehensive Airbnb data for Trikala. Explore detailed analytics beyond this report to refine your investment strategy, optimize pricing, and maximize your vacation rental profits.
Explore Advanced MetricsTrikala Short-Term Rental Market Composition (2026): Property & Room Types
Room Type Distribution
Property Type Distribution
Market Composition Insights for Trikala
- The Trikala Airbnb market composition is heavily skewed towards Entire Home/Apt listings, which make up 98.3% of the 233 active rentals. This indicates strong guest preference for privacy and space.
- Looking at the property type distribution in Trikala, Apartment/Condo properties are the most common (62.2%), reflecting the local real estate landscape.
- Houses represent a significant 35.2% portion, catering likely to families or larger groups.
- Smaller segments like others, hotel/boutique, outdoor/unique (combined 2.6%) offer potential for unique stay experiences.
Trikala Airbnb Room Capacity Analysis (2026): Bedroom Distribution
Distribution of Listings by Number of Bedrooms
Room Capacity Insights for Trikala
- The dominant room capacity in Trikala is 1 bedroom listings, making up 44.2% of the market. This suggests a strong demand for properties suitable for couples or solo travelers.
- Together, 1 bedroom and 2 bedrooms properties represent 85.0% of the active Airbnb listings in Trikala, indicating a high concentration in these sizes.
Trikala Vacation Rental Guest Capacity Trends (2026)
Distribution of Listings by Guest Capacity
Guest Capacity Insights for Trikala
- The most common guest capacity trend in Trikala vacation rentals is listings accommodating 4 guests (45.9%). This suggests the primary traveler segment is likely small families or groups.
- Properties designed for 4 guests and 6 guests dominate the Trikala STR market, accounting for 62.2% of listings.
- 24.9% of properties accommodate 6+ guests, serving the market segment for larger families or group travel in Trikala.
- On average, properties in Trikala are equipped to host 4.5 guests.
Trikala Airbnb Booking Patterns (2026): Available vs. Booked Days
Available Days Distribution
Booked Days Distribution
Booking Pattern Insights for Trikala
- The most common availability pattern in Trikala falls within the 271-366 days range, representing 76.8% of listings. This suggests many properties have significant open periods on their calendars.
- Approximately 95.3% of listings show high availability (181+ days open annually), indicating potential for increased bookings or specific owner usage patterns.
- For booked days, the 31-90 days range is most frequent in Trikala (39.9%), reflecting common guest stay durations or potential owner blocking patterns.
- A notable 5.6% of properties secure long booking periods (181+ days booked per year), highlighting successful long-term rental strategies or significant owner usage.
Trikala Airbnb Minimum Stay Requirements Analysis
Distribution of Listings by Minimum Night Requirement
1 Night
101 listings
43.3% of total
2 Nights
73 listings
31.3% of total
3 Nights
1 listings
0.4% of total
4-6 Nights
1 listings
0.4% of total
30+ Nights
57 listings
24.5% of total
Key Insights
- The most prevalent minimum stay requirement in Trikala is 1 Night, adopted by 43.3% of listings. This highlights the market's preference for shorter, flexible bookings.
- A strong majority (74.6%) of the Trikala Airbnb data shows acceptance of very short stays (1-2 nights), indicating a dynamic, high-turnover market.
- A significant segment (24.5%) caters to monthly stays (30+ nights) in Trikala, pointing to opportunities in the extended-stay market.
Recommendations
- Align with the market by considering a 1 Night minimum stay, as 43.3% of Trikala hosts use this setting.
- Explore offering discounts for stays of 30+ nights to attract the 24.5% of the market seeking extended stays.
- Adjust minimum nights based on seasonality – potentially shorter during low season and longer during peak demand periods in Trikala.
Trikala Airbnb Cancellation Policy Trends Analysis (2026)
Limited
1 listings
0.4% of total
Super Strict 30 Days
2 listings
0.9% of total
Flexible
46 listings
19.9% of total
Moderate
80 listings
34.6% of total
Firm
61 listings
26.4% of total
Strict
41 listings
17.7% of total
Cancellation Policy Insights for Trikala
- The prevailing Airbnb cancellation policy trend in Trikala is Moderate, used by 34.6% of listings.
- There's a relatively balanced mix between guest-friendly (54.5%) and stricter (44.1%) policies, offering choices for different guest needs.
Recommendations for Hosts
- Consider adopting a Moderate policy to align with the 34.6% market standard in Trikala.
- Regularly review your cancellation policy against competitors and market demand shifts in Trikala.
Trikala STR Booking Lead Time Analysis (2026)
Average Booking Lead Time by Month
Booking Lead Time Insights for Trikala
- The overall average booking lead time for vacation rentals in Trikala is 38 days.
- Guests book furthest in advance for stays during December (average 54 days), likely coinciding with peak travel demand or local events.
- The shortest booking windows occur for stays in February (average 18 days), indicating more last-minute travel plans during this time.
- Seasonally, Winter (38 days avg.) sees the longest lead times, while Fall (28 days avg.) has the shortest, reflecting typical travel planning cycles.
Recommendations for Hosts
- Use the overall average lead time (38 days) as a baseline for your pricing and availability strategy in Trikala.
- For December stays, consider implementing length-of-stay discounts or slightly higher rates for bookings made less than 54 days out to capitalize on advance planning.
- Target marketing efforts for the Winter season well in advance (at least 38 days) to capture early planners.
- Monitor your own booking lead times against these Trikala averages to identify opportunities for dynamic pricing adjustments.
Popular & Essential Airbnb Amenities in Trikala (2026)
Amenity Prevalence
Amenity Insights for Trikala
- Essential amenities in Trikala that guests expect include: TV, Wifi. Lacking these (any) could significantly impact bookings.
- Popular amenities like Kitchen, Hot water, Heating are common but not universal. Offering these can provide a competitive edge.
Recommendations for Hosts
- Ensure your listing includes all essential amenities for Trikala: TV, Wifi.
- Prioritize adding missing essentials: TV, Wifi.
- Consider adding popular differentiators like Kitchen or Hot water to increase appeal.
- Highlight unique or less common amenities you offer (e.g., hot tub, dedicated workspace, EV charger) in your listing description and photos.
- Regularly check competitor amenities in Trikala to stay competitive.
Trikala Airbnb Guest Demographics & Profile Analysis (2026)
Guest Profile Summary for Trikala
- The typical guest profile for Airbnb in Trikala consists of a mix of domestic (58%) and international guests, often arriving from nearby Athens, typically belonging to the Post-2000s (Gen Z/Alpha) group (50%), primarily speaking English or Greek.
- Domestic travelers account for 58.4% of guests.
- Key international markets include Greece (58.4%) and Germany (5.5%).
- Top languages spoken are English (40%) followed by Greek (24.1%).
- A significant demographic segment is the Post-2000s (Gen Z/Alpha) group, representing 50% of guests.
Recommendations for Hosts
- Balance marketing efforts between domestic and international channels based on the guest mix.
- Tailor amenities and listing descriptions to appeal to the dominant Post-2000s (Gen Z/Alpha) demographic (e.g., highlight fast WiFi, smart home features, local guides).
- Highlight unique local experiences or amenities relevant to the primary guest profile.
- Consider seasonal promotions aligned with peak travel times for key origin markets.
Nearby Short-Term Rental Market Comparison
How does the Trikala Airbnb market stack up against its neighbors? Compare key performance metrics like average monthly revenue, ADR, and occupancy rates in surrounding areas to understand the broader regional STR landscape.
| Market | Active Properties | Monthly Revenue | Daily Rate | Avg. Occupancy |
|---|---|---|---|---|
| Erisos Municipal Unit | 268 | $2,408 | $288.68 | 47% |
| Argostoli Municipality | 36 | $2,309 | $396.50 | 43% |
| Pesada | 52 | $2,277 | $297.23 | 47% |
| Minia | 63 | $2,222 | $248.36 | 49% |
| Mousata | 78 | $2,180 | $250.46 | 48% |
| Lourdata | 63 | $2,173 | $212.05 | 51% |
| Vlahata | 90 | $2,167 | $240.04 | 48% |
| Simotata | 23 | $2,158 | $235.29 | 49% |
| Loggos | 61 | $1,961 | $227.98 | 49% |
| Platanos | 47 | $1,899 | $270.79 | 48% |