Nopigia Airbnb Market Analysis 2026: Short Term Rental Data & Vacation Rental Statistics in Region of Crete, Greece
Is Airbnb profitable in Nopigia in 2026? Explore comprehensive Airbnb analytics for Nopigia, Region of Crete, Greece to uncover income potential. This 2026 STR market report for Nopigia, based on AirROI data from February 2025 to January 2026, reveals key trends in the niche market of 72 active listings.
Whether you're considering an Airbnb investment in Nopigia, optimizing your existing vacation rental, or exploring rental arbitrage opportunities, understanding the Nopigia Airbnb data is crucial. Navigating the high regulation landscape is key to maximizing your short term rental income potential. Let's dive into the specifics.
Key Nopigia Airbnb Performance Metrics Overview
Monthly Airbnb Revenue Variations & Income Potential in Nopigia (2026)
Understanding the monthly revenue variations for Airbnb listings in Nopigia is key to maximizing your short term rental income potential. Seasonality significantly impacts earnings. Our analysis, based on data from the past 12 months, shows that the peak revenue month for STRs in Nopigia is typically July, while February often presents the lowest earnings, highlighting opportunities for strategic pricing adjustments during shoulder and low seasons. Explore the typical Airbnb income in Nopigia across different performance tiers:
- Best-in-class properties (Top 10%) achieve $5,649+ monthly, often utilizing dynamic pricing and superior guest experiences.
- Strong performing properties (Top 25%) earn $3,037 or more, indicating effective management and desirable locations/amenities.
- Typical properties (Median) generate around $1,576 per month, representing the average market performance.
- Entry-level properties (Bottom 25%) see earnings around $974, often with potential for optimization.
Average Monthly Airbnb Earnings Trend in Nopigia
Nopigia Airbnb Occupancy Rate Trends (2026)
Maximize your bookings by understanding the Nopigia STR occupancy trends. Seasonal demand shifts significantly influence how often properties are booked. Typically, Julysees the highest demand (peak season occupancy), while December experiences the lowest (low season). Effective strategies, like adjusting minimum stays or offering promotions, can boost occupancy during slower periods. Here's how different property tiers perform in Nopigia:
- Best-in-class properties (Top 10%) achieve 76%+ occupancy, indicating high desirability and potentially optimized availability.
- Strong performing properties (Top 25%) maintain 62% or higher occupancy, suggesting good market fit and guest satisfaction.
- Typical properties (Median) have an occupancy rate around 38%.
- Entry-level properties (Bottom 25%) average 23% occupancy, potentially facing higher vacancy.
Average Monthly Occupancy Rate Trend in Nopigia
Average Daily Rate (ADR) Airbnb Trends in Nopigia (2026)
Effective short term rental pricing strategy in Nopigia involves understanding monthly ADR fluctuations. The Average Daily Rate (ADR) for Airbnb in Nopigia typically peaks in August and dips lowest during March. Leveraging Airbnb dynamic pricing tools or strategies based on this seasonality can significantly boost revenue. Here's a look at the typical nightly rates achieved:
- Best-in-class properties (Top 10%) command rates of $358+ per night, often due to premium features or locations.
- Strong performing properties (Top 25%) achieve nightly rates of $235 or more.
- Typical properties (Median) charge around $141 per night.
- Entry-level properties (Bottom 25%) earn around $92 per night.
Average Daily Rate (ADR) Trend by Month in Nopigia
Get Live Nopigia Market Intelligence 👇

Explore Real-time Analytics
Airbnb Seasonality Analysis & Trends in Nopigia (2026)
Peak Season (July, August, September)
- Revenue averages $4,902 per month
- Occupancy rates average 65.3%
- Daily rates average $246
Shoulder Season
- Revenue averages $2,059 per month
- Occupancy maintains around 36.1%
- Daily rates hold near $183
Low Season (January, February, November)
- Revenue drops to average $1,141 per month
- Occupancy decreases to average 31.4%
- Daily rates adjust to average $177
Seasonality Insights for Nopigia
- The Airbnb seasonality in Nopigia shows highly seasonal trends requiring careful strategy. While the sections above show seasonal averages, it's also insightful to look at the extremes:
- During the high season, the absolute peak month showcases Nopigia's highest earning potential, with monthly revenues capable of climbing to $5,448, occupancy reaching a high of 68.7%, and ADRs peaking at $267.
- Conversely, the slowest single month of the year, typically falling within the low season, marks the market's lowest point. In this month, revenue might dip to $853, occupancy could drop to 12.9%, and ADRs may adjust down to $165.
- Understanding both the seasonal averages and these monthly peaks and troughs in revenue, occupancy, and ADR is crucial for maximizing your Airbnb profit potential in Nopigia.
Seasonal Strategies for Maximizing Profit
- Peak Season: Maximize revenue through premium pricing and potentially longer minimum stays. Ensure high availability.
- Low Season: Offer competitive pricing, special promotions (e.g., extended stay discounts), and flexible cancellation policies. Target off-season travelers like remote workers or budget-conscious guests.
- Shoulder Seasons: Implement dynamic pricing that balances peak and low rates. Target weekend travelers or specific events. Offer slightly more flexible terms than peak season.
- Regularly analyze your own performance against these Nopigia seasonality benchmarks and adjust your pricing and availability strategy accordingly.
Best Areas for Airbnb Investment in Nopigia (2026)
Exploring the top neighborhoods for short-term rentals in Nopigia? This section highlights key areas, outlining why they are attractive for hosts and guests, along with notable local attractions. Consider these locations based on your target guest profile and investment strategy.
| Neighborhood / Area | Why Host Here? (Target Guests & Appeal) | Key Attractions & Landmarks |
|---|---|---|
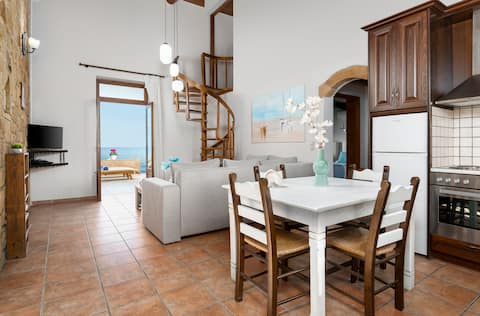
| Nopigia Beach | Beautiful sandy beach with crystal clear waters, perfect for sunbathers and families. Attracts tourists looking for a relaxing vacation close to nature. | Nopigia Beach, Local tavernas, Water sports activities, Scenic coastline, Hiking trails nearby |
| Kolymbari | Charming seaside village known for its authentic Greek culture and delicious seafood restaurants. A popular spot for visitors wanting a quieter, traditional atmosphere. | Kolymbari Beach, The Monastery of Chrissoskalitissa, Fish tavernas, Local markets, Surrounding mountains |
| Platanias | Lively resort area with a vibrant nightlife, shopping, and a variety of accommodation options. Appeals to younger crowds and families looking for entertainment. | Platanias Beach, Nightclubs and bars, Shopping centers, Water parks, Local festivals |
| Kissamos | Historical town with stunning views and access to beautiful beaches. Great for tourists wanting to explore ancient ruins and local culture. | Ancient Kissamos, Falassarna Beach, Balos Lagoon, Local wineries, Cultural festivals |
| Tavronitis | Quaint village located close to the coast and surrounded by scenic landscapes, perfect for those seeking a peaceful escape. | Tavronitis Beach, Hiking trails, Local farms, Historic churches, Traditional villages |
| Gerani | A coastal village known for its lovely beaches and family-friendly atmosphere. Great option for families and those looking for tranquility. | Gerani Beach, Local tavernas, Children's playgrounds, Calm waters, Coastal paths |
| Maleme | Historical significance and beautiful beaches make this area appealing for history buffs and beach lovers alike. Popular for its World War II sites. | Maleme Beach, World War II cemetery, Local history museums, Tavernas, Scenic views |
| Drapanias | Peaceful area with lovely sunsets and rural charm. Ideal for those seeking to escape the tourist crowds and enjoy nature. | Drapanias Beach, Local farms, Fishing activities, Scenic hikes, Quiet ambiance |
Understanding Airbnb License Requirements & STR Laws in Nopigia (2026)
Yes, Nopigia, Region of Crete, Greece enforces high STR regulations. Obtaining a license and ensuring compliance is almost certainly required according to current 2026 STR laws. Always verify the latest short term rental regulations and Airbnb license requirements directly with local government authorities for Nopigia to ensure full compliance before hosting.
(Source: AirROI data, 2026, based on 94% licensed listings)
Top Performing Airbnb Properties in Nopigia (2026)
Benchmark your potential! Explore examples of top-performing Airbnb properties in Nopigiabased on Trailing Twelve Month (TTM) revenue. Analyze their characteristics, revenue, occupancy rate, and ADR to understand what drives success in this market.

NEW VILLA EOS beach front
Entire Place • 4 bedrooms

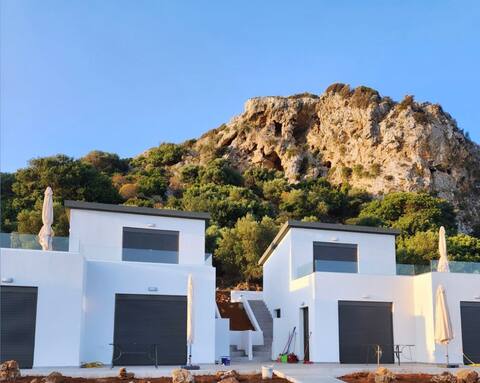
30m to the Beach-Stone villa-Private Pool -Seaview
Entire Place • 4 bedrooms

Amazing Sea View -Pool-Complex up to 21 guests.
Entire Place • 9 bedrooms
Votsalo by the sea 10 metres from the sea
Private Room • 2 bedrooms
Isabel Artemis - Villa In Kissamos - Aura
Entire Place • 2 bedrooms

Onora Villa - Steps from the Sea by etouri
Entire Place • 3 bedrooms
Note: Performance varies based on location, size, amenities, seasonality, and management quality. Data reflects the past 12 months.
Top Performing Airbnb Hosts in Nopigia (2026)
Learn from the best! This table showcases top-performing Airbnb hosts in Nopigia based on the number of properties managed and estimated total revenue over the past year. Analyze their scale and performance metrics.
| Host Name | Properties | Grossing Revenue | Stay Reviews | Avg Rating |
|---|---|---|---|---|
| Nektaria | 3 | $239,757 | 60 | 5.00/5.0 |
| Homeleader | 3 | $112,324 | 130 | 4.78/5.0 |
| Georgios | 8 | $88,106 | 84 | 4.74/5.0 |
| Yair | 2 | $80,692 | 20 | 5.00/5.0 |
| Evi | 2 | $80,367 | 5 | 5.00/5.0 |
| Alexandros | 2 | $61,788 | 29 | 5.00/5.0 |
| Nikolaos | 2 | $56,357 | 76 | 4.94/5.0 |
| Hellenic | 3 | $45,489 | 48 | 4.60/5.0 |
| Bens | 3 | $40,336 | 345 | 4.82/5.0 |
| Kostas Etouri | 1 | $40,278 | 7 | 5.00/5.0 |
Analyzing the strategies of top hosts, such as their property selection, pricing, and guest communication, can offer valuable lessons for optimizing your own Airbnb operations in Nopigia.
Dive Deeper: Advanced Nopigia STR Market Data (2026)
Ready to unlock more insights? AirROI provides access to advanced metrics and comprehensive Airbnb data for Nopigia. Explore detailed analytics beyond this report to refine your investment strategy, optimize pricing, and maximize your vacation rental profits.
Explore Advanced MetricsNopigia Short-Term Rental Market Composition (2026): Property & Room Types
Room Type Distribution
Property Type Distribution
Market Composition Insights for Nopigia
- The Nopigia Airbnb market composition is heavily skewed towards Entire Home/Apt listings, which make up 97.2% of the 72 active rentals. This indicates strong guest preference for privacy and space.
- Looking at the property type distribution in Nopigia, House properties are the most common (54.2%), reflecting the local real estate landscape.
- Houses represent a significant 54.2% portion, catering likely to families or larger groups.
- Smaller segments like others (combined 2.8%) offer potential for unique stay experiences.
Nopigia Airbnb Room Capacity Analysis (2026): Bedroom Distribution
Distribution of Listings by Number of Bedrooms
Room Capacity Insights for Nopigia
- The dominant room capacity in Nopigia is 2 bedrooms listings, making up 34.7% of the market. This suggests a strong demand for properties suitable for couples or solo travelers.
- Together, 2 bedrooms and 1 bedroom properties represent 69.4% of the active Airbnb listings in Nopigia, indicating a high concentration in these sizes.
- A significant 30.6% of listings offer 3+ bedrooms, catering to larger groups and families seeking more space in Nopigia.
Nopigia Vacation Rental Guest Capacity Trends (2026)
Distribution of Listings by Guest Capacity
Guest Capacity Insights for Nopigia
- The most common guest capacity trend in Nopigia vacation rentals is listings accommodating 4 guests (36.1%). This suggests the primary traveler segment is likely small families or groups.
- Properties designed for 4 guests and 6 guests dominate the Nopigia STR market, accounting for 52.8% of listings.
- 37.5% of properties accommodate 6+ guests, serving the market segment for larger families or group travel in Nopigia.
- On average, properties in Nopigia are equipped to host 5.0 guests.
Nopigia Airbnb Booking Patterns (2026): Available vs. Booked Days
Available Days Distribution
Booked Days Distribution
Booking Pattern Insights for Nopigia
- The most common availability pattern in Nopigia falls within the 271-366 days range, representing 59.7% of listings. This suggests many properties have significant open periods on their calendars.
- Approximately 97.2% of listings show high availability (181+ days open annually), indicating potential for increased bookings or specific owner usage patterns.
- For booked days, the 91-180 days range is most frequent in Nopigia (37.5%), reflecting common guest stay durations or potential owner blocking patterns.
- A notable 4.2% of properties secure long booking periods (181+ days booked per year), highlighting successful long-term rental strategies or significant owner usage.
Nopigia Airbnb Minimum Stay Requirements Analysis
Distribution of Listings by Minimum Night Requirement
2 Nights
4 listings
5.6% of total
3 Nights
13 listings
18.1% of total
4-6 Nights
15 listings
20.8% of total
7-29 Nights
4 listings
5.6% of total
30+ Nights
36 listings
50% of total
Key Insights
- The most prevalent minimum stay requirement in Nopigia is 30+ Nights, adopted by 50% of listings. This highlights the market's preference for longer commitments.
- Very short stays (1-2 nights) are less common (5.6%), suggesting hosts prefer slightly longer bookings to optimize turnover.
- A significant segment (50%) caters to monthly stays (30+ nights) in Nopigia, pointing to opportunities in the extended-stay market.
Recommendations
- Align with the market by considering a 30+ Nights minimum stay, as 50% of Nopigia hosts use this setting.
- Explore offering discounts for stays of 30+ nights to attract the 50% of the market seeking extended stays.
- Adjust minimum nights based on seasonality – potentially shorter during low season and longer during peak demand periods in Nopigia.
Nopigia Airbnb Cancellation Policy Trends Analysis (2026)
Limited
2 listings
2.8% of total
Flexible
6 listings
8.3% of total
Moderate
4 listings
5.6% of total
Firm
47 listings
65.3% of total
Strict
13 listings
18.1% of total
Cancellation Policy Insights for Nopigia
- The prevailing Airbnb cancellation policy trend in Nopigia is Firm, used by 65.3% of listings.
- A majority (83.4%) of hosts in Nopigia utilize Firm or Strict policies, indicating a market where hosts prioritize booking security.
Recommendations for Hosts
- Consider adopting a Firm policy to align with the 65.3% market standard in Nopigia.
- Regularly review your cancellation policy against competitors and market demand shifts in Nopigia.
Nopigia STR Booking Lead Time Analysis (2026)
Average Booking Lead Time by Month
Booking Lead Time Insights for Nopigia
- The overall average booking lead time for vacation rentals in Nopigia is 99 days.
- Guests book furthest in advance for stays during August (average 109 days), likely coinciding with peak travel demand or local events.
- The shortest booking windows occur for stays in December (average 7 days), indicating more last-minute travel plans during this time.
- Seasonally, Summer (94 days avg.) sees the longest lead times, while Winter (32 days avg.) has the shortest, reflecting typical travel planning cycles.
Recommendations for Hosts
- Use the overall average lead time (99 days) as a baseline for your pricing and availability strategy in Nopigia.
- During December, focus on last-minute booking availability and promotions, as guests book with very short notice (7 days avg.).
- Target marketing efforts for the Summer season well in advance (at least 94 days) to capture early planners.
- Monitor your own booking lead times against these Nopigia averages to identify opportunities for dynamic pricing adjustments.
Popular & Essential Airbnb Amenities in Nopigia (2026)
Amenity Prevalence
Amenity Insights for Nopigia
- Essential amenities in Nopigia that guests expect include: Wifi, Air conditioning, Kitchen, TV, Hair dryer. Lacking these (any) could significantly impact bookings.
- Popular amenities like Washer, Free parking on premises, Cooking basics are common but not universal. Offering these can provide a competitive edge.
Recommendations for Hosts
- Ensure your listing includes all essential amenities for Nopigia: Wifi, Air conditioning, Kitchen, TV, Hair dryer.
- Prioritize adding missing essentials: Kitchen, TV, Hair dryer.
- Consider adding popular differentiators like Washer or Free parking on premises to increase appeal.
- Highlight unique or less common amenities you offer (e.g., hot tub, dedicated workspace, EV charger) in your listing description and photos.
- Regularly check competitor amenities in Nopigia to stay competitive.
Nopigia Airbnb Guest Demographics & Profile Analysis (2026)
Guest Profile Summary for Nopigia
- The typical guest profile for Airbnb in Nopigia consists of predominantly international visitors (99%), with top international origins including Germany, typically belonging to the Post-2000s (Gen Z/Alpha) group (50%), primarily speaking English or French.
- Domestic travelers account for 1.0% of guests.
- Key international markets include France (29.3%) and Germany (16.1%).
- Top languages spoken are English (41.3%) followed by French (17.4%).
- A significant demographic segment is the Post-2000s (Gen Z/Alpha) group, representing 50% of guests.
Recommendations for Hosts
- Focus marketing internationally, particularly towards travelers from Germany.
- Tailor amenities and listing descriptions to appeal to the dominant Post-2000s (Gen Z/Alpha) demographic (e.g., highlight fast WiFi, smart home features, local guides).
- Highlight unique local experiences or amenities relevant to the primary guest profile.
- Consider seasonal promotions aligned with peak travel times for key origin markets.
Nearby Short-Term Rental Market Comparison
How does the Nopigia Airbnb market stack up against its neighbors? Compare key performance metrics like average monthly revenue, ADR, and occupancy rates in surrounding areas to understand the broader regional STR landscape.
| Market | Active Properties | Monthly Revenue | Daily Rate | Avg. Occupancy |
|---|---|---|---|---|
| Violi Charaki | 21 | $7,037 | $480.16 | 55% |
| Amnatos | 15 | $5,946 | $730.78 | 48% |
| Skaleta | 57 | $5,258 | $581.34 | 48% |
| Viranepiskopi | 11 | $4,940 | $322.10 | 65% |
| Perama | 27 | $4,927 | $392.67 | 52% |
| Pithari | 22 | $4,920 | $412.56 | 55% |
| Xiro Chorio | 20 | $4,573 | $393.88 | 51% |
| Nea Magnisia | 22 | $4,332 | $392.45 | 52% |
| Municipality of Milopotamos | 20 | $3,882 | $348.22 | 51% |
| Tsikalaria | 12 | $3,824 | $280.05 | 50% |