Lampini Airbnb Market Analysis 2026: Short Term Rental Data & Vacation Rental Statistics in Region of Crete, Greece
Is Airbnb profitable in Lampini in 2026? Explore comprehensive Airbnb analytics for Lampini, Region of Crete, Greece to uncover income potential. This 2026 STR market report for Lampini, based on AirROI data from February 2025 to January 2026, reveals key trends in the niche market of 18 active listings.
Whether you're considering an Airbnb investment in Lampini, optimizing your existing vacation rental, or exploring rental arbitrage opportunities, understanding the Lampini Airbnb data is crucial. Navigating the high regulation landscape is key to maximizing your short term rental income potential. Let's dive into the specifics.
Key Lampini Airbnb Performance Metrics Overview
Monthly Airbnb Revenue Variations & Income Potential in Lampini (2026)
Understanding the monthly revenue variations for Airbnb listings in Lampini is key to maximizing your short term rental income potential. Seasonality significantly impacts earnings. Our analysis, based on data from the past 12 months, shows that the peak revenue month for STRs in Lampini is typically July, while February often presents the lowest earnings, highlighting opportunities for strategic pricing adjustments during shoulder and low seasons. Explore the typical Airbnb income in Lampini across different performance tiers:
- Best-in-class properties (Top 10%) achieve $4,127+ monthly, often utilizing dynamic pricing and superior guest experiences.
- Strong performing properties (Top 25%) earn $3,077 or more, indicating effective management and desirable locations/amenities.
- Typical properties (Median) generate around $2,004 per month, representing the average market performance.
- Entry-level properties (Bottom 25%) see earnings around $863, often with potential for optimization.
Average Monthly Airbnb Earnings Trend in Lampini
Lampini Airbnb Occupancy Rate Trends (2026)
Maximize your bookings by understanding the Lampini STR occupancy trends. Seasonal demand shifts significantly influence how often properties are booked. Typically, Julysees the highest demand (peak season occupancy), while February experiences the lowest (low season). Effective strategies, like adjusting minimum stays or offering promotions, can boost occupancy during slower periods. Here's how different property tiers perform in Lampini:
- Best-in-class properties (Top 10%) achieve 62%+ occupancy, indicating high desirability and potentially optimized availability.
- Strong performing properties (Top 25%) maintain 50% or higher occupancy, suggesting good market fit and guest satisfaction.
- Typical properties (Median) have an occupancy rate around 33%.
- Entry-level properties (Bottom 25%) average 23% occupancy, potentially facing higher vacancy.
Average Monthly Occupancy Rate Trend in Lampini
Average Daily Rate (ADR) Airbnb Trends in Lampini (2026)
Effective short term rental pricing strategy in Lampini involves understanding monthly ADR fluctuations. The Average Daily Rate (ADR) for Airbnb in Lampini typically peaks in August and dips lowest during March. Leveraging Airbnb dynamic pricing tools or strategies based on this seasonality can significantly boost revenue. Here's a look at the typical nightly rates achieved:
- Best-in-class properties (Top 10%) command rates of $401+ per night, often due to premium features or locations.
- Strong performing properties (Top 25%) achieve nightly rates of $251 or more.
- Typical properties (Median) charge around $172 per night.
- Entry-level properties (Bottom 25%) earn around $109 per night.
Average Daily Rate (ADR) Trend by Month in Lampini
Get Live Lampini Market Intelligence 👇

Explore Real-time Analytics
Airbnb Seasonality Analysis & Trends in Lampini (2026)
Peak Season (July, August, March)
- Revenue averages $3,765 per month
- Occupancy rates average 46.4%
- Daily rates average $237
Shoulder Season
- Revenue averages $1,918 per month
- Occupancy maintains around 38.1%
- Daily rates hold near $199
Low Season (January, February, December)
- Revenue drops to average $98 per month
- Occupancy decreases to average 2.4%
- Daily rates adjust to average $185
Seasonality Insights for Lampini
- The Airbnb seasonality in Lampini shows highly seasonal trends requiring careful strategy. While the sections above show seasonal averages, it's also insightful to look at the extremes:
- During the high season, the absolute peak month showcases Lampini's highest earning potential, with monthly revenues capable of climbing to $4,006, occupancy reaching a high of 51.1%, and ADRs peaking at $270.
- Conversely, the slowest single month of the year, typically falling within the low season, marks the market's lowest point. In this month, revenue might dip to $0, occupancy could drop to 0.0%, and ADRs may adjust down to $174.
- Understanding both the seasonal averages and these monthly peaks and troughs in revenue, occupancy, and ADR is crucial for maximizing your Airbnb profit potential in Lampini.
Seasonal Strategies for Maximizing Profit
- Peak Season: Maximize revenue through premium pricing and potentially longer minimum stays. Ensure high availability.
- Low Season: Offer competitive pricing, special promotions (e.g., extended stay discounts), and flexible cancellation policies. Target off-season travelers like remote workers or budget-conscious guests.
- Shoulder Seasons: Implement dynamic pricing that balances peak and low rates. Target weekend travelers or specific events. Offer slightly more flexible terms than peak season.
- Regularly analyze your own performance against these Lampini seasonality benchmarks and adjust your pricing and availability strategy accordingly.
Best Areas for Airbnb Investment in Lampini (2026)
Exploring the top neighborhoods for short-term rentals in Lampini? This section highlights key areas, outlining why they are attractive for hosts and guests, along with notable local attractions. Consider these locations based on your target guest profile and investment strategy.
| Neighborhood / Area | Why Host Here? (Target Guests & Appeal) | Key Attractions & Landmarks |
|---|---|---|
| Rethymno Town | A charming waterfront town known for its well-preserved Renaissance architecture and historical sights. Attracts both history enthusiasts and beachgoers looking for a mix of culture and sun. | Rethymno Old Town, Fortress of Fortezza, Rethymno Archaeological Museum, Venetian Harbour, Rethymnon Beach |
| Chania | Chania offers stunning Venetian harbor views, rich history, and a beautiful old town. It's a popular spot for tourists seeking a picturesque escape with great local cuisine. | Chania Old Town, Venetian Lighthouse, Chania Maritime Museum, Nea Chora Beach, Samaria Gorge |
| Heraklion | As the capital of Crete, Heraklion is a bustling city with numerous attractions including the ancient Palace of Knossos. It's ideal for those looking for urban experiences combined with rich history. | Palace of Knossos, Heraklion Archaeological Museum, Historic Center of Heraklion, Morosini Fountain, Koules Fortress |
| Agios Nikolaos | A picturesque town known for its stunning lake and beautiful beaches. Attracts those looking for a relaxed atmosphere and scenic views. | Lake Voulismeni, Agios Nikolaos Beach, Spinalonga Island, Archaeological Museum of Agios Nikolaos, Elounda |
| Elounda | Famous for luxurious resorts and proximity to Spinalonga, this upscale area is ideal for tourists seeking a premium experience consistent with high-end amenities. | Spinalonga Island, Elounda Beach, Plaka Village, Historical Museum of Spinalonga, Mirabello Bay |
| Sitia | A lesser-known gem on the eastern coast, Sitia offers beautiful beaches and a relaxed vibe, perfect for those wanting peace and quiet away from the crowds. | Sitia Beach, Toplou Monastery, Vai Palm Beach, Sitia Archaeological Museum, Kato Zakros |
| Matala | Known for its unique beach and historical caves, Matala attracts visitors looking for a bohemian beach experience with a touch of history. | Matala Beach, Caves of Matala, Red Beach, Kalamaki Beach, Roman Tombs |
| Agia Galini | A charming seaside village known for its laid-back atmosphere, ideal for families and couples looking for a relaxing holiday experience. | Agia Galini Beach, Ancient Zarcus, Church of Panagia, Local taverna dining, Hiking trails nearby |
Understanding Airbnb License Requirements & STR Laws in Lampini (2026)
Yes, Lampini, Region of Crete, Greece enforces high STR regulations. Obtaining a license and ensuring compliance is almost certainly required according to current 2026 STR laws. Always verify the latest short term rental regulations and Airbnb license requirements directly with local government authorities for Lampini to ensure full compliance before hosting.
(Source: AirROI data, 2026, based on 94% licensed listings)
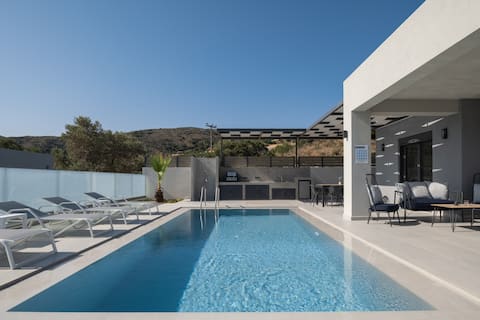
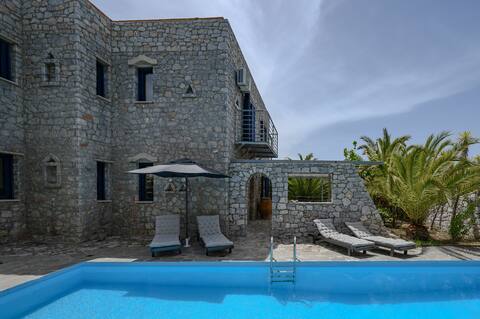
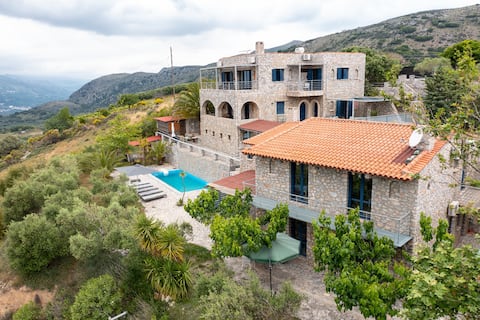
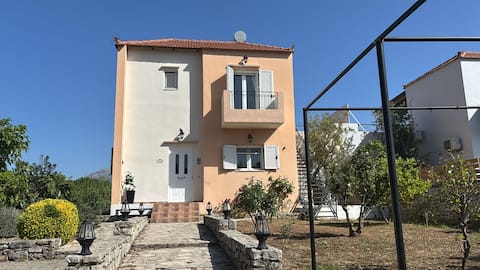
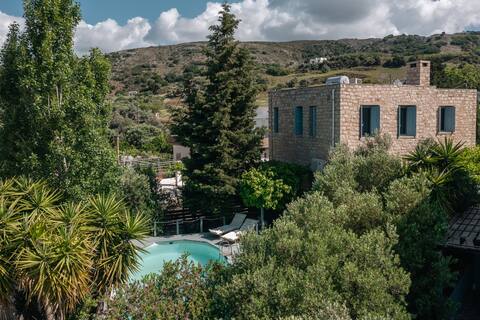
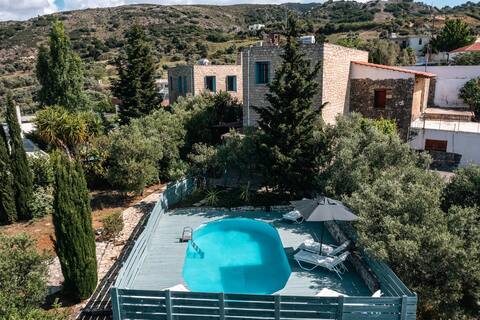
Top Performing Airbnb Properties in Lampini (2026)
Benchmark your potential! Explore examples of top-performing Airbnb properties in Lampinibased on Trailing Twelve Month (TTM) revenue. Analyze their characteristics, revenue, occupancy rate, and ADR to understand what drives success in this market.
Exquisite Villa III with Enchanting Surroundings
Entire Place • 2 bedrooms
Petritis, serene villa, pool, Near taverns, Crete
Entire Place • 5 bedrooms
Manousaki,serene villa,pool,Near taverns
Entire Place • 5 bedrooms
Villa Amalthee
Entire Place • 3 bedrooms
Kandinella,serene villa,pool,Mountains,Near tavern
Entire Place • 2 bedrooms
Rogalida,serene villa,pool,Near taverns
Entire Place • 2 bedrooms
Note: Performance varies based on location, size, amenities, seasonality, and management quality. Data reflects the past 12 months.
Top Performing Airbnb Hosts in Lampini (2026)
Learn from the best! This table showcases top-performing Airbnb hosts in Lampini based on the number of properties managed and estimated total revenue over the past year. Analyze their scale and performance metrics.
| Host Name | Properties | Grossing Revenue | Stay Reviews | Avg Rating |
|---|---|---|---|---|
| Oreo Travel | 5 | $98,497 | 50 | 4.73/5.0 |
| Valia | 1 | $49,585 | 22 | 5.00/5.0 |
| Nikos | 3 | $29,754 | 111 | 4.74/5.0 |
| Debra | 1 | $19,196 | 24 | 4.88/5.0 |
| Olga | 7 | $16,818 | 169 | 4.70/5.0 |
| Georgia | 1 | $2,274 | 14 | 4.71/5.0 |
Analyzing the strategies of top hosts, such as their property selection, pricing, and guest communication, can offer valuable lessons for optimizing your own Airbnb operations in Lampini.
Dive Deeper: Advanced Lampini STR Market Data (2026)
Ready to unlock more insights? AirROI provides access to advanced metrics and comprehensive Airbnb data for Lampini. Explore detailed analytics beyond this report to refine your investment strategy, optimize pricing, and maximize your vacation rental profits.
Explore Advanced MetricsLampini Short-Term Rental Market Composition (2026): Property & Room Types
Room Type Distribution
Property Type Distribution
Market Composition Insights for Lampini
- The Lampini Airbnb market composition is heavily skewed towards Entire Home/Apt listings, which make up 100% of the 18 active rentals. This indicates strong guest preference for privacy and space.
- Looking at the property type distribution in Lampini, House properties are the most common (100%), reflecting the local real estate landscape.
- Houses represent a significant 100% portion, catering likely to families or larger groups.
Lampini Airbnb Room Capacity Analysis (2026): Bedroom Distribution
Distribution of Listings by Number of Bedrooms
Room Capacity Insights for Lampini
- The dominant room capacity in Lampini is 2 bedrooms listings, making up 38.9% of the market. This suggests a strong demand for properties suitable for couples or solo travelers.
- Together, 2 bedrooms and 5+ bedrooms properties represent 66.7% of the active Airbnb listings in Lampini, indicating a high concentration in these sizes.
- A significant 50.0% of listings offer 3+ bedrooms, catering to larger groups and families seeking more space in Lampini.
Lampini Vacation Rental Guest Capacity Trends (2026)
Distribution of Listings by Guest Capacity
Guest Capacity Insights for Lampini
- The most common guest capacity trend in Lampini vacation rentals is listings accommodating 8+ guests (27.8%). This suggests the primary traveler segment is likely larger groups.
- Properties designed for 8+ guests and 2 guests dominate the Lampini STR market, accounting for 44.5% of listings.
- 50.0% of properties accommodate 6+ guests, serving the market segment for larger families or group travel in Lampini.
- On average, properties in Lampini are equipped to host 5.4 guests.
Lampini Airbnb Booking Patterns (2026): Available vs. Booked Days
Available Days Distribution
Booked Days Distribution
Booking Pattern Insights for Lampini
- The most common availability pattern in Lampini falls within the 271-366 days range, representing 72.2% of listings. This suggests many properties have significant open periods on their calendars.
- Approximately 100.0% of listings show high availability (181+ days open annually), indicating potential for increased bookings or specific owner usage patterns.
- For booked days, the 1-30 days range is most frequent in Lampini (44.4%), reflecting common guest stay durations or potential owner blocking patterns.
Lampini Airbnb Minimum Stay Requirements Analysis
Distribution of Listings by Minimum Night Requirement
1 Night
1 listings
5.6% of total
2 Nights
6 listings
33.3% of total
3 Nights
1 listings
5.6% of total
4-6 Nights
1 listings
5.6% of total
30+ Nights
9 listings
50% of total
Key Insights
- The most prevalent minimum stay requirement in Lampini is 30+ Nights, adopted by 50% of listings. This highlights the market's preference for longer commitments.
- A significant segment (50%) caters to monthly stays (30+ nights) in Lampini, pointing to opportunities in the extended-stay market.
Recommendations
- Align with the market by considering a 30+ Nights minimum stay, as 50% of Lampini hosts use this setting.
- If feasible, allowing 1-night stays, especially midweek or during low season, could capture last-minute bookings, as only 5.6% currently do.
- A 2-night minimum appears standard (33.3%). Consider this for weekends or peak periods.
- Explore offering discounts for stays of 30+ nights to attract the 50% of the market seeking extended stays.
- Adjust minimum nights based on seasonality – potentially shorter during low season and longer during peak demand periods in Lampini.
Lampini Airbnb Cancellation Policy Trends Analysis (2026)
Moderate
1 listings
5.6% of total
Firm
10 listings
55.6% of total
Strict
7 listings
38.9% of total
Cancellation Policy Insights for Lampini
- The prevailing Airbnb cancellation policy trend in Lampini is Firm, used by 55.6% of listings.
- A majority (94.5%) of hosts in Lampini utilize Firm or Strict policies, indicating a market where hosts prioritize booking security.
Recommendations for Hosts
- Consider adopting a Firm policy to align with the 55.6% market standard in Lampini.
- With 38.9% using Strict terms, this is a viable option in Lampini, particularly for high-value properties or during peak demand periods.
- Regularly review your cancellation policy against competitors and market demand shifts in Lampini.
Lampini STR Booking Lead Time Analysis (2026)
Average Booking Lead Time by Month
Booking Lead Time Insights for Lampini
- The overall average booking lead time for vacation rentals in Lampini is 97 days.
- Guests book furthest in advance for stays during February (average 195 days), likely coinciding with peak travel demand or local events.
- The shortest booking windows occur for stays in December (average 0 days), indicating more last-minute travel plans during this time.
- Seasonally, Summer (112 days avg.) sees the longest lead times, while Fall (55 days avg.) has the shortest, reflecting typical travel planning cycles.
Recommendations for Hosts
- Use the overall average lead time (97 days) as a baseline for your pricing and availability strategy in Lampini.
- For February stays, consider implementing length-of-stay discounts or slightly higher rates for bookings made less than 195 days out to capitalize on advance planning.
- During December, focus on last-minute booking availability and promotions, as guests book with very short notice (0 days avg.).
- Target marketing efforts for the Summer season well in advance (at least 112 days) to capture early planners.
- Monitor your own booking lead times against these Lampini averages to identify opportunities for dynamic pricing adjustments.
Popular & Essential Airbnb Amenities in Lampini (2026)
Amenity Prevalence
Amenity Insights for Lampini
- Essential amenities in Lampini that guests expect include: Wifi, Air conditioning, Kitchen, Free parking on premises. Lacking these (any) could significantly impact bookings.
- Popular amenities like Hair dryer, Heating, TV are common but not universal. Offering these can provide a competitive edge.
- A pool is a highly desired but not standard amenity, making it a key feature for attracting guests seeking leisure in Lampini.
Recommendations for Hosts
- Ensure your listing includes all essential amenities for Lampini: Wifi, Air conditioning, Kitchen, Free parking on premises.
- Consider adding popular differentiators like Hair dryer or Heating to increase appeal.
- Highlight unique or less common amenities you offer (e.g., hot tub, dedicated workspace, EV charger) in your listing description and photos.
- Regularly check competitor amenities in Lampini to stay competitive.
Lampini Airbnb Guest Demographics & Profile Analysis (2026)
Guest Profile Summary for Lampini
- The typical guest profile for Airbnb in Lampini consists of predominantly international visitors (100%), with top international origins including France, typically belonging to the 1980s (Millennials) group (50%), primarily speaking English or Hebrew.
- Domestic travelers account for 0.0% of guests.
- Key international markets include United Kingdom (33.3%) and France (23.8%).
- Top languages spoken are English (40%) followed by Hebrew (20%).
- A significant demographic segment is the Post-2000s (Gen Z/Alpha) group, representing 50% of guests.
Recommendations for Hosts
- Focus marketing internationally, particularly towards travelers from France.
- Tailor amenities and listing descriptions to appeal to the dominant 1980s (Millennials) demographic (e.g., highlight fast WiFi, smart home features, local guides).
- Highlight unique local experiences or amenities relevant to the primary guest profile.
- Consider seasonal promotions aligned with peak travel times for key origin markets.
Nearby Short-Term Rental Market Comparison
How does the Lampini Airbnb market stack up against its neighbors? Compare key performance metrics like average monthly revenue, ADR, and occupancy rates in surrounding areas to understand the broader regional STR landscape.
| Market | Active Properties | Monthly Revenue | Daily Rate | Avg. Occupancy |
|---|---|---|---|---|
| Violi Charaki | 21 | $7,037 | $480.16 | 55% |
| Amnatos | 15 | $5,946 | $730.78 | 48% |
| Skaleta | 57 | $5,258 | $581.34 | 48% |
| Viranepiskopi | 11 | $4,940 | $322.10 | 65% |
| Perama | 27 | $4,927 | $392.67 | 52% |
| Pithari | 22 | $4,920 | $412.56 | 55% |
| Xiro Chorio | 20 | $4,573 | $393.88 | 51% |
| Nea Magnisia | 22 | $4,332 | $392.45 | 52% |
| Municipality of Milopotamos | 20 | $3,882 | $348.22 | 51% |
| Ia Municipal Unit | 722 | $3,844 | $396.32 | 42% |