Vlahata Airbnb Market Analysis 2026: Short Term Rental Data & Vacation Rental Statistics in Peloponnese, Western Greece and the Ionian, Greece
Is Airbnb profitable in Vlahata in 2026? Explore comprehensive Airbnb analytics for Vlahata, Peloponnese, Western Greece and the Ionian, Greece to uncover income potential. This 2026 STR market report for Vlahata, based on AirROI data from February 2025 to January 2026, reveals key trends in the niche market of 90 active listings.
Whether you're considering an Airbnb investment in Vlahata, optimizing your existing vacation rental, or exploring rental arbitrage opportunities, understanding the Vlahata Airbnb data is crucial. Navigating the high regulation landscape is key to maximizing your short term rental income potential. Let's dive into the specifics.
Key Vlahata Airbnb Performance Metrics Overview
Monthly Airbnb Revenue Variations & Income Potential in Vlahata (2026)
Understanding the monthly revenue variations for Airbnb listings in Vlahata is key to maximizing your short term rental income potential. Seasonality significantly impacts earnings. Our analysis, based on data from the past 12 months, shows that the peak revenue month for STRs in Vlahata is typically August, while January often presents the lowest earnings, highlighting opportunities for strategic pricing adjustments during shoulder and low seasons. Explore the typical Airbnb income in Vlahata across different performance tiers:
- Best-in-class properties (Top 10%) achieve $7,945+ monthly, often utilizing dynamic pricing and superior guest experiences.
- Strong performing properties (Top 25%) earn $5,533 or more, indicating effective management and desirable locations/amenities.
- Typical properties (Median) generate around $2,445 per month, representing the average market performance.
- Entry-level properties (Bottom 25%) see earnings around $1,131, often with potential for optimization.
Average Monthly Airbnb Earnings Trend in Vlahata
Vlahata Airbnb Occupancy Rate Trends (2026)
Maximize your bookings by understanding the Vlahata STR occupancy trends. Seasonal demand shifts significantly influence how often properties are booked. Typically, Augustsees the highest demand (peak season occupancy), while February experiences the lowest (low season). Effective strategies, like adjusting minimum stays or offering promotions, can boost occupancy during slower periods. Here's how different property tiers perform in Vlahata:
- Best-in-class properties (Top 10%) achieve 76%+ occupancy, indicating high desirability and potentially optimized availability.
- Strong performing properties (Top 25%) maintain 60% or higher occupancy, suggesting good market fit and guest satisfaction.
- Typical properties (Median) have an occupancy rate around 41%.
- Entry-level properties (Bottom 25%) average 25% occupancy, potentially facing higher vacancy.
Average Monthly Occupancy Rate Trend in Vlahata
Average Daily Rate (ADR) Airbnb Trends in Vlahata (2026)
Effective short term rental pricing strategy in Vlahata involves understanding monthly ADR fluctuations. The Average Daily Rate (ADR) for Airbnb in Vlahata typically peaks in August and dips lowest during April. Leveraging Airbnb dynamic pricing tools or strategies based on this seasonality can significantly boost revenue. Here's a look at the typical nightly rates achieved:
- Best-in-class properties (Top 10%) command rates of $424+ per night, often due to premium features or locations.
- Strong performing properties (Top 25%) achieve nightly rates of $283 or more.
- Typical properties (Median) charge around $172 per night.
- Entry-level properties (Bottom 25%) earn around $116 per night.
Average Daily Rate (ADR) Trend by Month in Vlahata
Get Live Vlahata Market Intelligence 👇

Explore Real-time Analytics
Airbnb Seasonality Analysis & Trends in Vlahata (2026)
Peak Season (August, July, June)
- Revenue averages $6,484 per month
- Occupancy rates average 66.8%
- Daily rates average $289
Shoulder Season
- Revenue averages $3,331 per month
- Occupancy maintains around 40.2%
- Daily rates hold near $206
Low Season (January, February, October)
- Revenue drops to average $1,412 per month
- Occupancy decreases to average 27.6%
- Daily rates adjust to average $211
Seasonality Insights for Vlahata
- The Airbnb seasonality in Vlahata shows highly seasonal trends requiring careful strategy. While the sections above show seasonal averages, it's also insightful to look at the extremes:
- During the high season, the absolute peak month showcases Vlahata's highest earning potential, with monthly revenues capable of climbing to $7,164, occupancy reaching a high of 71.5%, and ADRs peaking at $307.
- Conversely, the slowest single month of the year, typically falling within the low season, marks the market's lowest point. In this month, revenue might dip to $1,002, occupancy could drop to 23.2%, and ADRs may adjust down to $166.
- Understanding both the seasonal averages and these monthly peaks and troughs in revenue, occupancy, and ADR is crucial for maximizing your Airbnb profit potential in Vlahata.
Seasonal Strategies for Maximizing Profit
- Peak Season: Maximize revenue through premium pricing and potentially longer minimum stays. Ensure high availability.
- Low Season: Offer competitive pricing, special promotions (e.g., extended stay discounts), and flexible cancellation policies. Target off-season travelers like remote workers or budget-conscious guests.
- Shoulder Seasons: Implement dynamic pricing that balances peak and low rates. Target weekend travelers or specific events. Offer slightly more flexible terms than peak season.
- Regularly analyze your own performance against these Vlahata seasonality benchmarks and adjust your pricing and availability strategy accordingly.
Best Areas for Airbnb Investment in Vlahata (2026)
Exploring the top neighborhoods for short-term rentals in Vlahata? This section highlights key areas, outlining why they are attractive for hosts and guests, along with notable local attractions. Consider these locations based on your target guest profile and investment strategy.
| Neighborhood / Area | Why Host Here? (Target Guests & Appeal) | Key Attractions & Landmarks |
|---|---|---|
| Vlahata Beach | A beautiful beach destination ideal for relaxation and water sports. Close to popular beaches and natural beauty, it attracts tourists looking for a combination of nature and leisure activities. | Vlahata Beach, Kournas Lake, Mount Ainos National Park, Myrtos Beach, Assos Village |
| Lixouri | A charming town with a laid-back atmosphere, perfect for families and couples. Offers stunning views and local cuisine, making it a great location for visitors seeking authentic Greek culture. | Lixouri Port, Petani Beach, Koutala Beach, Xi Beach, Lighthouse of Saint Theodoroi |
| Argostoli | The capital town of Kefalonia, rich in history and vibrant nightlife. A great base for exploring the island and enjoying local shopping and dining experiences. | Argostoli Harbour, De Bosset Bridge, Kefalonia Museum of Ancient Greek Technology, Koutavos Lagoon, Makris Gialos Beach |
| Skala | Known for its beautiful sandy beach and tourist-friendly atmosphere. Attracts beach lovers and those looking to enjoy water activities and nightlife. | Skala Beach, Old Skala Village, Kaminia Beach, Domaine Foivos |
| Fiskardo | A picturesque harbor village with stunning architecture and a trendy vibe. Popular with tourists for its dining and shopping options along the waterfront. | Fiskardo Harbor, Emblisi Beach, Dafnoudi Beach, Kefalonia Wine Tour |
| Kioni | A quiet traditional village with beautiful views. Ideal for travelers looking for tranquility, hiking opportunities, and authentic local experiences. | Kioni Beach, Ammousa Beach, Hiking Trails, Kioni Port |
| Poros | A scenic coastal town that serves as a gateway to exploring the local marine environment. Known for its natural beauty and inviting beaches. | Poros Beach, Askeli Beach, Klimatsias Beach, Poros Marina |
| Sami | An attractive village known for its history and beautiful beaches. Closely located to famous spots like Melissani Cave, it's ideal for tourists looking for both adventure and relaxation. | Melissani Cave, Antisamos Beach, Sami Beach, Drogarati Cave |
Understanding Airbnb License Requirements & STR Laws in Vlahata (2026)
Yes, Vlahata, Peloponnese, Western Greece and the Ionian, Greece enforces high STR regulations. Obtaining a license and ensuring compliance is almost certainly required according to current 2026 STR laws. Always verify the latest short term rental regulations and Airbnb license requirements directly with local government authorities for Vlahata to ensure full compliance before hosting.
(Source: AirROI data, 2026, based on 89% licensed listings)
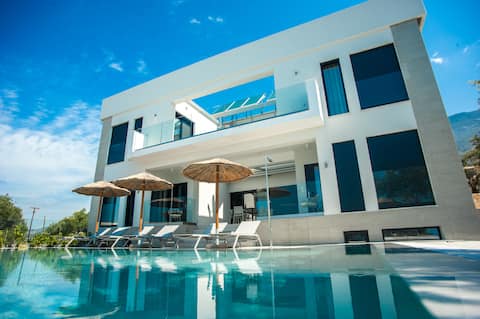
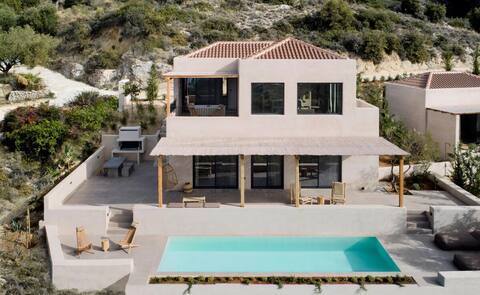
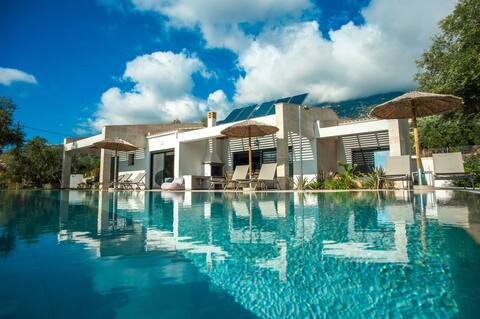
Top Performing Airbnb Properties in Vlahata (2026)
Benchmark your potential! Explore examples of top-performing Airbnb properties in Vlahatabased on Trailing Twelve Month (TTM) revenue. Analyze their characteristics, revenue, occupancy rate, and ADR to understand what drives success in this market.
Villa Azzurro - Amazing Sea Views, Close To Beach!
Entire Place • 5 bedrooms
Villa Olivio - Secret Roc Villas
Entire Place • 2 bedrooms

Villa Kefalos of Lithos Villas
Entire Place • 2 bedrooms

The Dukes Villa
Entire Place • 2 bedrooms

Villa FabView
Entire Place • 2 bedrooms
Luxurious Villa Arte - 12mins Walk to Kanali Beach
Entire Place • 3 bedrooms
Note: Performance varies based on location, size, amenities, seasonality, and management quality. Data reflects the past 12 months.
Top Performing Airbnb Hosts in Vlahata (2026)
Learn from the best! This table showcases top-performing Airbnb hosts in Vlahata based on the number of properties managed and estimated total revenue over the past year. Analyze their scale and performance metrics.
| Host Name | Properties | Grossing Revenue | Stay Reviews | Avg Rating |
|---|---|---|---|---|
| Neil | 4 | $328,304 | 226 | 5.00/5.0 |
| Haris | 3 | $226,664 | 121 | 4.99/5.0 |
| Richard | 10 | $174,676 | 65 | 4.69/5.0 |
| Spyridon | 2 | $138,400 | 122 | 4.99/5.0 |
| Kefalonia Hidden Gems | 7 | $125,830 | 138 | 4.77/5.0 |
| Solmar Villas | 4 | $100,735 | 5 | Not Rated |
| Clayde | 2 | $95,146 | 89 | 4.97/5.0 |
| Κώστας | 2 | $82,108 | 122 | 4.96/5.0 |
| Panagis | 2 | $76,366 | 121 | 4.92/5.0 |
| Daniel | 2 | $73,609 | 14 | 5.00/5.0 |
Analyzing the strategies of top hosts, such as their property selection, pricing, and guest communication, can offer valuable lessons for optimizing your own Airbnb operations in Vlahata.
Dive Deeper: Advanced Vlahata STR Market Data (2026)
Ready to unlock more insights? AirROI provides access to advanced metrics and comprehensive Airbnb data for Vlahata. Explore detailed analytics beyond this report to refine your investment strategy, optimize pricing, and maximize your vacation rental profits.
Explore Advanced MetricsVlahata Short-Term Rental Market Composition (2026): Property & Room Types
Room Type Distribution
Property Type Distribution
Market Composition Insights for Vlahata
- The Vlahata Airbnb market composition is heavily skewed towards Entire Home/Apt listings, which make up 97.8% of the 90 active rentals. This indicates strong guest preference for privacy and space.
- Looking at the property type distribution in Vlahata, House properties are the most common (61.1%), reflecting the local real estate landscape.
- Houses represent a significant 61.1% portion, catering likely to families or larger groups.
- Smaller segments like hotel/boutique (combined 2.2%) offer potential for unique stay experiences.
Vlahata Airbnb Room Capacity Analysis (2026): Bedroom Distribution
Distribution of Listings by Number of Bedrooms
Room Capacity Insights for Vlahata
- The dominant room capacity in Vlahata is 2 bedrooms listings, making up 36.7% of the market. This suggests a strong demand for properties suitable for couples or solo travelers.
- Together, 2 bedrooms and 1 bedroom properties represent 70.0% of the active Airbnb listings in Vlahata, indicating a high concentration in these sizes.
- A significant 25.5% of listings offer 3+ bedrooms, catering to larger groups and families seeking more space in Vlahata.
Vlahata Vacation Rental Guest Capacity Trends (2026)
Distribution of Listings by Guest Capacity
Guest Capacity Insights for Vlahata
- The most common guest capacity trend in Vlahata vacation rentals is listings accommodating 4 guests (31.1%). This suggests the primary traveler segment is likely small families or groups.
- Properties designed for 4 guests and 2 guests dominate the Vlahata STR market, accounting for 52.2% of listings.
- 28.9% of properties accommodate 6+ guests, serving the market segment for larger families or group travel in Vlahata.
- On average, properties in Vlahata are equipped to host 4.3 guests.
Vlahata Airbnb Booking Patterns (2026): Available vs. Booked Days
Available Days Distribution
Booked Days Distribution
Booking Pattern Insights for Vlahata
- The most common availability pattern in Vlahata falls within the 271-366 days range, representing 51.1% of listings. This suggests many properties have significant open periods on their calendars.
- Approximately 91.1% of listings show high availability (181+ days open annually), indicating potential for increased bookings or specific owner usage patterns.
- For booked days, the 91-180 days range is most frequent in Vlahata (42.2%), reflecting common guest stay durations or potential owner blocking patterns.
- A notable 8.9% of properties secure long booking periods (181+ days booked per year), highlighting successful long-term rental strategies or significant owner usage.
Vlahata Airbnb Minimum Stay Requirements Analysis
Distribution of Listings by Minimum Night Requirement
3 Nights
27 listings
30% of total
4-6 Nights
39 listings
43.3% of total
30+ Nights
24 listings
26.7% of total
Key Insights
- The most prevalent minimum stay requirement in Vlahata is 4-6 Nights, adopted by 43.3% of listings. This highlights the market's preference for longer commitments.
- A significant segment (26.7%) caters to monthly stays (30+ nights) in Vlahata, pointing to opportunities in the extended-stay market.
Recommendations
- Align with the market by considering a 4-6 Nights minimum stay, as 43.3% of Vlahata hosts use this setting.
- Explore offering discounts for stays of 30+ nights to attract the 26.7% of the market seeking extended stays.
- Adjust minimum nights based on seasonality – potentially shorter during low season and longer during peak demand periods in Vlahata.
Vlahata Airbnb Cancellation Policy Trends Analysis (2026)
Super Strict 60 Days
1 listings
1.1% of total
Super Strict 30 Days
11 listings
12.2% of total
Limited
3 listings
3.3% of total
Flexible
5 listings
5.6% of total
Moderate
1 listings
1.1% of total
Firm
35 listings
38.9% of total
Strict
34 listings
37.8% of total
Cancellation Policy Insights for Vlahata
- The prevailing Airbnb cancellation policy trend in Vlahata is Firm, used by 38.9% of listings.
- A majority (76.7%) of hosts in Vlahata utilize Firm or Strict policies, indicating a market where hosts prioritize booking security.
Recommendations for Hosts
- Consider adopting a Firm policy to align with the 38.9% market standard in Vlahata.
- With 37.8% using Strict terms, this is a viable option in Vlahata, particularly for high-value properties or during peak demand periods.
- Regularly review your cancellation policy against competitors and market demand shifts in Vlahata.
Vlahata STR Booking Lead Time Analysis (2026)
Average Booking Lead Time by Month
Booking Lead Time Insights for Vlahata
- The overall average booking lead time for vacation rentals in Vlahata is 100 days.
- Guests book furthest in advance for stays during February (average 191 days), likely coinciding with peak travel demand or local events.
- The shortest booking windows occur for stays in April (average 85 days), indicating more last-minute travel plans during this time.
- Seasonally, Winter (155 days avg.) sees the longest lead times, while Summer (101 days avg.) has the shortest, reflecting typical travel planning cycles.
Recommendations for Hosts
- Use the overall average lead time (100 days) as a baseline for your pricing and availability strategy in Vlahata.
- For February stays, consider implementing length-of-stay discounts or slightly higher rates for bookings made less than 191 days out to capitalize on advance planning.
- Target marketing efforts for the Winter season well in advance (at least 155 days) to capture early planners.
- Monitor your own booking lead times against these Vlahata averages to identify opportunities for dynamic pricing adjustments.
Popular & Essential Airbnb Amenities in Vlahata (2026)
Amenity Prevalence
Amenity Insights for Vlahata
- Essential amenities in Vlahata that guests expect include: Wifi, Air conditioning. Lacking these (any) could significantly impact bookings.
- Popular amenities like Kitchen, Hair dryer, TV are common but not universal. Offering these can provide a competitive edge.
Recommendations for Hosts
- Ensure your listing includes all essential amenities for Vlahata: Wifi, Air conditioning.
- Prioritize adding missing essentials: Air conditioning.
- Consider adding popular differentiators like Kitchen or Hair dryer to increase appeal.
- Highlight unique or less common amenities you offer (e.g., hot tub, dedicated workspace, EV charger) in your listing description and photos.
- Regularly check competitor amenities in Vlahata to stay competitive.
Vlahata Airbnb Guest Demographics & Profile Analysis (2026)
Guest Profile Summary for Vlahata
- The typical guest profile for Airbnb in Vlahata consists of predominantly international visitors (99%), with top international origins including United States, typically belonging to the Post-2000s (Gen Z/Alpha) group (50%), primarily speaking English or German.
- Domestic travelers account for 0.8% of guests.
- Key international markets include United Kingdom (42.8%) and United States (11.7%).
- Top languages spoken are English (48.9%) followed by German (14.5%).
- A significant demographic segment is the Post-2000s (Gen Z/Alpha) group, representing 50% of guests.
Recommendations for Hosts
- Focus marketing internationally, particularly towards travelers from United States.
- Tailor amenities and listing descriptions to appeal to the dominant Post-2000s (Gen Z/Alpha) demographic (e.g., highlight fast WiFi, smart home features, local guides).
- Highlight unique local experiences or amenities relevant to the primary guest profile.
- Consider seasonal promotions aligned with peak travel times for key origin markets.
Nearby Short-Term Rental Market Comparison
How does the Vlahata Airbnb market stack up against its neighbors? Compare key performance metrics like average monthly revenue, ADR, and occupancy rates in surrounding areas to understand the broader regional STR landscape.
| Market | Active Properties | Monthly Revenue | Daily Rate | Avg. Occupancy |
|---|---|---|---|---|
| Kalipado | 17 | $2,929 | $395.13 | 45% |
| Varvara | 96 | $2,912 | $381.58 | 47% |
| Kassopaia Municipal Unit | 527 | $2,795 | $277.75 | 52% |
| Παντοκράτορας | 16 | $2,786 | $348.74 | 41% |
| Lithakia | 47 | $2,545 | $368.38 | 44% |
| Tragaki | 23 | $2,543 | $283.72 | 52% |
| Erisos Municipal Unit | 268 | $2,408 | $288.68 | 47% |
| Kipseli | 21 | $2,389 | $225.31 | 48% |
| Argostoli Municipality | 36 | $2,309 | $396.50 | 43% |
| Spartilas | 32 | $2,300 | $263.25 | 50% |