Municipal Unit of Lerna Airbnb Market Analysis 2026: Short Term Rental Data & Vacation Rental Statistics in Peloponnese, Western Greece and the Ionian, Greece
Is Airbnb profitable in Municipal Unit of Lerna in 2026? Explore comprehensive Airbnb analytics for Municipal Unit of Lerna, Peloponnese, Western Greece and the Ionian, Greece to uncover income potential. This 2026 STR market report for Municipal Unit of Lerna, based on AirROI data from February 2025 to January 2026, reveals key trends in the niche market of 39 active listings.
Whether you're considering an Airbnb investment in Municipal Unit of Lerna, optimizing your existing vacation rental, or exploring rental arbitrage opportunities, understanding the Municipal Unit of Lerna Airbnb data is crucial. Navigating the high regulation landscape is key to maximizing your short term rental income potential. Let's dive into the specifics.
Key Municipal Unit of Lerna Airbnb Performance Metrics Overview
Monthly Airbnb Revenue Variations & Income Potential in Municipal Unit of Lerna (2026)
Understanding the monthly revenue variations for Airbnb listings in Municipal Unit of Lerna is key to maximizing your short term rental income potential. Seasonality significantly impacts earnings. Our analysis, based on data from the past 12 months, shows that the peak revenue month for STRs in Municipal Unit of Lerna is typically August, while February often presents the lowest earnings, highlighting opportunities for strategic pricing adjustments during shoulder and low seasons. Explore the typical Airbnb income in Municipal Unit of Lerna across different performance tiers:
- Best-in-class properties (Top 10%) achieve $3,189+ monthly, often utilizing dynamic pricing and superior guest experiences.
- Strong performing properties (Top 25%) earn $1,746 or more, indicating effective management and desirable locations/amenities.
- Typical properties (Median) generate around $1,024 per month, representing the average market performance.
- Entry-level properties (Bottom 25%) see earnings around $562, often with potential for optimization.
Average Monthly Airbnb Earnings Trend in Municipal Unit of Lerna
Municipal Unit of Lerna Airbnb Occupancy Rate Trends (2026)
Maximize your bookings by understanding the Municipal Unit of Lerna STR occupancy trends. Seasonal demand shifts significantly influence how often properties are booked. Typically, Augustsees the highest demand (peak season occupancy), while February experiences the lowest (low season). Effective strategies, like adjusting minimum stays or offering promotions, can boost occupancy during slower periods. Here's how different property tiers perform in Municipal Unit of Lerna:
- Best-in-class properties (Top 10%) achieve 77%+ occupancy, indicating high desirability and potentially optimized availability.
- Strong performing properties (Top 25%) maintain 45% or higher occupancy, suggesting good market fit and guest satisfaction.
- Typical properties (Median) have an occupancy rate around 27%.
- Entry-level properties (Bottom 25%) average 14% occupancy, potentially facing higher vacancy.
Average Monthly Occupancy Rate Trend in Municipal Unit of Lerna
Average Daily Rate (ADR) Airbnb Trends in Municipal Unit of Lerna (2026)
Effective short term rental pricing strategy in Municipal Unit of Lerna involves understanding monthly ADR fluctuations. The Average Daily Rate (ADR) for Airbnb in Municipal Unit of Lerna typically peaks in August and dips lowest during February. Leveraging Airbnb dynamic pricing tools or strategies based on this seasonality can significantly boost revenue. Here's a look at the typical nightly rates achieved:
- Best-in-class properties (Top 10%) command rates of $251+ per night, often due to premium features or locations.
- Strong performing properties (Top 25%) achieve nightly rates of $152 or more.
- Typical properties (Median) charge around $107 per night.
- Entry-level properties (Bottom 25%) earn around $85 per night.
Average Daily Rate (ADR) Trend by Month in Municipal Unit of Lerna
Get Live Municipal Unit of Lerna Market Intelligence 👇

Explore Real-time Analytics
Airbnb Seasonality Analysis & Trends in Municipal Unit of Lerna (2026)
Peak Season (August, July, September)
- Revenue averages $2,417 per month
- Occupancy rates average 49.4%
- Daily rates average $149
Shoulder Season
- Revenue averages $1,305 per month
- Occupancy maintains around 32.6%
- Daily rates hold near $137
Low Season (February, March, December)
- Revenue drops to average $659 per month
- Occupancy decreases to average 22.0%
- Daily rates adjust to average $130
Seasonality Insights for Municipal Unit of Lerna
- The Airbnb seasonality in Municipal Unit of Lerna shows highly seasonal trends requiring careful strategy. While the sections above show seasonal averages, it's also insightful to look at the extremes:
- During the high season, the absolute peak month showcases Municipal Unit of Lerna's highest earning potential, with monthly revenues capable of climbing to $3,057, occupancy reaching a high of 60.5%, and ADRs peaking at $151.
- Conversely, the slowest single month of the year, typically falling within the low season, marks the market's lowest point. In this month, revenue might dip to $293, occupancy could drop to 10.3%, and ADRs may adjust down to $124.
- Understanding both the seasonal averages and these monthly peaks and troughs in revenue, occupancy, and ADR is crucial for maximizing your Airbnb profit potential in Municipal Unit of Lerna.
Seasonal Strategies for Maximizing Profit
- Peak Season: Maximize revenue through premium pricing and potentially longer minimum stays. Ensure high availability.
- Low Season: Offer competitive pricing, special promotions (e.g., extended stay discounts), and flexible cancellation policies. Target off-season travelers like remote workers or budget-conscious guests.
- Shoulder Seasons: Implement dynamic pricing that balances peak and low rates. Target weekend travelers or specific events. Offer slightly more flexible terms than peak season.
- Regularly analyze your own performance against these Municipal Unit of Lerna seasonality benchmarks and adjust your pricing and availability strategy accordingly.
Best Areas for Airbnb Investment in Municipal Unit of Lerna (2026)
Exploring the top neighborhoods for short-term rentals in Municipal Unit of Lerna? This section highlights key areas, outlining why they are attractive for hosts and guests, along with notable local attractions. Consider these locations based on your target guest profile and investment strategy.
| Neighborhood / Area | Why Host Here? (Target Guests & Appeal) | Key Attractions & Landmarks |
|---|---|---|
| Nafplio | A picturesque historical town that is a favorite among tourists due to its beautiful architecture, charming streets, and nearby beaches. Ideal for those seeking cultural experiences and relaxation. | Palamidi Fortress, Bourtzi Fortress, Old Town, Arvanitia Beach, Archaeological Museum of Nauplion |
| Epidaurus | Famous for the ancient theater and its annual theater festival, attracts history buffs and culture lovers. Great for hosting guests looking to explore ancient Greek history and the beautiful surrounding nature. | Ancient Theater of Epidaurus, Asclepius Sanctuary, Epidaurus Museum, Nearby beaches, Natural landscapes |
| Kalamata | Known for its olives and olive oil, Kalamata is a vibrant city with a lively waterfront and nearby beaches, making it appealing for both business and leisure travelers. | Kalamata Olive Oil Museum, Kalamata Beach, Old Kalamata, Castle of Kalamata |
| Tolo | A small seaside village offering beautiful beaches and a relaxed atmosphere, Tolo attracts families and tourists for its welcoming vibe and close proximity to historical sites. | Tolo Beach, Ancient Asine, Karathona Beach, Local tavernas |
| Mystras | A UNESCO World Heritage site, Mystras is rich in history and attracts tourists interested in Byzantine architecture and history. Perfect for those looking for a cultural getaway. | Mystras Castle, Byzantine Churches, Archaeological Museum of Mystras |
| Keri | A charming village on Zakynthos known for its stunning cliff views and proximity to the famous Shipwreck Beach. Attracts visitors seeking the beauty of the Ionian Sea. | Shipwreck Beach, Blue Caves, Keri Lighthouse, Local restaurants |
| Corfu Town | The historic capital of Corfu with Venetian architecture, rich history, and vibrant nightlife. A prime destination for international tourists. | Old Fortress, Liston Promenade, Spianada Square, Achilleion Palace |
| Vassiliki | A popular beach resort in Lefkada known for sailing and watersports. Attracts tourists who enjoy outdoor activities and stunning beaches. | Vassiliki Beach, Windsurfing spots, Nearby islands |
Understanding Airbnb License Requirements & STR Laws in Municipal Unit of Lerna (2026)
Yes, Municipal Unit of Lerna, Peloponnese, Western Greece and the Ionian, Greece enforces high STR regulations. Obtaining a license and ensuring compliance is almost certainly required according to current 2026 STR laws. Always verify the latest short term rental regulations and Airbnb license requirements directly with local government authorities for Municipal Unit of Lerna to ensure full compliance before hosting.
(Source: AirROI data, 2026, based on 77% licensed listings)
Top Performing Airbnb Properties in Municipal Unit of Lerna (2026)
Benchmark your potential! Explore examples of top-performing Airbnb properties in Municipal Unit of Lernabased on Trailing Twelve Month (TTM) revenue. Analyze their characteristics, revenue, occupancy rate, and ADR to understand what drives success in this market.
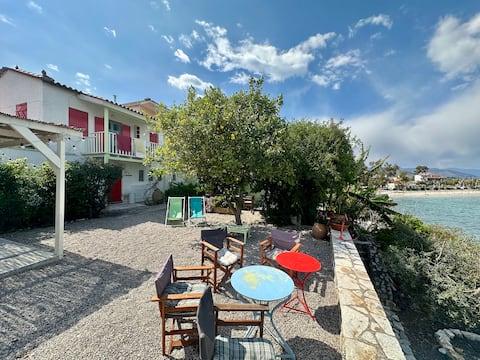
KIVERI 1876 - traditional seafront cottage
Entire Place • 3 bedrooms

Seafront apartment ΙΙ in Kiveri, near Nafplion.
Entire Place • 2 bedrooms
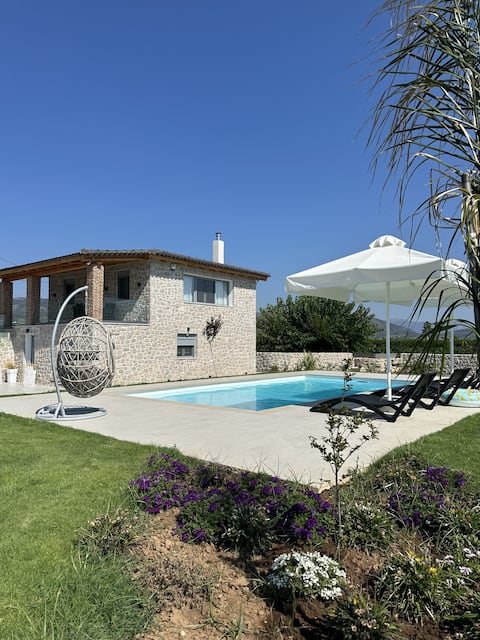
Villa Arancia
Entire Place • 2 bedrooms
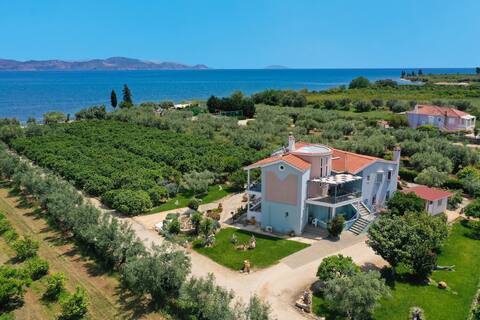
Beachfront Villa Samantha's Paradise
Entire Place • 4 bedrooms

Beachfront house at Kiveri village near Nafplio
Entire Place • 2 bedrooms

Seafront penthouse
Entire Place • 1 bedroom
Note: Performance varies based on location, size, amenities, seasonality, and management quality. Data reflects the past 12 months.
Top Performing Airbnb Hosts in Municipal Unit of Lerna (2026)
Learn from the best! This table showcases top-performing Airbnb hosts in Municipal Unit of Lerna based on the number of properties managed and estimated total revenue over the past year. Analyze their scale and performance metrics.
| Host Name | Properties | Grossing Revenue | Stay Reviews | Avg Rating |
|---|---|---|---|---|
| Dimitrios & Lila | 2 | $48,257 | 223 | 4.92/5.0 |
| Giorgos | 2 | $44,388 | 60 | 4.86/5.0 |
| Dimitris | 1 | $41,977 | 67 | 4.80/5.0 |
| Giannis | 1 | $28,821 | 9 | 5.00/5.0 |
| Αλεξης | 1 | $25,429 | 123 | 4.93/5.0 |
| Εleni | 2 | $21,623 | 122 | 4.92/5.0 |
| Dimitris Sotiria | 1 | $18,668 | 118 | 4.97/5.0 |
| Αναστασία | 1 | $15,619 | 46 | 4.98/5.0 |
| Andreas | 1 | $15,573 | 4 | 5.00/5.0 |
| Panagiotis | 2 | $15,313 | 23 | 5.00/5.0 |
Analyzing the strategies of top hosts, such as their property selection, pricing, and guest communication, can offer valuable lessons for optimizing your own Airbnb operations in Municipal Unit of Lerna.
Dive Deeper: Advanced Municipal Unit of Lerna STR Market Data (2026)
Ready to unlock more insights? AirROI provides access to advanced metrics and comprehensive Airbnb data for Municipal Unit of Lerna. Explore detailed analytics beyond this report to refine your investment strategy, optimize pricing, and maximize your vacation rental profits.
Explore Advanced MetricsMunicipal Unit of Lerna Short-Term Rental Market Composition (2026): Property & Room Types
Room Type Distribution
Property Type Distribution
Market Composition Insights for Municipal Unit of Lerna
- The Municipal Unit of Lerna Airbnb market composition is heavily skewed towards Entire Home/Apt listings, which make up 94.9% of the 39 active rentals. This indicates strong guest preference for privacy and space.
- Looking at the property type distribution in Municipal Unit of Lerna, Apartment/Condo properties are the most common (51.3%), reflecting the local real estate landscape.
- Houses represent a significant 46.2% portion, catering likely to families or larger groups.
- Smaller segments like others (combined 2.6%) offer potential for unique stay experiences.
Municipal Unit of Lerna Airbnb Room Capacity Analysis (2026): Bedroom Distribution
Distribution of Listings by Number of Bedrooms
Room Capacity Insights for Municipal Unit of Lerna
- The dominant room capacity in Municipal Unit of Lerna is 2 bedrooms listings, making up 43.6% of the market. This suggests a strong demand for properties suitable for couples or solo travelers.
- Together, 2 bedrooms and 1 bedroom properties represent 76.9% of the active Airbnb listings in Municipal Unit of Lerna, indicating a high concentration in these sizes.
Municipal Unit of Lerna Vacation Rental Guest Capacity Trends (2026)
Distribution of Listings by Guest Capacity
Guest Capacity Insights for Municipal Unit of Lerna
- The most common guest capacity trend in Municipal Unit of Lerna vacation rentals is listings accommodating 4 guests (43.6%). This suggests the primary traveler segment is likely small families or groups.
- Properties designed for 4 guests and 8+ guests dominate the Municipal Unit of Lerna STR market, accounting for 59.0% of listings.
- 25.6% of properties accommodate 6+ guests, serving the market segment for larger families or group travel in Municipal Unit of Lerna.
- On average, properties in Municipal Unit of Lerna are equipped to host 4.6 guests.
Municipal Unit of Lerna Airbnb Booking Patterns (2026): Available vs. Booked Days
Available Days Distribution
Booked Days Distribution
Booking Pattern Insights for Municipal Unit of Lerna
- The most common availability pattern in Municipal Unit of Lerna falls within the 271-366 days range, representing 74.4% of listings. This suggests many properties have significant open periods on their calendars.
- Approximately 89.8% of listings show high availability (181+ days open annually), indicating potential for increased bookings or specific owner usage patterns.
- For booked days, the 31-90 days range is most frequent in Municipal Unit of Lerna (41%), reflecting common guest stay durations or potential owner blocking patterns.
- A notable 10.3% of properties secure long booking periods (181+ days booked per year), highlighting successful long-term rental strategies or significant owner usage.
Municipal Unit of Lerna Airbnb Minimum Stay Requirements Analysis
Distribution of Listings by Minimum Night Requirement
2 Nights
14 listings
35.9% of total
3 Nights
6 listings
15.4% of total
4-6 Nights
8 listings
20.5% of total
7-29 Nights
1 listings
2.6% of total
30+ Nights
10 listings
25.6% of total
Key Insights
- The most prevalent minimum stay requirement in Municipal Unit of Lerna is 2 Nights, adopted by 35.9% of listings. This highlights the market's preference for shorter, flexible bookings.
- A significant segment (25.6%) caters to monthly stays (30+ nights) in Municipal Unit of Lerna, pointing to opportunities in the extended-stay market.
Recommendations
- Align with the market by considering a 2 Nights minimum stay, as 35.9% of Municipal Unit of Lerna hosts use this setting.
- A 2-night minimum appears standard (35.9%). Consider this for weekends or peak periods.
- Explore offering discounts for stays of 30+ nights to attract the 25.6% of the market seeking extended stays.
- Adjust minimum nights based on seasonality – potentially shorter during low season and longer during peak demand periods in Municipal Unit of Lerna.
Municipal Unit of Lerna Airbnb Cancellation Policy Trends Analysis (2026)
Flexible
5 listings
12.8% of total
Moderate
11 listings
28.2% of total
Firm
15 listings
38.5% of total
Strict
8 listings
20.5% of total
Cancellation Policy Insights for Municipal Unit of Lerna
- The prevailing Airbnb cancellation policy trend in Municipal Unit of Lerna is Firm, used by 38.5% of listings.
- A majority (59.0%) of hosts in Municipal Unit of Lerna utilize Firm or Strict policies, indicating a market where hosts prioritize booking security.
Recommendations for Hosts
- Consider adopting a Firm policy to align with the 38.5% market standard in Municipal Unit of Lerna.
- Regularly review your cancellation policy against competitors and market demand shifts in Municipal Unit of Lerna.
Municipal Unit of Lerna STR Booking Lead Time Analysis (2026)
Average Booking Lead Time by Month
Booking Lead Time Insights for Municipal Unit of Lerna
- The overall average booking lead time for vacation rentals in Municipal Unit of Lerna is 63 days.
- Guests book furthest in advance for stays during August (average 98 days), likely coinciding with peak travel demand or local events.
- The shortest booking windows occur for stays in November (average 33 days), indicating more last-minute travel plans during this time.
- Seasonally, Winter (78 days avg.) sees the longest lead times, while Spring (63 days avg.) has the shortest, reflecting typical travel planning cycles.
Recommendations for Hosts
- Use the overall average lead time (63 days) as a baseline for your pricing and availability strategy in Municipal Unit of Lerna.
- For August stays, consider implementing length-of-stay discounts or slightly higher rates for bookings made less than 98 days out to capitalize on advance planning.
- Target marketing efforts for the Winter season well in advance (at least 78 days) to capture early planners.
- Monitor your own booking lead times against these Municipal Unit of Lerna averages to identify opportunities for dynamic pricing adjustments.
Popular & Essential Airbnb Amenities in Municipal Unit of Lerna (2026)
Amenity Prevalence
Amenity Insights for Municipal Unit of Lerna
- Essential amenities in Municipal Unit of Lerna that guests expect include: Air conditioning. Lacking these (this) could significantly impact bookings.
- Popular amenities like Wifi, TV, Dishes and silverware are common but not universal. Offering these can provide a competitive edge.
- Warning: Wifi is not universally provided but is considered essential globally. Ensure reliable Wifi is offered.
Recommendations for Hosts
- Ensure your listing includes all essential amenities for Municipal Unit of Lerna: Air conditioning.
- Consider adding popular differentiators like Wifi or TV to increase appeal.
- Highlight unique or less common amenities you offer (e.g., hot tub, dedicated workspace, EV charger) in your listing description and photos.
- Regularly check competitor amenities in Municipal Unit of Lerna to stay competitive.
Municipal Unit of Lerna Airbnb Guest Demographics & Profile Analysis (2026)
Guest Profile Summary for Municipal Unit of Lerna
- The typical guest profile for Airbnb in Municipal Unit of Lerna consists of predominantly international visitors (92%), with top international origins including Italy, typically belonging to the Post-2000s (Gen Z/Alpha) group (50%), primarily speaking English or French.
- Domestic travelers account for 7.7% of guests.
- Key international markets include France (29.9%) and Italy (12%).
- Top languages spoken are English (44.2%) followed by French (22.1%).
- A significant demographic segment is the Post-2000s (Gen Z/Alpha) group, representing 50% of guests.
Recommendations for Hosts
- Focus marketing internationally, particularly towards travelers from Italy.
- Tailor amenities and listing descriptions to appeal to the dominant Post-2000s (Gen Z/Alpha) demographic (e.g., highlight fast WiFi, smart home features, local guides).
- Highlight unique local experiences or amenities relevant to the primary guest profile.
- Consider seasonal promotions aligned with peak travel times for key origin markets.
Nearby Short-Term Rental Market Comparison
How does the Municipal Unit of Lerna Airbnb market stack up against its neighbors? Compare key performance metrics like average monthly revenue, ADR, and occupancy rates in surrounding areas to understand the broader regional STR landscape.
| Market | Active Properties | Monthly Revenue | Daily Rate | Avg. Occupancy |
|---|---|---|---|---|
| Hydra | 330 | $2,844 | $282.51 | 50% |
| Vouliagmeni Municipal Unit | 183 | $2,263 | $238.50 | 44% |
| Nerotrivia | 15 | $2,060 | $209.06 | 47% |
| Voula | 17 | $1,960 | $221.39 | 45% |
| Spetses | 212 | $1,914 | $345.99 | 36% |
| Municipal Unit of Kranidi | 259 | $1,909 | $368.36 | 33% |
| Vlychos | 16 | $1,906 | $300.90 | 37% |
| Magoula | 13 | $1,902 | $286.78 | 33% |
| Agios Dimitrios | 19 | $1,843 | $238.89 | 36% |
| Municipality of Glyfada | 369 | $1,824 | $184.60 | 43% |