Acharavi Airbnb Market Analysis 2026: Short Term Rental Data & Vacation Rental Statistics in Peloponnese, Western Greece and the Ionian, Greece
Is Airbnb profitable in Acharavi in 2026? Explore comprehensive Airbnb analytics for Acharavi, Peloponnese, Western Greece and the Ionian, Greece to uncover income potential. This 2026 STR market report for Acharavi, based on AirROI data from February 2025 to January 2026, reveals key trends in the niche market of 154 active listings.
Whether you're considering an Airbnb investment in Acharavi, optimizing your existing vacation rental, or exploring rental arbitrage opportunities, understanding the Acharavi Airbnb data is crucial. Navigating the high regulation landscape is key to maximizing your short term rental income potential. Let's dive into the specifics.
Key Acharavi Airbnb Performance Metrics Overview
Monthly Airbnb Revenue Variations & Income Potential in Acharavi (2026)
Understanding the monthly revenue variations for Airbnb listings in Acharavi is key to maximizing your short term rental income potential. Seasonality significantly impacts earnings. Our analysis, based on data from the past 12 months, shows that the peak revenue month for STRs in Acharavi is typically August, while December often presents the lowest earnings, highlighting opportunities for strategic pricing adjustments during shoulder and low seasons. Explore the typical Airbnb income in Acharavi across different performance tiers:
- Best-in-class properties (Top 10%) achieve $5,696+ monthly, often utilizing dynamic pricing and superior guest experiences.
- Strong performing properties (Top 25%) earn $2,942 or more, indicating effective management and desirable locations/amenities.
- Typical properties (Median) generate around $1,703 per month, representing the average market performance.
- Entry-level properties (Bottom 25%) see earnings around $858, often with potential for optimization.
Average Monthly Airbnb Earnings Trend in Acharavi
Acharavi Airbnb Occupancy Rate Trends (2026)
Maximize your bookings by understanding the Acharavi STR occupancy trends. Seasonal demand shifts significantly influence how often properties are booked. Typically, Augustsees the highest demand (peak season occupancy), while December experiences the lowest (low season). Effective strategies, like adjusting minimum stays or offering promotions, can boost occupancy during slower periods. Here's how different property tiers perform in Acharavi:
- Best-in-class properties (Top 10%) achieve 77%+ occupancy, indicating high desirability and potentially optimized availability.
- Strong performing properties (Top 25%) maintain 63% or higher occupancy, suggesting good market fit and guest satisfaction.
- Typical properties (Median) have an occupancy rate around 43%.
- Entry-level properties (Bottom 25%) average 22% occupancy, potentially facing higher vacancy.
Average Monthly Occupancy Rate Trend in Acharavi
Average Daily Rate (ADR) Airbnb Trends in Acharavi (2026)
Effective short term rental pricing strategy in Acharavi involves understanding monthly ADR fluctuations. The Average Daily Rate (ADR) for Airbnb in Acharavi typically peaks in August and dips lowest during March. Leveraging Airbnb dynamic pricing tools or strategies based on this seasonality can significantly boost revenue. Here's a look at the typical nightly rates achieved:
- Best-in-class properties (Top 10%) command rates of $337+ per night, often due to premium features or locations.
- Strong performing properties (Top 25%) achieve nightly rates of $187 or more.
- Typical properties (Median) charge around $119 per night.
- Entry-level properties (Bottom 25%) earn around $86 per night.
Average Daily Rate (ADR) Trend by Month in Acharavi
Get Live Acharavi Market Intelligence 👇

Explore Real-time Analytics
Airbnb Seasonality Analysis & Trends in Acharavi (2026)
Peak Season (August, July, September)
- Revenue averages $4,613 per month
- Occupancy rates average 64.6%
- Daily rates average $206
Shoulder Season
- Revenue averages $2,323 per month
- Occupancy maintains around 42.5%
- Daily rates hold near $169
Low Season (January, February, December)
- Revenue drops to average $1,069 per month
- Occupancy decreases to average 22.1%
- Daily rates adjust to average $170
Seasonality Insights for Acharavi
- The Airbnb seasonality in Acharavi shows highly seasonal trends requiring careful strategy. While the sections above show seasonal averages, it's also insightful to look at the extremes:
- During the high season, the absolute peak month showcases Acharavi's highest earning potential, with monthly revenues capable of climbing to $5,515, occupancy reaching a high of 71.6%, and ADRs peaking at $213.
- Conversely, the slowest single month of the year, typically falling within the low season, marks the market's lowest point. In this month, revenue might dip to $583, occupancy could drop to 14.5%, and ADRs may adjust down to $156.
- Understanding both the seasonal averages and these monthly peaks and troughs in revenue, occupancy, and ADR is crucial for maximizing your Airbnb profit potential in Acharavi.
Seasonal Strategies for Maximizing Profit
- Peak Season: Maximize revenue through premium pricing and potentially longer minimum stays. Ensure high availability.
- Low Season: Offer competitive pricing, special promotions (e.g., extended stay discounts), and flexible cancellation policies. Target off-season travelers like remote workers or budget-conscious guests.
- Shoulder Seasons: Implement dynamic pricing that balances peak and low rates. Target weekend travelers or specific events. Offer slightly more flexible terms than peak season.
- Regularly analyze your own performance against these Acharavi seasonality benchmarks and adjust your pricing and availability strategy accordingly.
Best Areas for Airbnb Investment in Acharavi (2026)
Exploring the top neighborhoods for short-term rentals in Acharavi? This section highlights key areas, outlining why they are attractive for hosts and guests, along with notable local attractions. Consider these locations based on your target guest profile and investment strategy.
| Neighborhood / Area | Why Host Here? (Target Guests & Appeal) | Key Attractions & Landmarks |
|---|---|---|
| Acharavi | Acharavi is a beautiful coastal village in Corfu, known for its stunning beaches and family-friendly atmosphere. It attracts tourists seeking a relaxing vacation with plenty of outdoor activities and local culture. | Acharavi Beach, Antinioti Lagoon, Mount Pantokrator, Corfu Aquarium, Old Perithia, Roda Beach |
| Zagoria | Zagoria is famous for its picturesque mountainous villages and stunning natural landscapes, making it ideal for eco-tourism and those looking to explore nature and traditional Greek culture. | Vikos Gorge, Konitsa Bridge, The Dragon Lake, Traditional stone villages, Voidomatis River, Papingo |
| Kefalonia | Kefalonia is known for its breathtaking beaches and vibrant local culture. It's a popular destination for those seeking a mix of relaxation and outdoor activities in stunning surroundings. | Myrtos Beach, Melissani Cave, Assos Village, Fiskardo Port, Argostoli, Kefalonia Wine Tours |
| Nafplio | Nafplio is a charming seaside town known for its historical significance and beautiful architecture, making it a sought-after destination for history enthusiasts and beachgoers. | Bourtzi Fortress, Palamidi Castle, Arvanitia Beach, Nafplio Old Town, Archaeological Museum of Nafplio, Tomb of Agamemnon |
| Kalambaka | Kalambaka is the gateway to the Meteora monasteries, known for its unique rock formations and religious heritage. It attracts tourists interested in history, culture, and breathtaking views. | Meteora Monasteries, Great Meteoron Monastery, Varlaam Monastery, Kalambaka Town, Kastraki Village, Hiking trails |
| Parga | Parga is a picturesque coastal town that offers stunning natural beauty and a vibrant local atmosphere. It's great for tourists looking for a combination of beach life and cultural experiences. | Valtos Beach, Parga Castle, Lichnos Beach, Ali Pasha Castle, Beautiful Old Town, Water activities |
| Corfu Town | Corfu Town, with its rich history and vibrant atmosphere, is a UNESCO World Heritage site that draws in tourists for its culture, cuisine, and stunning architecture. | Old Fortress, Liston Promenade, Spianada Square, Achilleion Palace, Museum of Asian Art, Saint Spyridon Church |
| Sivota | Sivota is known for its beautiful bay and stunning beaches. It's a popular spot for those looking to enjoy water sports and a laid-back atmosphere away from the busier tourist spots. | Sivota Beach, Mikri Ammos Beach, Bella Vraka Beach, Dafnoudi Beach, Water sports rentals, Traditional tavernas |
Understanding Airbnb License Requirements & STR Laws in Acharavi (2026)
Yes, Acharavi, Peloponnese, Western Greece and the Ionian, Greece enforces high STR regulations. Obtaining a license and ensuring compliance is almost certainly required according to current 2026 STR laws. Always verify the latest short term rental regulations and Airbnb license requirements directly with local government authorities for Acharavi to ensure full compliance before hosting.
(Source: AirROI data, 2026, based on 92% licensed listings)
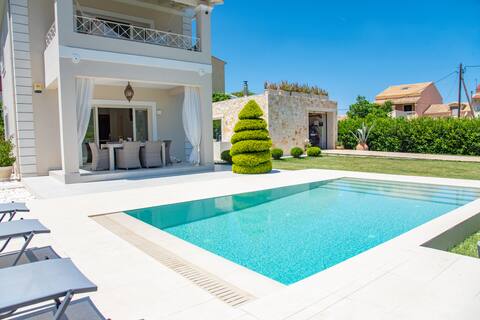
Top Performing Airbnb Properties in Acharavi (2026)
Benchmark your potential! Explore examples of top-performing Airbnb properties in Acharavibased on Trailing Twelve Month (TTM) revenue. Analyze their characteristics, revenue, occupancy rate, and ADR to understand what drives success in this market.
Arivallos Villa & SPA with Sauna and Wine Cellar
Entire Place • 5 bedrooms
Villa Eleni Corfu: Seaview, Pool for 10-20 Guests
Entire Place • 10 bedrooms
Beach Villa Heart House with private pool
Entire Place • 4 bedrooms

Villa Dominante - private pool and Jacuzzi
Entire Place • 4 bedrooms
Beachfront Villa State of Mar Grande
Entire Place • 2 bedrooms
Luxury Seaside villa DARL
Entire Place • 3 bedrooms
Note: Performance varies based on location, size, amenities, seasonality, and management quality. Data reflects the past 12 months.
Top Performing Airbnb Hosts in Acharavi (2026)
Learn from the best! This table showcases top-performing Airbnb hosts in Acharavi based on the number of properties managed and estimated total revenue over the past year. Analyze their scale and performance metrics.
| Host Name | Properties | Grossing Revenue | Stay Reviews | Avg Rating |
|---|---|---|---|---|
| DadoVillas | 11 | $431,395 | 217 | 4.92/5.0 |
| Posarelli Villas | 8 | $373,440 | 30 | 4.47/5.0 |
| Sofia | 1 | $115,422 | 5 | 5.00/5.0 |
| Carine | 1 | $100,959 | 10 | 5.00/5.0 |
| Eos Villas | 4 | $93,539 | 117 | 4.66/5.0 |
| Spiros | 3 | $83,749 | 197 | 4.91/5.0 |
| Marcos | 3 | $76,217 | 137 | 4.97/5.0 |
| Dace | 1 | $71,495 | 20 | 5.00/5.0 |
| White Dream | 1 | $68,136 | 38 | 5.00/5.0 |
| Alki | 3 | $64,102 | 63 | 4.90/5.0 |
Analyzing the strategies of top hosts, such as their property selection, pricing, and guest communication, can offer valuable lessons for optimizing your own Airbnb operations in Acharavi.
Dive Deeper: Advanced Acharavi STR Market Data (2026)
Ready to unlock more insights? AirROI provides access to advanced metrics and comprehensive Airbnb data for Acharavi. Explore detailed analytics beyond this report to refine your investment strategy, optimize pricing, and maximize your vacation rental profits.
Explore Advanced MetricsAcharavi Short-Term Rental Market Composition (2026): Property & Room Types
Room Type Distribution
Property Type Distribution
Market Composition Insights for Acharavi
- The Acharavi Airbnb market composition is heavily skewed towards Entire Home/Apt listings, which make up 89% of the 154 active rentals. This indicates strong guest preference for privacy and space.
- Looking at the property type distribution in Acharavi, Apartment/Condo properties are the most common (51.3%), reflecting the local real estate landscape.
- Houses represent a significant 40.3% portion, catering likely to families or larger groups.
- The presence of 5.8% Hotel/Boutique listings indicates integration with traditional hospitality.
- Smaller segments like others (combined 2.6%) offer potential for unique stay experiences.
Acharavi Airbnb Room Capacity Analysis (2026): Bedroom Distribution
Distribution of Listings by Number of Bedrooms
Room Capacity Insights for Acharavi
- The dominant room capacity in Acharavi is 2 bedrooms listings, making up 44.8% of the market. This suggests a strong demand for properties suitable for couples or solo travelers.
- Together, 2 bedrooms and 1 bedroom properties represent 70.1% of the active Airbnb listings in Acharavi, indicating a high concentration in these sizes.
- A significant 23.9% of listings offer 3+ bedrooms, catering to larger groups and families seeking more space in Acharavi.
Acharavi Vacation Rental Guest Capacity Trends (2026)
Distribution of Listings by Guest Capacity
Guest Capacity Insights for Acharavi
- The most common guest capacity trend in Acharavi vacation rentals is listings accommodating 4 guests (32.5%). This suggests the primary traveler segment is likely small families or groups.
- Properties designed for 4 guests and 5 guests dominate the Acharavi STR market, accounting for 50.0% of listings.
- 23.9% of properties accommodate 6+ guests, serving the market segment for larger families or group travel in Acharavi.
- On average, properties in Acharavi are equipped to host 4.5 guests.
Acharavi Airbnb Booking Patterns (2026): Available vs. Booked Days
Available Days Distribution
Booked Days Distribution
Booking Pattern Insights for Acharavi
- The most common availability pattern in Acharavi falls within the 271-366 days range, representing 57.1% of listings. This suggests many properties have significant open periods on their calendars.
- Approximately 88.9% of listings show high availability (181+ days open annually), indicating potential for increased bookings or specific owner usage patterns.
- For booked days, the 31-90 days range is most frequent in Acharavi (33.8%), reflecting common guest stay durations or potential owner blocking patterns.
- A notable 11.7% of properties secure long booking periods (181+ days booked per year), highlighting successful long-term rental strategies or significant owner usage.
Acharavi Airbnb Minimum Stay Requirements Analysis
Distribution of Listings by Minimum Night Requirement
1 Night
8 listings
5.2% of total
2 Nights
7 listings
4.5% of total
3 Nights
28 listings
18.2% of total
4-6 Nights
59 listings
38.3% of total
7-29 Nights
2 listings
1.3% of total
30+ Nights
50 listings
32.5% of total
Key Insights
- The most prevalent minimum stay requirement in Acharavi is 4-6 Nights, adopted by 38.3% of listings. This highlights the market's preference for longer commitments.
- Very short stays (1-2 nights) are less common (9.7%), suggesting hosts prefer slightly longer bookings to optimize turnover.
- A significant segment (32.5%) caters to monthly stays (30+ nights) in Acharavi, pointing to opportunities in the extended-stay market.
Recommendations
- Align with the market by considering a 4-6 Nights minimum stay, as 38.3% of Acharavi hosts use this setting.
- If feasible, allowing 1-night stays, especially midweek or during low season, could capture last-minute bookings, as only 5.2% currently do.
- Explore offering discounts for stays of 30+ nights to attract the 32.5% of the market seeking extended stays.
- Adjust minimum nights based on seasonality – potentially shorter during low season and longer during peak demand periods in Acharavi.
Acharavi Airbnb Cancellation Policy Trends Analysis (2026)
Super Strict 60 Days
4 listings
2.6% of total
Super Strict 30 Days
10 listings
6.5% of total
Flexible
19 listings
12.3% of total
Moderate
13 listings
8.4% of total
Firm
70 listings
45.5% of total
Strict
38 listings
24.7% of total
Cancellation Policy Insights for Acharavi
- The prevailing Airbnb cancellation policy trend in Acharavi is Firm, used by 45.5% of listings.
- A majority (70.2%) of hosts in Acharavi utilize Firm or Strict policies, indicating a market where hosts prioritize booking security.
Recommendations for Hosts
- Consider adopting a Firm policy to align with the 45.5% market standard in Acharavi.
- Regularly review your cancellation policy against competitors and market demand shifts in Acharavi.
Acharavi STR Booking Lead Time Analysis (2026)
Average Booking Lead Time by Month
Booking Lead Time Insights for Acharavi
- The overall average booking lead time for vacation rentals in Acharavi is 89 days.
- Guests book furthest in advance for stays during February (average 143 days), likely coinciding with peak travel demand or local events.
- The shortest booking windows occur for stays in January (average 2 days), indicating more last-minute travel plans during this time.
- Seasonally, Spring (107 days avg.) sees the longest lead times, while Winter (49 days avg.) has the shortest, reflecting typical travel planning cycles.
Recommendations for Hosts
- Use the overall average lead time (89 days) as a baseline for your pricing and availability strategy in Acharavi.
- For February stays, consider implementing length-of-stay discounts or slightly higher rates for bookings made less than 143 days out to capitalize on advance planning.
- During January, focus on last-minute booking availability and promotions, as guests book with very short notice (2 days avg.).
- Target marketing efforts for the Spring season well in advance (at least 107 days) to capture early planners.
- Monitor your own booking lead times against these Acharavi averages to identify opportunities for dynamic pricing adjustments.
Popular & Essential Airbnb Amenities in Acharavi (2026)
Amenity Prevalence
Amenity Insights for Acharavi
- Essential amenities in Acharavi that guests expect include: Wifi, Air conditioning, Kitchen. Lacking these (any) could significantly impact bookings.
- Popular amenities like Hair dryer, Essentials, TV are common but not universal. Offering these can provide a competitive edge.
Recommendations for Hosts
- Ensure your listing includes all essential amenities for Acharavi: Wifi, Air conditioning, Kitchen.
- Prioritize adding missing essentials: Air conditioning, Kitchen.
- Consider adding popular differentiators like Hair dryer or Essentials to increase appeal.
- Highlight unique or less common amenities you offer (e.g., hot tub, dedicated workspace, EV charger) in your listing description and photos.
- Regularly check competitor amenities in Acharavi to stay competitive.
Acharavi Airbnb Guest Demographics & Profile Analysis (2026)
Guest Profile Summary for Acharavi
- The typical guest profile for Airbnb in Acharavi consists of predominantly international visitors (99%), with top international origins including United Kingdom, typically belonging to the Post-2000s (Gen Z/Alpha) group (50%), primarily speaking English or German.
- Domestic travelers account for 1.0% of guests.
- Key international markets include Germany (26.9%) and United Kingdom (22%).
- Top languages spoken are English (42.3%) followed by German (17%).
- A significant demographic segment is the Post-2000s (Gen Z/Alpha) group, representing 50% of guests.
Recommendations for Hosts
- Focus marketing internationally, particularly towards travelers from United Kingdom.
- Tailor amenities and listing descriptions to appeal to the dominant Post-2000s (Gen Z/Alpha) demographic (e.g., highlight fast WiFi, smart home features, local guides).
- Highlight unique local experiences or amenities relevant to the primary guest profile.
- Consider seasonal promotions aligned with peak travel times for key origin markets.
Nearby Short-Term Rental Market Comparison
How does the Acharavi Airbnb market stack up against its neighbors? Compare key performance metrics like average monthly revenue, ADR, and occupancy rates in surrounding areas to understand the broader regional STR landscape.
| Market | Active Properties | Monthly Revenue | Daily Rate | Avg. Occupancy |
|---|---|---|---|---|
| Kassopaia Municipal Unit | 527 | $2,795 | $277.75 | 52% |
| Erisos Municipal Unit | 268 | $2,408 | $288.68 | 47% |
| Sanarica | 14 | $2,311 | $227.51 | 35% |
| Argostoli Municipality | 36 | $2,309 | $396.50 | 43% |
| Spartilas | 32 | $2,300 | $263.25 | 50% |
| Pesada | 52 | $2,277 | $297.23 | 47% |
| Minia | 63 | $2,222 | $248.36 | 49% |
| Kontokali | 69 | $2,200 | $275.25 | 47% |
| Afra | 20 | $2,183 | $294.22 | 40% |
| Mousata | 78 | $2,180 | $250.46 | 48% |