Vathy Airbnb Market Analysis 2026: Short Term Rental Data & Vacation Rental Statistics in Attica, Greece
Is Airbnb profitable in Vathy in 2026? Explore comprehensive Airbnb analytics for Vathy, Attica, Greece to uncover income potential. This 2026 STR market report for Vathy, based on AirROI data from February 2025 to January 2026, reveals key trends in the niche market of 61 active listings.
Whether you're considering an Airbnb investment in Vathy, optimizing your existing vacation rental, or exploring rental arbitrage opportunities, understanding the Vathy Airbnb data is crucial. Navigating the high regulation landscape is key to maximizing your short term rental income potential. Let's dive into the specifics.
Key Vathy Airbnb Performance Metrics Overview
Monthly Airbnb Revenue Variations & Income Potential in Vathy (2026)
Understanding the monthly revenue variations for Airbnb listings in Vathy is key to maximizing your short term rental income potential. Seasonality significantly impacts earnings. Our analysis, based on data from the past 12 months, shows that the peak revenue month for STRs in Vathy is typically August, while February often presents the lowest earnings, highlighting opportunities for strategic pricing adjustments during shoulder and low seasons. Explore the typical Airbnb income in Vathy across different performance tiers:
- Best-in-class properties (Top 10%) achieve $3,187+ monthly, often utilizing dynamic pricing and superior guest experiences.
- Strong performing properties (Top 25%) earn $1,929 or more, indicating effective management and desirable locations/amenities.
- Typical properties (Median) generate around $1,030 per month, representing the average market performance.
- Entry-level properties (Bottom 25%) see earnings around $577, often with potential for optimization.
Average Monthly Airbnb Earnings Trend in Vathy
Vathy Airbnb Occupancy Rate Trends (2026)
Maximize your bookings by understanding the Vathy STR occupancy trends. Seasonal demand shifts significantly influence how often properties are booked. Typically, Augustsees the highest demand (peak season occupancy), while January experiences the lowest (low season). Effective strategies, like adjusting minimum stays or offering promotions, can boost occupancy during slower periods. Here's how different property tiers perform in Vathy:
- Best-in-class properties (Top 10%) achieve 58%+ occupancy, indicating high desirability and potentially optimized availability.
- Strong performing properties (Top 25%) maintain 42% or higher occupancy, suggesting good market fit and guest satisfaction.
- Typical properties (Median) have an occupancy rate around 28%.
- Entry-level properties (Bottom 25%) average 15% occupancy, potentially facing higher vacancy.
Average Monthly Occupancy Rate Trend in Vathy
Average Daily Rate (ADR) Airbnb Trends in Vathy (2026)
Effective short term rental pricing strategy in Vathy involves understanding monthly ADR fluctuations. The Average Daily Rate (ADR) for Airbnb in Vathy typically peaks in August and dips lowest during December. Leveraging Airbnb dynamic pricing tools or strategies based on this seasonality can significantly boost revenue. Here's a look at the typical nightly rates achieved:
- Best-in-class properties (Top 10%) command rates of $310+ per night, often due to premium features or locations.
- Strong performing properties (Top 25%) achieve nightly rates of $192 or more.
- Typical properties (Median) charge around $112 per night.
- Entry-level properties (Bottom 25%) earn around $82 per night.
Average Daily Rate (ADR) Trend by Month in Vathy
Get Live Vathy Market Intelligence 👇

Explore Real-time Analytics
Airbnb Seasonality Analysis & Trends in Vathy (2026)
Peak Season (August, July, September)
- Revenue averages $3,007 per month
- Occupancy rates average 54.6%
- Daily rates average $181
Shoulder Season
- Revenue averages $1,314 per month
- Occupancy maintains around 26.1%
- Daily rates hold near $166
Low Season (January, February, December)
- Revenue drops to average $762 per month
- Occupancy decreases to average 16.1%
- Daily rates adjust to average $160
Seasonality Insights for Vathy
- The Airbnb seasonality in Vathy shows highly seasonal trends requiring careful strategy. While the sections above show seasonal averages, it's also insightful to look at the extremes:
- During the high season, the absolute peak month showcases Vathy's highest earning potential, with monthly revenues capable of climbing to $4,047, occupancy reaching a high of 69.4%, and ADRs peaking at $184.
- Conversely, the slowest single month of the year, typically falling within the low season, marks the market's lowest point. In this month, revenue might dip to $760, occupancy could drop to 9.7%, and ADRs may adjust down to $158.
- Understanding both the seasonal averages and these monthly peaks and troughs in revenue, occupancy, and ADR is crucial for maximizing your Airbnb profit potential in Vathy.
Seasonal Strategies for Maximizing Profit
- Peak Season: Maximize revenue through premium pricing and potentially longer minimum stays. Ensure high availability.
- Low Season: Offer competitive pricing, special promotions (e.g., extended stay discounts), and flexible cancellation policies. Target off-season travelers like remote workers or budget-conscious guests.
- Shoulder Seasons: Implement dynamic pricing that balances peak and low rates. Target weekend travelers or specific events. Offer slightly more flexible terms than peak season.
- Regularly analyze your own performance against these Vathy seasonality benchmarks and adjust your pricing and availability strategy accordingly.
Best Areas for Airbnb Investment in Vathy (2026)
Exploring the top neighborhoods for short-term rentals in Vathy? This section highlights key areas, outlining why they are attractive for hosts and guests, along with notable local attractions. Consider these locations based on your target guest profile and investment strategy.
| Neighborhood / Area | Why Host Here? (Target Guests & Appeal) | Key Attractions & Landmarks |
|---|---|---|
| Vathy Beach | Vathy Beach is a picturesque coastal area perfect for sunbathers and water sports enthusiasts. Known for its tranquil waters and beautiful sandy beaches, it's ideal for vacationers looking to unwind by the sea. | Vathy Beach, Water Sports Rentals, Beachfront Restaurants, Sunset Views, Local Markets |
| Agios Dimitrios | A charming neighborhood that combines traditional Greek architecture with modern amenities. It's popular among families and couples who seek a peaceful retreat near local culture and history. | Local Taverns, Historic Monuments, Cultural Festivals, Walking Trails, Traditional Markets |
| Vathy Port | The bustling port area is a hub for tourists arriving by ferry. It features local shops, cafés, and restaurants, making it a prime location for visitors who want to explore the region. | Vathy Harbor, Shopping District, Seafood Restaurants, Ferry Terminal, Boat Tours |
| Kalamaki | Kalamaki is a vibrant area known for its lively atmosphere, featuring various entertainment options. It's popular with younger crowds and those looking for nightlife and activities. | Beach Bars, Nightclubs, Water Sports, Local Events, Markets |
| Kea Island | Though a bit further out, Kea Island offers stunning natural beauty and fewer crowds. It's great for those looking for a quiet getaway with opportunities for hiking and exploration. | Hiking Trails, Scenic Views, Beaches, Local Vineyards, Traditional Villages |
| Thermi | Thermi features hot springs and wellness resorts, attracting tourists interested in relaxation and health-focused vacations. It's ideal for wellness retreats and nature lovers. | Hot Springs, Spa Resorts, Nature Walks, Botanical Gardens, Cooking Classes |
| Cape Sounion | Popular for the historic Temple of Poseidon, this area attracts guests interested in history and stunning views. It's perfect for those who appreciate culture and ancient landmarks. | Temple of Poseidon, Sounion National Park, Coastal Views, Hiking Trails, Local Seafood Restaurants |
| Kea's Chora | The capital of Kea Island, it features traditional Cycladic architecture and a quaint atmosphere. It's ideal for travelers looking for a more local experience away from the bustling tourist spots. | Charming Streets, Local Artisans, Traditional Cafés, Cycladic Architecture, Scenic Views |
Understanding Airbnb License Requirements & STR Laws in Vathy (2026)
Yes, Vathy, Attica, Greece enforces high STR regulations. Obtaining a license and ensuring compliance is almost certainly required according to current 2026 STR laws. Always verify the latest short term rental regulations and Airbnb license requirements directly with local government authorities for Vathy to ensure full compliance before hosting.
(Source: AirROI data, 2026, based on 82% licensed listings)
Top Performing Airbnb Properties in Vathy (2026)
Benchmark your potential! Explore examples of top-performing Airbnb properties in Vathybased on Trailing Twelve Month (TTM) revenue. Analyze their characteristics, revenue, occupancy rate, and ADR to understand what drives success in this market.

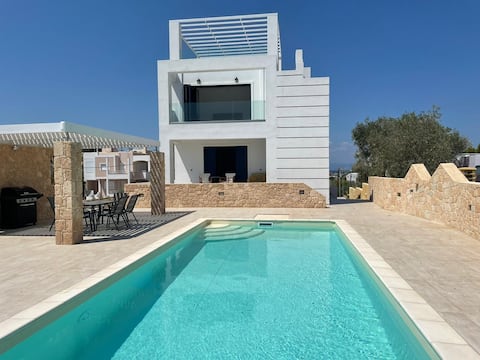
Terra Casa Private Villa
Entire Place • 8 bedrooms
Souvala /Aegina. Excellent location Luxury villa.
Entire Place • 4 bedrooms

Villa Isabella with private pool in Aegina Souvala
Entire Place • 3 bedrooms
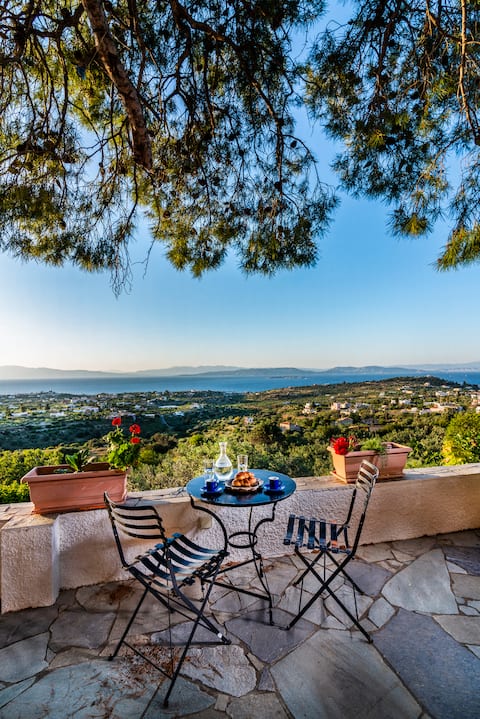
View House Aegina Island
Entire Place • 6 bedrooms
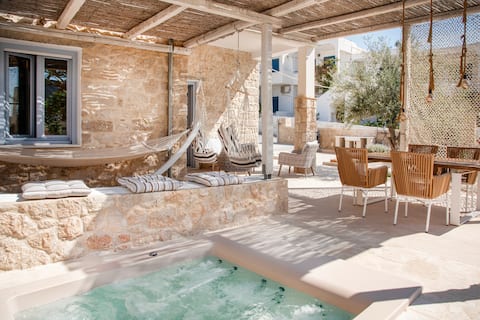
"TERRA E SOLE" spa suite Aegina
Entire Place • 2 bedrooms
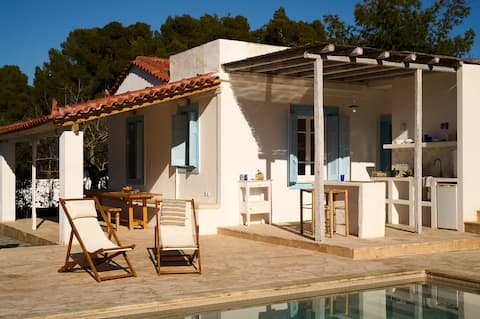
Pistachio House with pool
Entire Place • 2 bedrooms
Note: Performance varies based on location, size, amenities, seasonality, and management quality. Data reflects the past 12 months.
Top Performing Airbnb Hosts in Vathy (2026)
Learn from the best! This table showcases top-performing Airbnb hosts in Vathy based on the number of properties managed and estimated total revenue over the past year. Analyze their scale and performance metrics.
| Host Name | Properties | Grossing Revenue | Stay Reviews | Avg Rating |
|---|---|---|---|---|
| Marina | 1 | $98,984 | 20 | 4.95/5.0 |
| Lmproperties | 3 | $70,720 | 86 | 4.80/5.0 |
| Penny | 4 | $50,104 | 133 | 4.95/5.0 |
| Ariadni | 7 | $45,148 | 208 | 4.73/5.0 |
| Vasiliki | 1 | $43,809 | 5 | 5.00/5.0 |
| Menelaos | 1 | $42,503 | 14 | 4.86/5.0 |
| Nikolaos | 1 | $39,513 | 44 | 4.95/5.0 |
| Isabelle | 1 | $30,397 | 5 | 5.00/5.0 |
| Μαρικαίτη | 1 | $29,529 | 106 | 4.99/5.0 |
| Katerina | 1 | $27,559 | 15 | 4.93/5.0 |
Analyzing the strategies of top hosts, such as their property selection, pricing, and guest communication, can offer valuable lessons for optimizing your own Airbnb operations in Vathy.
Dive Deeper: Advanced Vathy STR Market Data (2026)
Ready to unlock more insights? AirROI provides access to advanced metrics and comprehensive Airbnb data for Vathy. Explore detailed analytics beyond this report to refine your investment strategy, optimize pricing, and maximize your vacation rental profits.
Explore Advanced MetricsVathy Short-Term Rental Market Composition (2026): Property & Room Types
Room Type Distribution
Property Type Distribution
Market Composition Insights for Vathy
- The Vathy Airbnb market composition is heavily skewed towards Entire Home/Apt listings, which make up 98.4% of the 61 active rentals. This indicates strong guest preference for privacy and space.
- Looking at the property type distribution in Vathy, House properties are the most common (55.7%), reflecting the local real estate landscape.
- Houses represent a significant 55.7% portion, catering likely to families or larger groups.
- Smaller segments like hotel/boutique, others (combined 6.5%) offer potential for unique stay experiences.
Vathy Airbnb Room Capacity Analysis (2026): Bedroom Distribution
Distribution of Listings by Number of Bedrooms
Room Capacity Insights for Vathy
- The dominant room capacity in Vathy is 1 bedroom listings, making up 45.9% of the market. This suggests a strong demand for properties suitable for couples or solo travelers.
- Together, 1 bedroom and 2 bedrooms properties represent 78.7% of the active Airbnb listings in Vathy, indicating a high concentration in these sizes.
Vathy Vacation Rental Guest Capacity Trends (2026)
Distribution of Listings by Guest Capacity
Guest Capacity Insights for Vathy
- The most common guest capacity trend in Vathy vacation rentals is listings accommodating 4 guests (36.1%). This suggests the primary traveler segment is likely small families or groups.
- Properties designed for 4 guests and 2 guests dominate the Vathy STR market, accounting for 54.1% of listings.
- 26.2% of properties accommodate 6+ guests, serving the market segment for larger families or group travel in Vathy.
- On average, properties in Vathy are equipped to host 4.4 guests.
Vathy Airbnb Booking Patterns (2026): Available vs. Booked Days
Available Days Distribution
Booked Days Distribution
Booking Pattern Insights for Vathy
- The most common availability pattern in Vathy falls within the 271-366 days range, representing 62.3% of listings. This suggests many properties have significant open periods on their calendars.
- Approximately 100.0% of listings show high availability (181+ days open annually), indicating potential for increased bookings or specific owner usage patterns.
- For booked days, the 31-90 days range is most frequent in Vathy (44.3%), reflecting common guest stay durations or potential owner blocking patterns.
Vathy Airbnb Minimum Stay Requirements Analysis
Distribution of Listings by Minimum Night Requirement
1 Night
2 listings
3.3% of total
2 Nights
22 listings
36.1% of total
3 Nights
7 listings
11.5% of total
4-6 Nights
2 listings
3.3% of total
7-29 Nights
1 listings
1.6% of total
30+ Nights
27 listings
44.3% of total
Key Insights
- The most prevalent minimum stay requirement in Vathy is 30+ Nights, adopted by 44.3% of listings. This highlights the market's preference for longer commitments.
- A significant segment (44.3%) caters to monthly stays (30+ nights) in Vathy, pointing to opportunities in the extended-stay market.
Recommendations
- Align with the market by considering a 30+ Nights minimum stay, as 44.3% of Vathy hosts use this setting.
- If feasible, allowing 1-night stays, especially midweek or during low season, could capture last-minute bookings, as only 3.3% currently do.
- A 2-night minimum appears standard (36.1%). Consider this for weekends or peak periods.
- Explore offering discounts for stays of 30+ nights to attract the 44.3% of the market seeking extended stays.
- Adjust minimum nights based on seasonality – potentially shorter during low season and longer during peak demand periods in Vathy.
Vathy Airbnb Cancellation Policy Trends Analysis (2026)
Super Strict 60 Days
1 listings
1.6% of total
Flexible
8 listings
13.1% of total
Moderate
11 listings
18% of total
Firm
32 listings
52.5% of total
Strict
9 listings
14.8% of total
Cancellation Policy Insights for Vathy
- The prevailing Airbnb cancellation policy trend in Vathy is Firm, used by 52.5% of listings.
- A majority (67.3%) of hosts in Vathy utilize Firm or Strict policies, indicating a market where hosts prioritize booking security.
Recommendations for Hosts
- Consider adopting a Firm policy to align with the 52.5% market standard in Vathy.
- Using a Strict policy might deter some guests, as only 14.8% of listings use it. Evaluate if potential revenue protection outweighs possible lower booking rates.
- Regularly review your cancellation policy against competitors and market demand shifts in Vathy.
Vathy STR Booking Lead Time Analysis (2026)
Average Booking Lead Time by Month
Booking Lead Time Insights for Vathy
- The overall average booking lead time for vacation rentals in Vathy is 43 days.
- Guests book furthest in advance for stays during August (average 66 days), likely coinciding with peak travel demand or local events.
- The shortest booking windows occur for stays in December (average 8 days), indicating more last-minute travel plans during this time.
- Seasonally, Summer (49 days avg.) sees the longest lead times, while Winter (32 days avg.) has the shortest, reflecting typical travel planning cycles.
Recommendations for Hosts
- Use the overall average lead time (43 days) as a baseline for your pricing and availability strategy in Vathy.
- For August stays, consider implementing length-of-stay discounts or slightly higher rates for bookings made less than 66 days out to capitalize on advance planning.
- During December, focus on last-minute booking availability and promotions, as guests book with very short notice (8 days avg.).
- Target marketing efforts for the Summer season well in advance (at least 49 days) to capture early planners.
- Monitor your own booking lead times against these Vathy averages to identify opportunities for dynamic pricing adjustments.
Popular & Essential Airbnb Amenities in Vathy (2026)
Amenity Prevalence
Amenity Insights for Vathy
- Essential amenities in Vathy that guests expect include: Air conditioning, Wifi. Lacking these (any) could significantly impact bookings.
- Popular amenities like Hair dryer, Dishes and silverware, Hangers are common but not universal. Offering these can provide a competitive edge.
Recommendations for Hosts
- Ensure your listing includes all essential amenities for Vathy: Air conditioning, Wifi.
- Prioritize adding missing essentials: Air conditioning, Wifi.
- Consider adding popular differentiators like Hair dryer or Dishes and silverware to increase appeal.
- Highlight unique or less common amenities you offer (e.g., hot tub, dedicated workspace, EV charger) in your listing description and photos.
- Regularly check competitor amenities in Vathy to stay competitive.
Vathy Airbnb Guest Demographics & Profile Analysis (2026)
Guest Profile Summary for Vathy
- The typical guest profile for Airbnb in Vathy consists of predominantly international visitors (79%), with top international origins including United Kingdom, typically belonging to the Post-2000s (Gen Z/Alpha) group (50%), primarily speaking English or Greek.
- Domestic travelers account for 21.3% of guests.
- Key international markets include Greece (21.3%) and United Kingdom (18%).
- Top languages spoken are English (42.1%) followed by Greek (12.8%).
- A significant demographic segment is the Post-2000s (Gen Z/Alpha) group, representing 50% of guests.
Recommendations for Hosts
- Focus marketing internationally, particularly towards travelers from United Kingdom.
- Tailor amenities and listing descriptions to appeal to the dominant Post-2000s (Gen Z/Alpha) demographic (e.g., highlight fast WiFi, smart home features, local guides).
- Highlight unique local experiences or amenities relevant to the primary guest profile.
- Consider seasonal promotions aligned with peak travel times for key origin markets.
Nearby Short-Term Rental Market Comparison
How does the Vathy Airbnb market stack up against its neighbors? Compare key performance metrics like average monthly revenue, ADR, and occupancy rates in surrounding areas to understand the broader regional STR landscape.
| Market | Active Properties | Monthly Revenue | Daily Rate | Avg. Occupancy |
|---|---|---|---|---|
| Plaka | 181 | $3,420 | $285.40 | 59% |
| Pollonia | 128 | $3,247 | $316.99 | 55% |
| Πλατύς Γιαλός | 10 | $2,927 | $373.22 | 41% |
| Hydra | 330 | $2,844 | $282.51 | 50% |
| Pera Triovassalos | 61 | $2,606 | $239.07 | 57% |
| Panormos | 181 | $2,580 | $257.56 | 46% |
| Tripiti | 82 | $2,484 | $252.19 | 54% |
| Municipality of Milos | 113 | $2,422 | $221.00 | 55% |
| Plaka | 26 | $2,263 | $362.94 | 48% |
| Vouliagmeni Municipal Unit | 183 | $2,263 | $238.50 | 44% |