Municipality of Nea Ionia Airbnb Market Analysis 2026: Short Term Rental Data & Vacation Rental Statistics in Attica, Greece
Is Airbnb profitable in Municipality of Nea Ionia in 2026? Explore comprehensive Airbnb analytics for Municipality of Nea Ionia, Attica, Greece to uncover income potential. This 2026 STR market report for Municipality of Nea Ionia, based on AirROI data from February 2025 to January 2026, reveals key trends in the niche market of 44 active listings.
Whether you're considering an Airbnb investment in Municipality of Nea Ionia, optimizing your existing vacation rental, or exploring rental arbitrage opportunities, understanding the Municipality of Nea Ionia Airbnb data is crucial. Navigating the high regulation landscape is key to maximizing your short term rental income potential. Let's dive into the specifics.
Key Municipality of Nea Ionia Airbnb Performance Metrics Overview
Monthly Airbnb Revenue Variations & Income Potential in Municipality of Nea Ionia (2026)
Understanding the monthly revenue variations for Airbnb listings in Municipality of Nea Ionia is key to maximizing your short term rental income potential. Seasonality significantly impacts earnings. Our analysis, based on data from the past 12 months, shows that the peak revenue month for STRs in Municipality of Nea Ionia is typically July, while February often presents the lowest earnings, highlighting opportunities for strategic pricing adjustments during shoulder and low seasons. Explore the typical Airbnb income in Municipality of Nea Ionia across different performance tiers:
- Best-in-class properties (Top 10%) achieve $2,373+ monthly, often utilizing dynamic pricing and superior guest experiences.
- Strong performing properties (Top 25%) earn $1,498 or more, indicating effective management and desirable locations/amenities.
- Typical properties (Median) generate around $967 per month, representing the average market performance.
- Entry-level properties (Bottom 25%) see earnings around $570, often with potential for optimization.
Average Monthly Airbnb Earnings Trend in Municipality of Nea Ionia
Municipality of Nea Ionia Airbnb Occupancy Rate Trends (2026)
Maximize your bookings by understanding the Municipality of Nea Ionia STR occupancy trends. Seasonal demand shifts significantly influence how often properties are booked. Typically, Februarysees the highest demand (peak season occupancy), while August experiences the lowest (low season). Effective strategies, like adjusting minimum stays or offering promotions, can boost occupancy during slower periods. Here's how different property tiers perform in Municipality of Nea Ionia:
- Best-in-class properties (Top 10%) achieve 83%+ occupancy, indicating high desirability and potentially optimized availability.
- Strong performing properties (Top 25%) maintain 68% or higher occupancy, suggesting good market fit and guest satisfaction.
- Typical properties (Median) have an occupancy rate around 45%.
- Entry-level properties (Bottom 25%) average 25% occupancy, potentially facing higher vacancy.
Average Monthly Occupancy Rate Trend in Municipality of Nea Ionia
Average Daily Rate (ADR) Airbnb Trends in Municipality of Nea Ionia (2026)
Effective short term rental pricing strategy in Municipality of Nea Ionia involves understanding monthly ADR fluctuations. The Average Daily Rate (ADR) for Airbnb in Municipality of Nea Ionia typically peaks in December and dips lowest during March. Leveraging Airbnb dynamic pricing tools or strategies based on this seasonality can significantly boost revenue. Here's a look at the typical nightly rates achieved:
- Best-in-class properties (Top 10%) command rates of $145+ per night, often due to premium features or locations.
- Strong performing properties (Top 25%) achieve nightly rates of $82 or more.
- Typical properties (Median) charge around $62 per night.
- Entry-level properties (Bottom 25%) earn around $52 per night.
Average Daily Rate (ADR) Trend by Month in Municipality of Nea Ionia
Get Live Municipality of Nea Ionia Market Intelligence 👇
Explore Real-time Analytics
Airbnb Seasonality Analysis & Trends in Municipality of Nea Ionia (2026)
Peak Season (July, June, November)
- Revenue averages $1,321 per month
- Occupancy rates average 48.5%
- Daily rates average $80
Shoulder Season
- Revenue averages $1,138 per month
- Occupancy maintains around 46.3%
- Daily rates hold near $77
Low Season (January, February, April)
- Revenue drops to average $1,018 per month
- Occupancy decreases to average 48.7%
- Daily rates adjust to average $74
Seasonality Insights for Municipality of Nea Ionia
- The Airbnb seasonality in Municipality of Nea Ionia shows moderate seasonality with distinct peak and low periods. While the sections above show seasonal averages, it's also insightful to look at the extremes:
- During the high season, the absolute peak month showcases Municipality of Nea Ionia's highest earning potential, with monthly revenues capable of climbing to $1,365, occupancy reaching a high of 53.8%, and ADRs peaking at $82.
- Conversely, the slowest single month of the year, typically falling within the low season, marks the market's lowest point. In this month, revenue might dip to $998, occupancy could drop to 38.4%, and ADRs may adjust down to $70.
- Understanding both the seasonal averages and these monthly peaks and troughs in revenue, occupancy, and ADR is crucial for maximizing your Airbnb profit potential in Municipality of Nea Ionia.
Seasonal Strategies for Maximizing Profit
- Peak Season: Maximize revenue through premium pricing and potentially longer minimum stays. Ensure high availability.
- Low Season: Offer competitive pricing, special promotions (e.g., extended stay discounts), and flexible cancellation policies. Target off-season travelers like remote workers or budget-conscious guests.
- Shoulder Seasons: Implement dynamic pricing that balances peak and low rates. Target weekend travelers or specific events. Offer slightly more flexible terms than peak season.
- Regularly analyze your own performance against these Municipality of Nea Ionia seasonality benchmarks and adjust your pricing and availability strategy accordingly.
Best Areas for Airbnb Investment in Municipality of Nea Ionia (2026)
Exploring the top neighborhoods for short-term rentals in Municipality of Nea Ionia? This section highlights key areas, outlining why they are attractive for hosts and guests, along with notable local attractions. Consider these locations based on your target guest profile and investment strategy.
| Neighborhood / Area | Why Host Here? (Target Guests & Appeal) | Key Attractions & Landmarks |
|---|---|---|
| Agios Georgios | A vibrant neighborhood known for its local markets and traditional Greek culture. Ideal for visitors wanting an authentic experience with friendly local cafes and easy access to public transport. | Agios Georgios church, Local markets, Traditional tavernas, Public transport access, Nearby parks |
| Nea Ionia Square | The heart of Nea Ionia, bustling with shops, cafes, and nightlife. A great spot for young people and tourists, with frequent events and activities throughout the year. | Nea Ionia Square, Shopping centers, Cafes and restaurants, Cultural events, Public festivals |
| Park of Nea Ionia | A green space in the city, perfect for families and relaxation. Attracts visitors looking for nature amidst the urban environment, making it ideal for longer stays. | Playgrounds, Walking paths, Greenery, Sport facilities, Outdoor events |
| Kifisos River Waterfront | A scenic area ideal for walks and recreational activities. Ideal for those who enjoy outdoor activities and are looking for a tranquil space close to the city. | Walking paths along the river, Bicycle tours, Picnic areas, Fishing spots, Nature walks |
| Local Art Galleries | This area is blossoming with artistic expression and small galleries. Great for art enthusiasts and visitors interested in local culture and creativity. | Art exhibits, Local artist studios, Cultural workshops, Art fairs, Community events |
| Nea Ionia Cinemas | Close to various cinemas offering a mix of films, including international flicks. Perfect for movie lovers or those wanting entertainment options close by. | Modern cinemas, Film festivals, Snack bars, Café-terraces, Cultural evenings |
| Sports Facilities | A hub for sports enthusiasts featuring stadiums and sports centers. Appeals to visitors participating in or watching sports events. | Local stadiums, Fitness centers, Public sporting events, Sports teams, Recreational facilities |
| Cafes and Bakeries | Known for its delightful cafes and bakeries, this area draws foodies and those seeking local delights, making it a perfect stop for culinary tourism. | Famous local bakeries, Gourmet cafes, Food festivals, Culinary workshops, Street food |
Understanding Airbnb License Requirements & STR Laws in Municipality of Nea Ionia (2026)
Yes, Municipality of Nea Ionia, Attica, Greece enforces high STR regulations. Obtaining a license and ensuring compliance is almost certainly required according to current 2026 STR laws. Always verify the latest short term rental regulations and Airbnb license requirements directly with local government authorities for Municipality of Nea Ionia to ensure full compliance before hosting.
(Source: AirROI data, 2026, based on 91% licensed listings)
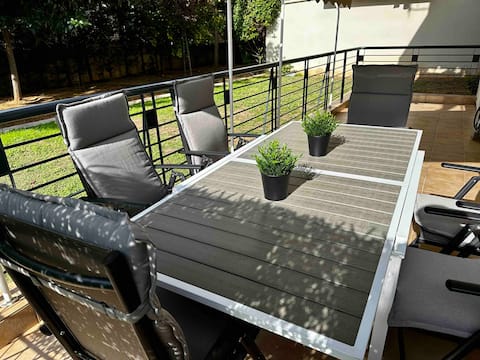
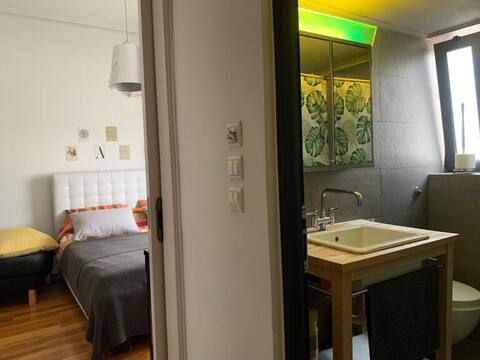
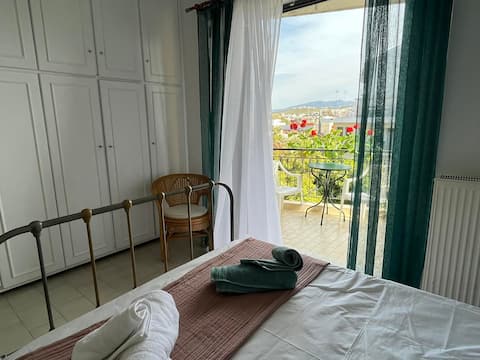
Top Performing Airbnb Properties in Municipality of Nea Ionia (2026)
Benchmark your potential! Explore examples of top-performing Airbnb properties in Municipality of Nea Ioniabased on Trailing Twelve Month (TTM) revenue. Analyze their characteristics, revenue, occupancy rate, and ADR to understand what drives success in this market.

Luxury Living Apartment
Entire Place • 3 bedrooms
Cozy Apartment with Garden Retreat
Entire Place • 1 bedroom

"Deedees house"
Entire Place • 2 bedrooms
Apartment 3&4
Entire Place • 4 bedrooms

Roys' Maisonette next to metro
Entire Place • 2 bedrooms
Detached house - maisonette 112 sq.m.
Entire Place • 3 bedrooms
Note: Performance varies based on location, size, amenities, seasonality, and management quality. Data reflects the past 12 months.
Top Performing Airbnb Hosts in Municipality of Nea Ionia (2026)
Learn from the best! This table showcases top-performing Airbnb hosts in Municipality of Nea Ionia based on the number of properties managed and estimated total revenue over the past year. Analyze their scale and performance metrics.
| Host Name | Properties | Grossing Revenue | Stay Reviews | Avg Rating |
|---|---|---|---|---|
| Athens Houses | 3 | $43,484 | 45 | 4.83/5.0 |
| Lee | 2 | $32,774 | 7 | 4.04/5.0 |
| Konstantina | 1 | $32,638 | 57 | 4.91/5.0 |
| Antonis | 1 | $29,687 | 32 | 5.00/5.0 |
| Anna | 1 | $20,006 | 86 | 4.93/5.0 |
| Kalliroi | 1 | $18,035 | 18 | 5.00/5.0 |
| Αναστασια | 1 | $17,413 | 26 | 4.81/5.0 |
| Γεωργια | 1 | $16,028 | 52 | 4.96/5.0 |
| Ksenya | 1 | $14,678 | 177 | 4.97/5.0 |
| Viktor | 1 | $13,919 | 365 | 4.76/5.0 |
Analyzing the strategies of top hosts, such as their property selection, pricing, and guest communication, can offer valuable lessons for optimizing your own Airbnb operations in Municipality of Nea Ionia.
Dive Deeper: Advanced Municipality of Nea Ionia STR Market Data (2026)
Ready to unlock more insights? AirROI provides access to advanced metrics and comprehensive Airbnb data for Municipality of Nea Ionia. Explore detailed analytics beyond this report to refine your investment strategy, optimize pricing, and maximize your vacation rental profits.
Explore Advanced MetricsMunicipality of Nea Ionia Short-Term Rental Market Composition (2026): Property & Room Types
Room Type Distribution
Property Type Distribution
Market Composition Insights for Municipality of Nea Ionia
- The Municipality of Nea Ionia Airbnb market composition is heavily skewed towards Entire Home/Apt listings, which make up 100% of the 44 active rentals. This indicates strong guest preference for privacy and space.
- Looking at the property type distribution in Municipality of Nea Ionia, Apartment/Condo properties are the most common (75%), reflecting the local real estate landscape.
- Houses represent a significant 22.7% portion, catering likely to families or larger groups.
- Smaller segments like others (combined 2.3%) offer potential for unique stay experiences.
Municipality of Nea Ionia Airbnb Room Capacity Analysis (2026): Bedroom Distribution
Distribution of Listings by Number of Bedrooms
Room Capacity Insights for Municipality of Nea Ionia
- The dominant room capacity in Municipality of Nea Ionia is 1 bedroom listings, making up 61.4% of the market. This suggests a strong demand for properties suitable for couples or solo travelers.
- Together, 1 bedroom and 2 bedrooms properties represent 90.9% of the active Airbnb listings in Municipality of Nea Ionia, indicating a high concentration in these sizes.
- With over half the market (61.4%) consisting of studios or 1-bedroom units, Municipality of Nea Ionia is particularly well-suited for individuals or couples.
- Listings with 3+ bedrooms (9.1%) represent a smaller niche, potentially indicating an underserved market for larger group accommodations in Municipality of Nea Ionia.
Municipality of Nea Ionia Vacation Rental Guest Capacity Trends (2026)
Distribution of Listings by Guest Capacity
Guest Capacity Insights for Municipality of Nea Ionia
- The most common guest capacity trend in Municipality of Nea Ionia vacation rentals is listings accommodating 4 guests (34.1%). This suggests the primary traveler segment is likely small families or groups.
- Properties designed for 4 guests and 2 guests dominate the Municipality of Nea Ionia STR market, accounting for 61.4% of listings.
- 11.3% of properties accommodate 6+ guests, serving the market segment for larger families or group travel in Municipality of Nea Ionia.
- On average, properties in Municipality of Nea Ionia are equipped to host 3.8 guests.
Municipality of Nea Ionia Airbnb Booking Patterns (2026): Available vs. Booked Days
Available Days Distribution
Booked Days Distribution
Booking Pattern Insights for Municipality of Nea Ionia
- The most common availability pattern in Municipality of Nea Ionia falls within the 181-270 days range, representing 40.9% of listings. This suggests many properties have significant open periods on their calendars.
- Approximately 75.0% of listings show high availability (181+ days open annually), indicating potential for increased bookings or specific owner usage patterns.
- For booked days, the 91-180 days range is most frequent in Municipality of Nea Ionia (40.9%), reflecting common guest stay durations or potential owner blocking patterns.
- A notable 25.0% of properties secure long booking periods (181+ days booked per year), highlighting successful long-term rental strategies or significant owner usage.
Municipality of Nea Ionia Airbnb Minimum Stay Requirements Analysis
Distribution of Listings by Minimum Night Requirement
1 Night
14 listings
31.8% of total
2 Nights
11 listings
25% of total
3 Nights
4 listings
9.1% of total
4-6 Nights
1 listings
2.3% of total
7-29 Nights
2 listings
4.5% of total
30+ Nights
12 listings
27.3% of total
Key Insights
- The most prevalent minimum stay requirement in Municipality of Nea Ionia is 1 Night, adopted by 31.8% of listings. This highlights the market's preference for shorter, flexible bookings.
- A significant segment (27.3%) caters to monthly stays (30+ nights) in Municipality of Nea Ionia, pointing to opportunities in the extended-stay market.
Recommendations
- Align with the market by considering a 1 Night minimum stay, as 31.8% of Municipality of Nea Ionia hosts use this setting.
- Explore offering discounts for stays of 30+ nights to attract the 27.3% of the market seeking extended stays.
- Adjust minimum nights based on seasonality – potentially shorter during low season and longer during peak demand periods in Municipality of Nea Ionia.
Municipality of Nea Ionia Airbnb Cancellation Policy Trends Analysis (2026)
Super Strict 30 Days
1 listings
2.3% of total
Flexible
8 listings
18.2% of total
Moderate
17 listings
38.6% of total
Firm
9 listings
20.5% of total
Strict
9 listings
20.5% of total
Cancellation Policy Insights for Municipality of Nea Ionia
- The prevailing Airbnb cancellation policy trend in Municipality of Nea Ionia is Moderate, used by 38.6% of listings.
- There's a relatively balanced mix between guest-friendly (56.8%) and stricter (41.0%) policies, offering choices for different guest needs.
Recommendations for Hosts
- Consider adopting a Moderate policy to align with the 38.6% market standard in Municipality of Nea Ionia.
- Regularly review your cancellation policy against competitors and market demand shifts in Municipality of Nea Ionia.
Municipality of Nea Ionia STR Booking Lead Time Analysis (2026)
Average Booking Lead Time by Month
Booking Lead Time Insights for Municipality of Nea Ionia
- The overall average booking lead time for vacation rentals in Municipality of Nea Ionia is 30 days.
- Guests book furthest in advance for stays during July (average 51 days), likely coinciding with peak travel demand or local events.
- The shortest booking windows occur for stays in February (average 17 days), indicating more last-minute travel plans during this time.
- Seasonally, Summer (43 days avg.) sees the longest lead times, while Fall (25 days avg.) has the shortest, reflecting typical travel planning cycles.
Recommendations for Hosts
- Use the overall average lead time (30 days) as a baseline for your pricing and availability strategy in Municipality of Nea Ionia.
- For July stays, consider implementing length-of-stay discounts or slightly higher rates for bookings made less than 51 days out to capitalize on advance planning.
- Target marketing efforts for the Summer season well in advance (at least 43 days) to capture early planners.
- Monitor your own booking lead times against these Municipality of Nea Ionia averages to identify opportunities for dynamic pricing adjustments.
Popular & Essential Airbnb Amenities in Municipality of Nea Ionia (2026)
Amenity Prevalence
Amenity Insights for Municipality of Nea Ionia
- Essential amenities in Municipality of Nea Ionia that guests expect include: Air conditioning, TV, Wifi, Hair dryer. Lacking these (any) could significantly impact bookings.
- Popular amenities like Kitchen, Iron, Bed linens are common but not universal. Offering these can provide a competitive edge.
Recommendations for Hosts
- Ensure your listing includes all essential amenities for Municipality of Nea Ionia: Air conditioning, TV, Wifi, Hair dryer.
- Prioritize adding missing essentials: Wifi, Hair dryer.
- Consider adding popular differentiators like Kitchen or Iron to increase appeal.
- Highlight unique or less common amenities you offer (e.g., hot tub, dedicated workspace, EV charger) in your listing description and photos.
- Regularly check competitor amenities in Municipality of Nea Ionia to stay competitive.
Municipality of Nea Ionia Airbnb Guest Demographics & Profile Analysis (2026)
Guest Profile Summary for Municipality of Nea Ionia
- The typical guest profile for Airbnb in Municipality of Nea Ionia consists of a mix of domestic (54%) and international guests, often arriving from nearby Athens, typically belonging to the Post-2000s (Gen Z/Alpha) group (50%), primarily speaking English or Greek.
- Domestic travelers account for 53.9% of guests.
- Key international markets include Greece (53.9%) and United Kingdom (13.2%).
- Top languages spoken are English (41.4%) followed by Greek (30.3%).
- A significant demographic segment is the Post-2000s (Gen Z/Alpha) group, representing 50% of guests.
Recommendations for Hosts
- Balance marketing efforts between domestic and international channels based on the guest mix.
- Tailor amenities and listing descriptions to appeal to the dominant Post-2000s (Gen Z/Alpha) demographic (e.g., highlight fast WiFi, smart home features, local guides).
- Highlight unique local experiences or amenities relevant to the primary guest profile.
- Consider seasonal promotions aligned with peak travel times for key origin markets.
Nearby Short-Term Rental Market Comparison
How does the Municipality of Nea Ionia Airbnb market stack up against its neighbors? Compare key performance metrics like average monthly revenue, ADR, and occupancy rates in surrounding areas to understand the broader regional STR landscape.
| Market | Active Properties | Monthly Revenue | Daily Rate | Avg. Occupancy |
|---|---|---|---|---|
| Hydra | 330 | $2,844 | $282.51 | 50% |
| Skiathos Municipality | 68 | $2,488 | $456.24 | 48% |
| Achladias | 92 | $2,443 | $360.50 | 47% |
| Sporades | 22 | $2,433 | $326.24 | 53% |
| Vouliagmeni Municipal Unit | 183 | $2,263 | $238.50 | 44% |
| Municipal Unit of Ayios Konstantinos | 11 | $2,235 | $303.34 | 34% |
| Municipality of Sifnos | 46 | $2,124 | $203.77 | 54% |
| Nerotrivia | 15 | $2,060 | $209.06 | 47% |
| Klima | 20 | $2,023 | $348.92 | 40% |
| Voula | 17 | $1,960 | $221.39 | 45% |