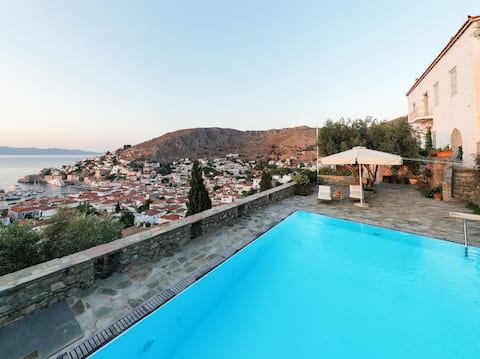
Hydra Airbnb Market Analysis 2026: Short Term Rental Data & Vacation Rental Statistics in Attica, Greece
Is Airbnb profitable in Hydra in 2026? Explore comprehensive Airbnb analytics for Hydra, Attica, Greece to uncover income potential. This 2026 STR market report for Hydra, based on AirROI data from February 2025 to January 2026, reveals key trends in the market of 330 active listings.
Whether you're considering an Airbnb investment in Hydra, optimizing your existing vacation rental, or exploring rental arbitrage opportunities, understanding the Hydra Airbnb data is crucial. Navigating the high regulation landscape is key to maximizing your short term rental income potential. Let's dive into the specifics.
Key Hydra Airbnb Performance Metrics Overview
Monthly Airbnb Revenue Variations & Income Potential in Hydra (2026)
Understanding the monthly revenue variations for Airbnb listings in Hydra is key to maximizing your short term rental income potential. Seasonality significantly impacts earnings. Our analysis, based on data from the past 12 months, shows that the peak revenue month for STRs in Hydra is typically August, while January often presents the lowest earnings, highlighting opportunities for strategic pricing adjustments during shoulder and low seasons. Explore the typical Airbnb income in Hydra across different performance tiers:
- Best-in-class properties (Top 10%) achieve $7,286+ monthly, often utilizing dynamic pricing and superior guest experiences.
- Strong performing properties (Top 25%) earn $4,540 or more, indicating effective management and desirable locations/amenities.
- Typical properties (Median) generate around $2,895 per month, representing the average market performance.
- Entry-level properties (Bottom 25%) see earnings around $1,752, often with potential for optimization.
Average Monthly Airbnb Earnings Trend in Hydra
Hydra Airbnb Occupancy Rate Trends (2026)
Maximize your bookings by understanding the Hydra STR occupancy trends. Seasonal demand shifts significantly influence how often properties are booked. Typically, Augustsees the highest demand (peak season occupancy), while January experiences the lowest (low season). Effective strategies, like adjusting minimum stays or offering promotions, can boost occupancy during slower periods. Here's how different property tiers perform in Hydra:
- Best-in-class properties (Top 10%) achieve 79%+ occupancy, indicating high desirability and potentially optimized availability.
- Strong performing properties (Top 25%) maintain 64% or higher occupancy, suggesting good market fit and guest satisfaction.
- Typical properties (Median) have an occupancy rate around 47%.
- Entry-level properties (Bottom 25%) average 26% occupancy, potentially facing higher vacancy.
Average Monthly Occupancy Rate Trend in Hydra
Average Daily Rate (ADR) Airbnb Trends in Hydra (2026)
Effective short term rental pricing strategy in Hydra involves understanding monthly ADR fluctuations. The Average Daily Rate (ADR) for Airbnb in Hydra typically peaks in August and dips lowest during March. Leveraging Airbnb dynamic pricing tools or strategies based on this seasonality can significantly boost revenue. Here's a look at the typical nightly rates achieved:
- Best-in-class properties (Top 10%) command rates of $534+ per night, often due to premium features or locations.
- Strong performing properties (Top 25%) achieve nightly rates of $327 or more.
- Typical properties (Median) charge around $212 per night.
- Entry-level properties (Bottom 25%) earn around $159 per night.
Average Daily Rate (ADR) Trend by Month in Hydra
Get Live Hydra Market Intelligence 👇

Explore Real-time Analytics
Airbnb Seasonality Analysis & Trends in Hydra (2026)
Peak Season (August, July, September)
- Revenue averages $6,470 per month
- Occupancy rates average 68.8%
- Daily rates average $315
Shoulder Season
- Revenue averages $3,406 per month
- Occupancy maintains around 44.2%
- Daily rates hold near $275
Low Season (January, February, December)
- Revenue drops to average $1,685 per month
- Occupancy decreases to average 26.3%
- Daily rates adjust to average $267
Seasonality Insights for Hydra
- The Airbnb seasonality in Hydra shows highly seasonal trends requiring careful strategy. While the sections above show seasonal averages, it's also insightful to look at the extremes:
- During the high season, the absolute peak month showcases Hydra's highest earning potential, with monthly revenues capable of climbing to $7,155, occupancy reaching a high of 73.5%, and ADRs peaking at $320.
- Conversely, the slowest single month of the year, typically falling within the low season, marks the market's lowest point. In this month, revenue might dip to $1,059, occupancy could drop to 16.6%, and ADRs may adjust down to $251.
- Understanding both the seasonal averages and these monthly peaks and troughs in revenue, occupancy, and ADR is crucial for maximizing your Airbnb profit potential in Hydra.
Seasonal Strategies for Maximizing Profit
- Peak Season: Maximize revenue through premium pricing and potentially longer minimum stays. Ensure high availability.
- Low Season: Offer competitive pricing, special promotions (e.g., extended stay discounts), and flexible cancellation policies. Target off-season travelers like remote workers or budget-conscious guests.
- Shoulder Seasons: Implement dynamic pricing that balances peak and low rates. Target weekend travelers or specific events. Offer slightly more flexible terms than peak season.
- Regularly analyze your own performance against these Hydra seasonality benchmarks and adjust your pricing and availability strategy accordingly.
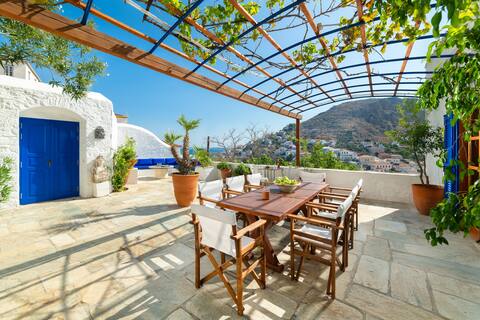
Best Areas for Airbnb Investment in Hydra (2026)
Exploring the top neighborhoods for short-term rentals in Hydra? This section highlights key areas, outlining why they are attractive for hosts and guests, along with notable local attractions. Consider these locations based on your target guest profile and investment strategy.
| Neighborhood / Area | Why Host Here? (Target Guests & Appeal) | Key Attractions & Landmarks |
|---|---|---|
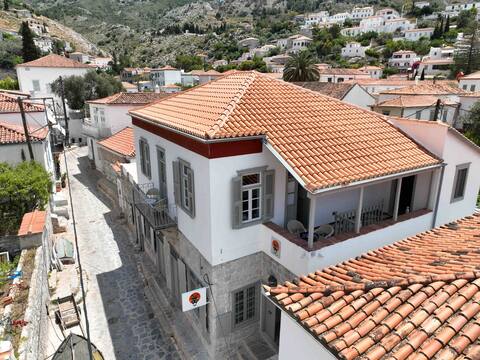
| Hydra Town | The main town of Hydra is a picturesque harbor with charming stone architecture, boutiques, and restaurants, attracting tourists for its beauty and tranquility. | Hydra Port, Historical Archives Museum of Hydra, Bouboulina Museum, Art galleries, Traditional tavernas, Hydra's hiking trails |
| Plaka | A quiet seaside village known for its stunning views and traditional character. It offers a peaceful retreat while still being close to Hydra's main attractions. | Plaka Beach, Cafes along the waterfront, Sunset views, Local art shops, Water sports activities |
| Kamini | A small village near Hydra Town, known for its scenic charm and relaxed atmosphere. Visitors enjoy the authenticity and quietness compared to the busier tourist areas. | Kamini Beach, Traditional stone houses, Seaside restaurants, Local craft shops, Access to hiking trails |
| Vlychos | A beautiful coastal area offering serene beaches and stunning views, perfect for those looking to relax and enjoy nature. | Vlychos Beach, Local tavernas, Scenic hiking paths, Snorkeling spots, Peaceful atmosphere |
| Mandraki | A small harbor area that is less frequented by tourists, providing an authentic Hydra experience and a charming atmosphere. | Spetses Dock, Seaside cafés, Beautiful views, Quiet surroundings, Cultural heritage |
| Baxedes | Known for its natural beauty, clear waters, and relaxed vibe, it's a great contrast to the busier parts of Hydra. | Baxedes Beach, Natural landscapes, Local flora and fauna, Tranquil environment, Water activities |
| Firostefani | Providing stunning panoramic views of the Aegean Sea, this area attracts visitors looking for romantic spots and beautiful sunsets. | Scenic viewpoints, Nearby hiking trails, Traditional architecture, Picturesque scenery, Cafes and restaurants |
| Kaminia | This area is known for its picturesque village life and friendly atmosphere. It's ideal for travelers looking for a laid-back and traditional experience. | Kaminia Beach, Authentic local restaurants, Cultural festivals, Charming village life, Artisan shops |
Understanding Airbnb License Requirements & STR Laws in Hydra (2026)
Yes, Hydra, Attica, Greece enforces high STR regulations. Obtaining a license and ensuring compliance is almost certainly required according to current 2026 STR laws. Always verify the latest short term rental regulations and Airbnb license requirements directly with local government authorities for Hydra to ensure full compliance before hosting.
(Source: AirROI data, 2026, based on 94% licensed listings)
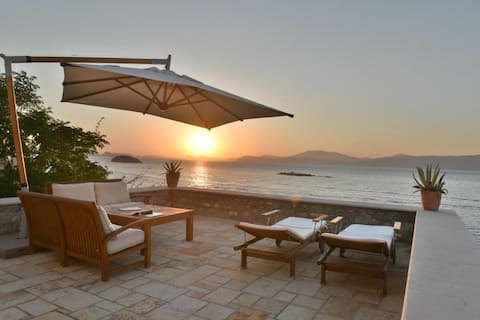
Top Performing Airbnb Properties in Hydra (2026)
Benchmark your potential! Explore examples of top-performing Airbnb properties in Hydrabased on Trailing Twelve Month (TTM) revenue. Analyze their characteristics, revenue, occupancy rate, and ADR to understand what drives success in this market.
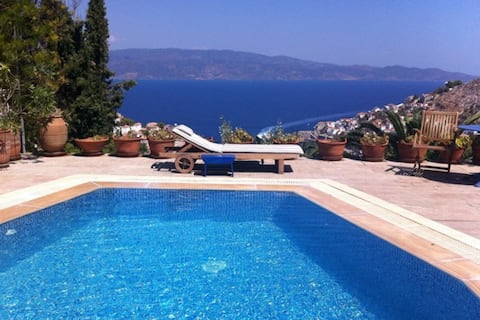
Classy Villa in Hydra, Amazing View & Private Pool
Entire Place • 4 bedrooms
Stunning Views Patios Front facing the harbour
Entire Place • 3 bedrooms

Villa Francesca Reg# 0262K91000284301
Entire Place • 4 bedrooms
LIVIN HYDRA ~The Mansion
Entire Place • 6 bedrooms
Hydra Kamini Beach Thea
Entire Place • 3 bedrooms
The House of the Shooting Star
Entire Place • 4 bedrooms
Note: Performance varies based on location, size, amenities, seasonality, and management quality. Data reflects the past 12 months.
Top Performing Airbnb Hosts in Hydra (2026)
Learn from the best! This table showcases top-performing Airbnb hosts in Hydra based on the number of properties managed and estimated total revenue over the past year. Analyze their scale and performance metrics.
| Host Name | Properties | Grossing Revenue | Stay Reviews | Avg Rating |
|---|---|---|---|---|
| George | 7 | $475,659 | 238 | 4.98/5.0 |
| Μαρία | 8 | $290,178 | 451 | 4.93/5.0 |
| Georgia | 4 | $281,223 | 133 | 4.99/5.0 |
| Stelios & Anna Maria | 6 | $223,599 | 736 | 4.93/5.0 |
| Dimitris | 9 | $221,915 | 168 | 4.62/5.0 |
| Tassos | 3 | $198,093 | 425 | 4.97/5.0 |
| Antonis | 1 | $184,030 | 21 | 5.00/5.0 |
| Nektaria | 1 | $174,561 | 38 | 4.97/5.0 |
| Christos | 1 | $170,751 | 30 | 5.00/5.0 |
| Stamatia Vlachodimitri | 5 | $164,445 | 429 | 4.95/5.0 |
Analyzing the strategies of top hosts, such as their property selection, pricing, and guest communication, can offer valuable lessons for optimizing your own Airbnb operations in Hydra.
Dive Deeper: Advanced Hydra STR Market Data (2026)
Ready to unlock more insights? AirROI provides access to advanced metrics and comprehensive Airbnb data for Hydra. Explore detailed analytics beyond this report to refine your investment strategy, optimize pricing, and maximize your vacation rental profits.
Explore Advanced MetricsHydra Short-Term Rental Market Composition (2026): Property & Room Types
Room Type Distribution
Property Type Distribution
Market Composition Insights for Hydra
- The Hydra Airbnb market composition is heavily skewed towards Entire Home/Apt listings, which make up 86.1% of the 330 active rentals. This indicates strong guest preference for privacy and space.
- Looking at the property type distribution in Hydra, House properties are the most common (63%), reflecting the local real estate landscape.
- Houses represent a significant 63% portion, catering likely to families or larger groups.
- Smaller segments like hotel/boutique, others, unique stays (combined 4.8%) offer potential for unique stay experiences.
Hydra Airbnb Room Capacity Analysis (2026): Bedroom Distribution
Distribution of Listings by Number of Bedrooms
Room Capacity Insights for Hydra
- The dominant room capacity in Hydra is 1 bedroom listings, making up 37.6% of the market. This suggests a strong demand for properties suitable for couples or solo travelers.
- Together, 1 bedroom and 2 bedrooms properties represent 70.3% of the active Airbnb listings in Hydra, indicating a high concentration in these sizes.
Hydra Vacation Rental Guest Capacity Trends (2026)
Distribution of Listings by Guest Capacity
Guest Capacity Insights for Hydra
- The most common guest capacity trend in Hydra vacation rentals is listings accommodating 4 guests (26.1%). This suggests the primary traveler segment is likely small families or groups.
- Properties designed for 4 guests and 2 guests dominate the Hydra STR market, accounting for 48.5% of listings.
- 20.3% of properties accommodate 6+ guests, serving the market segment for larger families or group travel in Hydra.
- On average, properties in Hydra are equipped to host 3.8 guests.
Hydra Airbnb Booking Patterns (2026): Available vs. Booked Days
Available Days Distribution
Booked Days Distribution
Booking Pattern Insights for Hydra
- The most common availability pattern in Hydra falls within the 181-270 days range, representing 43.3% of listings. This suggests many properties have significant open periods on their calendars.
- Approximately 77.2% of listings show high availability (181+ days open annually), indicating potential for increased bookings or specific owner usage patterns.
- For booked days, the 91-180 days range is most frequent in Hydra (44.8%), reflecting common guest stay durations or potential owner blocking patterns.
- A notable 24.8% of properties secure long booking periods (181+ days booked per year), highlighting successful long-term rental strategies or significant owner usage.
Hydra Airbnb Minimum Stay Requirements Analysis
Distribution of Listings by Minimum Night Requirement
1 Night
3 listings
0.9% of total
2 Nights
46 listings
13.9% of total
3 Nights
30 listings
9.1% of total
4-6 Nights
69 listings
20.9% of total
7-29 Nights
8 listings
2.4% of total
30+ Nights
174 listings
52.7% of total
Key Insights
- The most prevalent minimum stay requirement in Hydra is 30+ Nights, adopted by 52.7% of listings. This highlights the market's preference for longer commitments.
- Very short stays (1-2 nights) are less common (14.8%), suggesting hosts prefer slightly longer bookings to optimize turnover.
- A significant segment (52.7%) caters to monthly stays (30+ nights) in Hydra, pointing to opportunities in the extended-stay market.
Recommendations
- Align with the market by considering a 30+ Nights minimum stay, as 52.7% of Hydra hosts use this setting.
- If feasible, allowing 1-night stays, especially midweek or during low season, could capture last-minute bookings, as only 0.9% currently do.
- Explore offering discounts for stays of 30+ nights to attract the 52.7% of the market seeking extended stays.
- Adjust minimum nights based on seasonality – potentially shorter during low season and longer during peak demand periods in Hydra.
Hydra Airbnb Cancellation Policy Trends Analysis (2026)
Super Strict 60 Days
6 listings
1.8% of total
Limited
1 listings
0.3% of total
Super Strict 30 Days
11 listings
3.3% of total
Flexible
23 listings
7% of total
Moderate
62 listings
18.8% of total
Firm
138 listings
41.8% of total
Strict
89 listings
27% of total
Cancellation Policy Insights for Hydra
- The prevailing Airbnb cancellation policy trend in Hydra is Firm, used by 41.8% of listings.
- A majority (68.8%) of hosts in Hydra utilize Firm or Strict policies, indicating a market where hosts prioritize booking security.
Recommendations for Hosts
- Consider adopting a Firm policy to align with the 41.8% market standard in Hydra.
- Regularly review your cancellation policy against competitors and market demand shifts in Hydra.
Hydra STR Booking Lead Time Analysis (2026)
Average Booking Lead Time by Month
Booking Lead Time Insights for Hydra
- The overall average booking lead time for vacation rentals in Hydra is 77 days.
- Guests book furthest in advance for stays during August (average 101 days), likely coinciding with peak travel demand or local events.
- The shortest booking windows occur for stays in January (average 27 days), indicating more last-minute travel plans during this time.
- Seasonally, Summer (91 days avg.) sees the longest lead times, while Winter (41 days avg.) has the shortest, reflecting typical travel planning cycles.
Recommendations for Hosts
- Use the overall average lead time (77 days) as a baseline for your pricing and availability strategy in Hydra.
- For August stays, consider implementing length-of-stay discounts or slightly higher rates for bookings made less than 101 days out to capitalize on advance planning.
- Target marketing efforts for the Summer season well in advance (at least 91 days) to capture early planners.
- Monitor your own booking lead times against these Hydra averages to identify opportunities for dynamic pricing adjustments.
Popular & Essential Airbnb Amenities in Hydra (2026)
Amenity Prevalence
Amenity Insights for Hydra
- Essential amenities in Hydra that guests expect include: Wifi. Lacking these (this) could significantly impact bookings.
- Popular amenities like Air conditioning, Hair dryer, Essentials are common but not universal. Offering these can provide a competitive edge.
Recommendations for Hosts
- Ensure your listing includes all essential amenities for Hydra: Wifi.
- Prioritize adding missing essentials: Wifi.
- Consider adding popular differentiators like Air conditioning or Hair dryer to increase appeal.
- Highlight unique or less common amenities you offer (e.g., hot tub, dedicated workspace, EV charger) in your listing description and photos.
- Regularly check competitor amenities in Hydra to stay competitive.
Hydra Airbnb Guest Demographics & Profile Analysis (2026)
Guest Profile Summary for Hydra
- The typical guest profile for Airbnb in Hydra consists of predominantly international visitors (97%), with top international origins including United Kingdom, typically belonging to the Post-2000s (Gen Z/Alpha) group (50%), primarily speaking English or French.
- Domestic travelers account for 3.4% of guests.
- Key international markets include United States (26.5%) and United Kingdom (20.4%).
- Top languages spoken are English (44.8%) followed by French (14.4%).
- A significant demographic segment is the Post-2000s (Gen Z/Alpha) group, representing 50% of guests.
Recommendations for Hosts
- Focus marketing internationally, particularly towards travelers from United Kingdom.
- Tailor amenities and listing descriptions to appeal to the dominant Post-2000s (Gen Z/Alpha) demographic (e.g., highlight fast WiFi, smart home features, local guides).
- Highlight unique local experiences or amenities relevant to the primary guest profile.
- Consider seasonal promotions aligned with peak travel times for key origin markets.
Nearby Short-Term Rental Market Comparison
How does the Hydra Airbnb market stack up against its neighbors? Compare key performance metrics like average monthly revenue, ADR, and occupancy rates in surrounding areas to understand the broader regional STR landscape.
| Market | Active Properties | Monthly Revenue | Daily Rate | Avg. Occupancy |
|---|---|---|---|---|
| Plaka | 181 | $3,420 | $285.40 | 59% |
| Pollonia | 128 | $3,247 | $316.99 | 55% |
| Πλατύς Γιαλός | 10 | $2,927 | $373.22 | 41% |
| Pera Triovassalos | 61 | $2,606 | $239.07 | 57% |
| Panormos | 181 | $2,580 | $257.56 | 46% |
| Tripiti | 82 | $2,484 | $252.19 | 54% |
| Municipality of Milos | 113 | $2,422 | $221.00 | 55% |
| Plaka | 26 | $2,263 | $362.94 | 48% |
| Vouliagmeni Municipal Unit | 183 | $2,263 | $238.50 | 44% |
| Municipal Unit of Ayios Konstantinos | 11 | $2,235 | $303.34 | 34% |