Zia Airbnb Market Analysis 2026: Short Term Rental Data & Vacation Rental Statistics in Aegean, Greece
Is Airbnb profitable in Zia in 2026? Explore comprehensive Airbnb analytics for Zia, Aegean, Greece to uncover income potential. This 2026 STR market report for Zia, based on AirROI data from February 2025 to January 2026, reveals key trends in the niche market of 19 active listings.
Whether you're considering an Airbnb investment in Zia, optimizing your existing vacation rental, or exploring rental arbitrage opportunities, understanding the Zia Airbnb data is crucial. Navigating the high regulation landscape is key to maximizing your short term rental income potential. Let's dive into the specifics.
Key Zia Airbnb Performance Metrics Overview
Monthly Airbnb Revenue Variations & Income Potential in Zia (2026)
Understanding the monthly revenue variations for Airbnb listings in Zia is key to maximizing your short term rental income potential. Seasonality significantly impacts earnings. Our analysis, based on data from the past 12 months, shows that the peak revenue month for STRs in Zia is typically August, while December often presents the lowest earnings, highlighting opportunities for strategic pricing adjustments during shoulder and low seasons. Explore the typical Airbnb income in Zia across different performance tiers:
- Best-in-class properties (Top 10%) achieve $4,878+ monthly, often utilizing dynamic pricing and superior guest experiences.
- Strong performing properties (Top 25%) earn $2,881 or more, indicating effective management and desirable locations/amenities.
- Typical properties (Median) generate around $1,632 per month, representing the average market performance.
- Entry-level properties (Bottom 25%) see earnings around $851, often with potential for optimization.
Average Monthly Airbnb Earnings Trend in Zia
Zia Airbnb Occupancy Rate Trends (2026)
Maximize your bookings by understanding the Zia STR occupancy trends. Seasonal demand shifts significantly influence how often properties are booked. Typically, Augustsees the highest demand (peak season occupancy), while December experiences the lowest (low season). Effective strategies, like adjusting minimum stays or offering promotions, can boost occupancy during slower periods. Here's how different property tiers perform in Zia:
- Best-in-class properties (Top 10%) achieve 70%+ occupancy, indicating high desirability and potentially optimized availability.
- Strong performing properties (Top 25%) maintain 54% or higher occupancy, suggesting good market fit and guest satisfaction.
- Typical properties (Median) have an occupancy rate around 32%.
- Entry-level properties (Bottom 25%) average 20% occupancy, potentially facing higher vacancy.
Average Monthly Occupancy Rate Trend in Zia
Average Daily Rate (ADR) Airbnb Trends in Zia (2026)
Effective short term rental pricing strategy in Zia involves understanding monthly ADR fluctuations. The Average Daily Rate (ADR) for Airbnb in Zia typically peaks in August and dips lowest during February. Leveraging Airbnb dynamic pricing tools or strategies based on this seasonality can significantly boost revenue. Here's a look at the typical nightly rates achieved:
- Best-in-class properties (Top 10%) command rates of $270+ per night, often due to premium features or locations.
- Strong performing properties (Top 25%) achieve nightly rates of $208 or more.
- Typical properties (Median) charge around $156 per night.
- Entry-level properties (Bottom 25%) earn around $108 per night.
Average Daily Rate (ADR) Trend by Month in Zia
Get Live Zia Market Intelligence 👇
Explore Real-time Analytics
Airbnb Seasonality Analysis & Trends in Zia (2026)
Peak Season (August, September, July)
- Revenue averages $3,967 per month
- Occupancy rates average 61.4%
- Daily rates average $210
Shoulder Season
- Revenue averages $2,125 per month
- Occupancy maintains around 38.3%
- Daily rates hold near $167
Low Season (January, February, December)
- Revenue drops to average $573 per month
- Occupancy decreases to average 14.7%
- Daily rates adjust to average $160
Seasonality Insights for Zia
- The Airbnb seasonality in Zia shows highly seasonal trends requiring careful strategy. While the sections above show seasonal averages, it's also insightful to look at the extremes:
- During the high season, the absolute peak month showcases Zia's highest earning potential, with monthly revenues capable of climbing to $4,687, occupancy reaching a high of 67.7%, and ADRs peaking at $215.
- Conversely, the slowest single month of the year, typically falling within the low season, marks the market's lowest point. In this month, revenue might dip to $559, occupancy could drop to 9.7%, and ADRs may adjust down to $145.
- Understanding both the seasonal averages and these monthly peaks and troughs in revenue, occupancy, and ADR is crucial for maximizing your Airbnb profit potential in Zia.
Seasonal Strategies for Maximizing Profit
- Peak Season: Maximize revenue through premium pricing and potentially longer minimum stays. Ensure high availability.
- Low Season: Offer competitive pricing, special promotions (e.g., extended stay discounts), and flexible cancellation policies. Target off-season travelers like remote workers or budget-conscious guests.
- Shoulder Seasons: Implement dynamic pricing that balances peak and low rates. Target weekend travelers or specific events. Offer slightly more flexible terms than peak season.
- Regularly analyze your own performance against these Zia seasonality benchmarks and adjust your pricing and availability strategy accordingly.
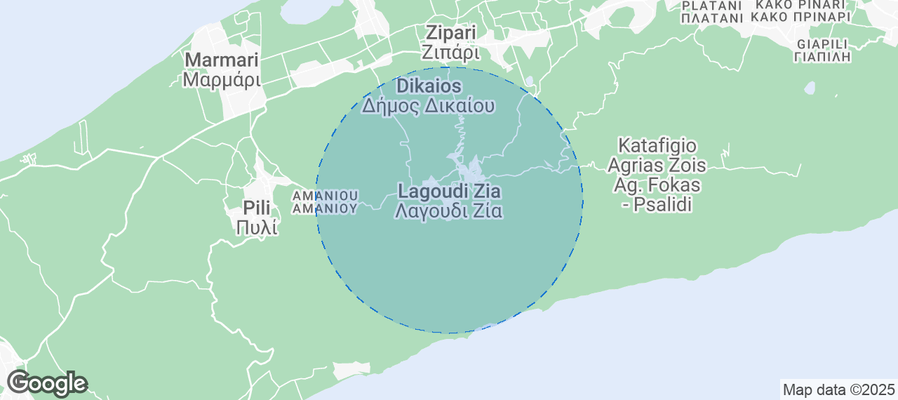
Best Areas for Airbnb Investment in Zia (2026)
Exploring the top neighborhoods for short-term rentals in Zia? This section highlights key areas, outlining why they are attractive for hosts and guests, along with notable local attractions. Consider these locations based on your target guest profile and investment strategy.
| Neighborhood / Area | Why Host Here? (Target Guests & Appeal) | Key Attractions & Landmarks |
|---|---|---|
| Zia Village | Quaint village known for its picturesque views and traditional Greek architecture. It's a sought-after location for tourists looking for a tranquil retreat with stunning sunsets over the Aegean Sea. | Zia Village Square, Local tavernas, Sunset views, Nature trails, Traditional craft shops |
| Kos Town | Vibrant town with a rich history, popular among tourists for its ancient ruins and lively atmosphere. Ideal for those who want to be close to cultural sites and nightlife. | Ancient Agora, Kos Castle, Asklepion, Bicycle rentals, Local markets |
| Psalidi | Coastal area known for its sandy beaches and resorts. It attracts sun-seeking tourists and families looking for beach vacations and water sports activities. | Psalidi Beach, Water sports centers, Beachfront restaurants, LUSH resort, Thermal springs |
| Agios Fokas | Known for its scenic beaches and spa resorts, this area is popular with those seeking wellness and relaxation by the sea. | Agios Fokas Beach, Spa facilities, Relaxing atmosphere, Beach clubs, Natural environment |
| Mastichari | Charming fishing village that offers a laid-back vibe. Great for tourists looking for authentic experiences, fresh seafood, and lovely beaches. | Mastichari Beach, Fishing harbor, Local seafood restaurants, Water sports, Boat trips to nearby islands |
| Tigaki | Popular resort area with a long sandy beach and family-friendly amenities. Attracts tourists looking for beach activities and resorts. | Tigaki Beach, Water parks, Cycling paths, Beach bars, Sunbeds and umbrellas |
| Kardamena | Lively village known for its nightlife and beach scene. Perfect for younger travelers and those looking to party. | Kardamena Beach, Nightclubs, Beachfront cafes, Boat trips, Watersports |
| Antimachia | Traditional village with a rich history, offering a more authentic Greek experience. Attractive to tourists interested in culture and history. | Antimachia Castle, Traditional windmills, Local festivals, Cultural workshops, Charming streets |
Understanding Airbnb License Requirements & STR Laws in Zia (2026)
Yes, Zia, Aegean, Greece enforces high STR regulations. Obtaining a license and ensuring compliance is almost certainly required according to current 2026 STR laws. Always verify the latest short term rental regulations and Airbnb license requirements directly with local government authorities for Zia to ensure full compliance before hosting.
(Source: AirROI data, 2026, based on 95% licensed listings)
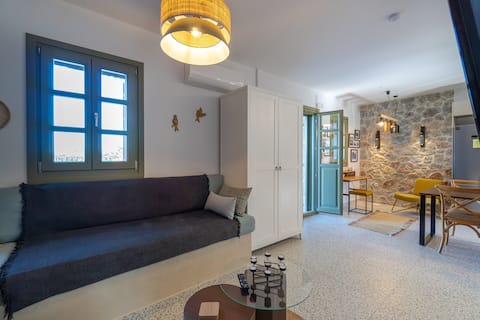
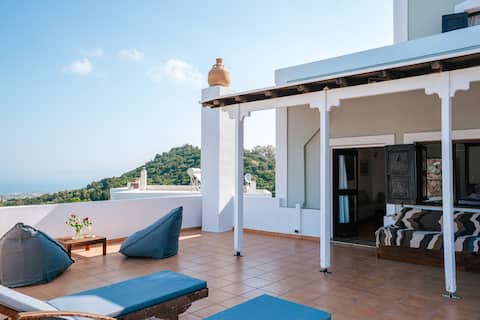
Top Performing Airbnb Properties in Zia (2026)
Benchmark your potential! Explore examples of top-performing Airbnb properties in Ziabased on Trailing Twelve Month (TTM) revenue. Analyze their characteristics, revenue, occupancy rate, and ADR to understand what drives success in this market.
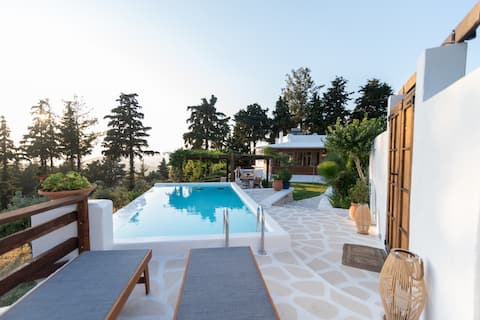
Tramonto Villa
Entire Place • 2 bedrooms

Infinity Residence - Charming Retreat in Kos
Entire Place • 1 bedroom
Superior Villa-Private Hot Tub & Panoramic View
Entire Place • 1 bedroom
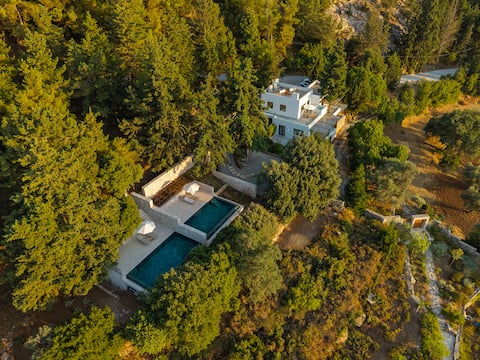
forest view villas 1
Entire Place • 2 bedrooms

Villa Κontýlo | Hot Tub | Junior Pool
Entire Place • 2 bedrooms
Infinity II - Modern Family Retreat in Kos
Entire Place • 2 bedrooms
Note: Performance varies based on location, size, amenities, seasonality, and management quality. Data reflects the past 12 months.
Top Performing Airbnb Hosts in Zia (2026)
Learn from the best! This table showcases top-performing Airbnb hosts in Zia based on the number of properties managed and estimated total revenue over the past year. Analyze their scale and performance metrics.
| Host Name | Properties | Grossing Revenue | Stay Reviews | Avg Rating |
|---|---|---|---|---|
| Niki | 5 | $111,982 | 145 | 4.82/5.0 |
| Dimitris | 2 | $91,544 | 147 | 4.88/5.0 |
| Triantafilia | 2 | $53,659 | 18 | 4.71/5.0 |
| Stelios | 1 | $28,563 | 45 | 4.93/5.0 |
| Νικος | 1 | $19,400 | 60 | 4.98/5.0 |
| Fofi | 1 | $19,122 | 6 | 5.00/5.0 |
| Chrysoula | 2 | $12,630 | 21 | 4.96/5.0 |
| Vangelis | 1 | $12,594 | 50 | 5.00/5.0 |
| Smart Electrical | 1 | $10,480 | 11 | 4.64/5.0 |
| Michail | 1 | $9,763 | 1 | Not Rated |
Analyzing the strategies of top hosts, such as their property selection, pricing, and guest communication, can offer valuable lessons for optimizing your own Airbnb operations in Zia.
Dive Deeper: Advanced Zia STR Market Data (2026)
Ready to unlock more insights? AirROI provides access to advanced metrics and comprehensive Airbnb data for Zia. Explore detailed analytics beyond this report to refine your investment strategy, optimize pricing, and maximize your vacation rental profits.
Explore Advanced MetricsZia Short-Term Rental Market Composition (2026): Property & Room Types
Room Type Distribution
Property Type Distribution
Market Composition Insights for Zia
- The Zia Airbnb market composition is heavily skewed towards Entire Home/Apt listings, which make up 100% of the 19 active rentals. This indicates strong guest preference for privacy and space.
- Looking at the property type distribution in Zia, House properties are the most common (68.4%), reflecting the local real estate landscape.
- Houses represent a significant 68.4% portion, catering likely to families or larger groups.
Zia Airbnb Room Capacity Analysis (2026): Bedroom Distribution
Distribution of Listings by Number of Bedrooms
Room Capacity Insights for Zia
- The dominant room capacity in Zia is 1 bedroom listings, making up 57.9% of the market. This suggests a strong demand for properties suitable for couples or solo travelers.
- Together, 1 bedroom and 2 bedrooms properties represent 100.0% of the active Airbnb listings in Zia, indicating a high concentration in these sizes.
- With over half the market (57.9%) consisting of studios or 1-bedroom units, Zia is particularly well-suited for individuals or couples.
Zia Vacation Rental Guest Capacity Trends (2026)
Distribution of Listings by Guest Capacity
Guest Capacity Insights for Zia
- The most common guest capacity trend in Zia vacation rentals is listings accommodating 4 guests (42.1%). This suggests the primary traveler segment is likely small families or groups.
- Properties designed for 4 guests and 2 guests dominate the Zia STR market, accounting for 68.4% of listings.
- 15.8% of properties accommodate 6+ guests, serving the market segment for larger families or group travel in Zia.
- On average, properties in Zia are equipped to host 3.9 guests.
Zia Airbnb Booking Patterns (2026): Available vs. Booked Days
Available Days Distribution
Booked Days Distribution
Booking Pattern Insights for Zia
- The most common availability pattern in Zia falls within the 271-366 days range, representing 47.4% of listings. This suggests many properties have significant open periods on their calendars.
- Approximately 89.5% of listings show high availability (181+ days open annually), indicating potential for increased bookings or specific owner usage patterns.
- For booked days, the 31-90 days range is most frequent in Zia (47.4%), reflecting common guest stay durations or potential owner blocking patterns.
- A notable 10.5% of properties secure long booking periods (181+ days booked per year), highlighting successful long-term rental strategies or significant owner usage.
Zia Airbnb Minimum Stay Requirements Analysis
Distribution of Listings by Minimum Night Requirement
1 Night
1 listings
5.3% of total
3 Nights
4 listings
21.1% of total
4-6 Nights
1 listings
5.3% of total
30+ Nights
13 listings
68.4% of total
Key Insights
- The most prevalent minimum stay requirement in Zia is 30+ Nights, adopted by 68.4% of listings. This highlights the market's preference for longer commitments.
- Very short stays (1-2 nights) are less common (5.3%), suggesting hosts prefer slightly longer bookings to optimize turnover.
- A significant segment (68.4%) caters to monthly stays (30+ nights) in Zia, pointing to opportunities in the extended-stay market.
Recommendations
- Align with the market by considering a 30+ Nights minimum stay, as 68.4% of Zia hosts use this setting.
- If feasible, allowing 1-night stays, especially midweek or during low season, could capture last-minute bookings, as only 5.3% currently do.
- Explore offering discounts for stays of 30+ nights to attract the 68.4% of the market seeking extended stays.
- Adjust minimum nights based on seasonality – potentially shorter during low season and longer during peak demand periods in Zia.
Zia Airbnb Cancellation Policy Trends Analysis (2026)
Flexible
2 listings
10.5% of total
Moderate
6 listings
31.6% of total
Firm
10 listings
52.6% of total
Strict
1 listings
5.3% of total
Cancellation Policy Insights for Zia
- The prevailing Airbnb cancellation policy trend in Zia is Firm, used by 52.6% of listings.
- A majority (57.9%) of hosts in Zia utilize Firm or Strict policies, indicating a market where hosts prioritize booking security.
- Strict cancellation policies are quite rare (5.3%), potentially making listings with this policy less competitive unless justified by high demand or property type.
Recommendations for Hosts
- Consider adopting a Firm policy to align with the 52.6% market standard in Zia.
- Using a Strict policy might deter some guests, as only 5.3% of listings use it. Evaluate if potential revenue protection outweighs possible lower booking rates.
- Regularly review your cancellation policy against competitors and market demand shifts in Zia.
Zia STR Booking Lead Time Analysis (2026)
Average Booking Lead Time by Month
Booking Lead Time Insights for Zia
- The overall average booking lead time for vacation rentals in Zia is 52 days.
- Guests book furthest in advance for stays during August (average 78 days), likely coinciding with peak travel demand or local events.
- The shortest booking windows occur for stays in February (average 2 days), indicating more last-minute travel plans during this time.
- Seasonally, Summer (63 days avg.) sees the longest lead times, while Winter (21 days avg.) has the shortest, reflecting typical travel planning cycles.
Recommendations for Hosts
- Use the overall average lead time (52 days) as a baseline for your pricing and availability strategy in Zia.
- For August stays, consider implementing length-of-stay discounts or slightly higher rates for bookings made less than 78 days out to capitalize on advance planning.
- During February, focus on last-minute booking availability and promotions, as guests book with very short notice (2 days avg.).
- Target marketing efforts for the Summer season well in advance (at least 63 days) to capture early planners.
- Monitor your own booking lead times against these Zia averages to identify opportunities for dynamic pricing adjustments.
Popular & Essential Airbnb Amenities in Zia (2026)
Amenity Prevalence
Amenity Insights for Zia
- Essential amenities in Zia that guests expect include: Hangers, Wifi, Essentials. Lacking these (any) could significantly impact bookings.
- Popular amenities like Kitchen, Coffee maker, Hair dryer are common but not universal. Offering these can provide a competitive edge.
Recommendations for Hosts
- Ensure your listing includes all essential amenities for Zia: Hangers, Wifi, Essentials.
- Consider adding popular differentiators like Kitchen or Coffee maker to increase appeal.
- Highlight unique or less common amenities you offer (e.g., hot tub, dedicated workspace, EV charger) in your listing description and photos.
- Regularly check competitor amenities in Zia to stay competitive.
Zia Airbnb Guest Demographics & Profile Analysis (2026)
Guest Profile Summary for Zia
- The typical guest profile for Airbnb in Zia consists of predominantly international visitors (100%), with top international origins including Italy, typically belonging to the Post-2000s (Gen Z/Alpha) group (50%), primarily speaking English or German.
- Domestic travelers account for 0.0% of guests.
- Key international markets include Germany (32.5%) and Italy (16.9%).
- Top languages spoken are English (41.9%) followed by German (23.3%).
- A significant demographic segment is the Post-2000s (Gen Z/Alpha) group, representing 50% of guests.
Recommendations for Hosts
- Focus marketing internationally, particularly towards travelers from Italy.
- Tailor amenities and listing descriptions to appeal to the dominant Post-2000s (Gen Z/Alpha) demographic (e.g., highlight fast WiFi, smart home features, local guides).
- Highlight unique local experiences or amenities relevant to the primary guest profile.
- Consider seasonal promotions aligned with peak travel times for key origin markets.
Nearby Short-Term Rental Market Comparison
How does the Zia Airbnb market stack up against its neighbors? Compare key performance metrics like average monthly revenue, ADR, and occupancy rates in surrounding areas to understand the broader regional STR landscape.
| Market | Active Properties | Monthly Revenue | Daily Rate | Avg. Occupancy |
|---|---|---|---|---|
| Μάσαρη | 23 | $2,949 | $260.24 | 50% |
| Kalathos | 53 | $2,908 | $304.93 | 50% |
| Municipality of Rhodes | 440 | $2,455 | $280.73 | 46% |
| Lachania | 50 | $2,448 | $347.79 | 46% |
| Lagoudi | 11 | $2,368 | $213.89 | 48% |
| Μαριτσά | 12 | $2,358 | $252.72 | 45% |
| Fanes | 24 | $2,255 | $252.48 | 41% |
| Lardos | 25 | $2,180 | $274.26 | 45% |
| Kolymbia | 134 | $2,156 | $236.46 | 48% |
| Lindos | 272 | $2,147 | $276.11 | 47% |