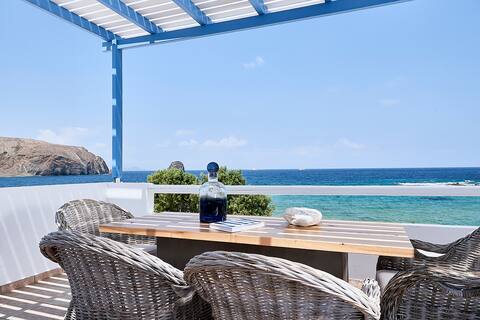
Pollonia Airbnb Market Analysis 2026: Short Term Rental Data & Vacation Rental Statistics in Aegean, Greece
Is Airbnb profitable in Pollonia in 2026? Explore comprehensive Airbnb analytics for Pollonia, Aegean, Greece to uncover income potential. This 2026 STR market report for Pollonia, based on AirROI data from February 2025 to January 2026, reveals key trends in the niche market of 128 active listings.
Whether you're considering an Airbnb investment in Pollonia, optimizing your existing vacation rental, or exploring rental arbitrage opportunities, understanding the Pollonia Airbnb data is crucial. Navigating the high regulation landscape is key to maximizing your short term rental income potential. Let's dive into the specifics.
Key Pollonia Airbnb Performance Metrics Overview
Monthly Airbnb Revenue Variations & Income Potential in Pollonia (2026)
Understanding the monthly revenue variations for Airbnb listings in Pollonia is key to maximizing your short term rental income potential. Seasonality significantly impacts earnings. Our analysis, based on data from the past 12 months, shows that the peak revenue month for STRs in Pollonia is typically August, while December often presents the lowest earnings, highlighting opportunities for strategic pricing adjustments during shoulder and low seasons. Explore the typical Airbnb income in Pollonia across different performance tiers:
- Best-in-class properties (Top 10%) achieve $8,200+ monthly, often utilizing dynamic pricing and superior guest experiences.
- Strong performing properties (Top 25%) earn $5,513 or more, indicating effective management and desirable locations/amenities.
- Typical properties (Median) generate around $3,065 per month, representing the average market performance.
- Entry-level properties (Bottom 25%) see earnings around $1,817, often with potential for optimization.
Average Monthly Airbnb Earnings Trend in Pollonia
Pollonia Airbnb Occupancy Rate Trends (2026)
Maximize your bookings by understanding the Pollonia STR occupancy trends. Seasonal demand shifts significantly influence how often properties are booked. Typically, Augustsees the highest demand (peak season occupancy), while December experiences the lowest (low season). Effective strategies, like adjusting minimum stays or offering promotions, can boost occupancy during slower periods. Here's how different property tiers perform in Pollonia:
- Best-in-class properties (Top 10%) achieve 80%+ occupancy, indicating high desirability and potentially optimized availability.
- Strong performing properties (Top 25%) maintain 62% or higher occupancy, suggesting good market fit and guest satisfaction.
- Typical properties (Median) have an occupancy rate around 49%.
- Entry-level properties (Bottom 25%) average 29% occupancy, potentially facing higher vacancy.
Average Monthly Occupancy Rate Trend in Pollonia
Average Daily Rate (ADR) Airbnb Trends in Pollonia (2026)
Effective short term rental pricing strategy in Pollonia involves understanding monthly ADR fluctuations. The Average Daily Rate (ADR) for Airbnb in Pollonia typically peaks in August and dips lowest during October. Leveraging Airbnb dynamic pricing tools or strategies based on this seasonality can significantly boost revenue. Here's a look at the typical nightly rates achieved:
- Best-in-class properties (Top 10%) command rates of $634+ per night, often due to premium features or locations.
- Strong performing properties (Top 25%) achieve nightly rates of $362 or more.
- Typical properties (Median) charge around $232 per night.
- Entry-level properties (Bottom 25%) earn around $145 per night.
Average Daily Rate (ADR) Trend by Month in Pollonia
Get Live Pollonia Market Intelligence 👇

Explore Real-time Analytics
Airbnb Seasonality Analysis & Trends in Pollonia (2026)
Peak Season (August, July, June)
- Revenue averages $8,373 per month
- Occupancy rates average 70.0%
- Daily rates average $373
Shoulder Season
- Revenue averages $3,746 per month
- Occupancy maintains around 46.4%
- Daily rates hold near $287
Low Season (January, February, December)
- Revenue drops to average $1,111 per month
- Occupancy decreases to average 24.3%
- Daily rates adjust to average $289
Seasonality Insights for Pollonia
- The Airbnb seasonality in Pollonia shows highly seasonal trends requiring careful strategy. While the sections above show seasonal averages, it's also insightful to look at the extremes:
- During the high season, the absolute peak month showcases Pollonia's highest earning potential, with monthly revenues capable of climbing to $9,441, occupancy reaching a high of 75.0%, and ADRs peaking at $395.
- Conversely, the slowest single month of the year, typically falling within the low season, marks the market's lowest point. In this month, revenue might dip to $519, occupancy could drop to 13.7%, and ADRs may adjust down to $246.
- Understanding both the seasonal averages and these monthly peaks and troughs in revenue, occupancy, and ADR is crucial for maximizing your Airbnb profit potential in Pollonia.
Seasonal Strategies for Maximizing Profit
- Peak Season: Maximize revenue through premium pricing and potentially longer minimum stays. Ensure high availability.
- Low Season: Offer competitive pricing, special promotions (e.g., extended stay discounts), and flexible cancellation policies. Target off-season travelers like remote workers or budget-conscious guests.
- Shoulder Seasons: Implement dynamic pricing that balances peak and low rates. Target weekend travelers or specific events. Offer slightly more flexible terms than peak season.
- Regularly analyze your own performance against these Pollonia seasonality benchmarks and adjust your pricing and availability strategy accordingly.
Best Areas for Airbnb Investment in Pollonia (2026)
Exploring the top neighborhoods for short-term rentals in Pollonia? This section highlights key areas, outlining why they are attractive for hosts and guests, along with notable local attractions. Consider these locations based on your target guest profile and investment strategy.
| Neighborhood / Area | Why Host Here? (Target Guests & Appeal) | Key Attractions & Landmarks |
|---|---|---|
| Pollonia Beach | A beautiful beach location known for its crystal clear waters and family-friendly atmosphere. Attracts both couples and families looking for a relaxing beach holiday. | Pollonia Beach, Adamas Port, Papafragas Beach, Milos Island, Ancient Theatre of Milos |
| Milos Island | An island known for its stunning landscapes and unique geological features. It's popular among nature lovers and tourists seeking adventures in scenic spots. | Sarakiniko Beach, Kleftiko Beach, Milos Mining Museum, Plaka Village, Catacombs of Milos |
| Pachena | A serene spot with less tourist traffic, perfect for those who want a peaceful getaway. Great for relaxation and enjoying nature. | Pachena Beach, Ancient Theatre of Milos, Sunset views, Local tavernas, Scenic trails |
| Triovasalos | A charming village with traditional architecture and a glimpse into local life. Suitable for travelers wanting an authentic experience of Greek culture. | Local markets, Traditional Cycladic houses, Folk art museums, Nearby hiking trails |
| Plaka | The historical capital of Milos, known for its picturesque streets and stunning sunsets. Attracts tourists interested in history and photography. | Plaka Castle, Archaeological Museum, Sarakiniko views, Sunset points, Local restaurants |
| Sikia | Known for its beautiful beaches and secluded spots. Perfect for visitors looking for privacy and tranquility by the sea. | Sikia Beach, Hidden coves, Nature walks, Secluded swimming spots, Local cuisine |
| Firiplaka | Famous for its colorful cliffs and dramatic scenery. Ideal for adventure seekers and those who love stunning landscapes. | Firiplaka Beach, Kleftiko boat tours, Snorkeling spots, Photography locations, Relaxing beach bars |
| Tsigrado | A unique and picturesque beach that requires a bit of hiking to reach, attracting adventurous visitors. Perfect for a more secluded beach experience. | Tsigrado Beach, Rock formations, Hiking trails, Local amenities |
Understanding Airbnb License Requirements & STR Laws in Pollonia (2026)
Yes, Pollonia, Aegean, Greece enforces high STR regulations. Obtaining a license and ensuring compliance is almost certainly required according to current 2026 STR laws. Always verify the latest short term rental regulations and Airbnb license requirements directly with local government authorities for Pollonia to ensure full compliance before hosting.
(Source: AirROI data, 2026, based on 96% licensed listings)
Top Performing Airbnb Properties in Pollonia (2026)
Benchmark your potential! Explore examples of top-performing Airbnb properties in Polloniabased on Trailing Twelve Month (TTM) revenue. Analyze their characteristics, revenue, occupancy rate, and ADR to understand what drives success in this market.

Costa Mare Milos - Delmar Collection
Entire Place • 3 bedrooms
Villa Delmar - Delmar Collection
Entire Place • 2 bedrooms

White House
Entire Place • 4 bedrooms

Luxury house by the Sea unique Sunset, waves...
Entire Place • 4 bedrooms

GREEN SUITE
Entire Place • 2 bedrooms
Eos Villa Milos
Entire Place • 3 bedrooms
Note: Performance varies based on location, size, amenities, seasonality, and management quality. Data reflects the past 12 months.
Top Performing Airbnb Hosts in Pollonia (2026)
Learn from the best! This table showcases top-performing Airbnb hosts in Pollonia based on the number of properties managed and estimated total revenue over the past year. Analyze their scale and performance metrics.
| Host Name | Properties | Grossing Revenue | Stay Reviews | Avg Rating |
|---|---|---|---|---|
| Michail | 6 | $338,232 | 152 | 4.95/5.0 |
| Georgios | 1 | $275,253 | 6 | 5.00/5.0 |
| Nikos | 9 | $243,228 | 356 | 4.86/5.0 |
| George | 2 | $201,310 | 31 | 4.98/5.0 |
| Μaria | 2 | $191,152 | 57 | 4.88/5.0 |
| Στεφανία | 2 | $170,589 | 34 | 5.00/5.0 |
| Akroploron Ike | 3 | $157,978 | 352 | 4.96/5.0 |
| Anna | 3 | $151,872 | 48 | 5.00/5.0 |
| Σοφία | 3 | $151,433 | 202 | 4.96/5.0 |
| Filio | 2 | $135,739 | 94 | 4.99/5.0 |
Analyzing the strategies of top hosts, such as their property selection, pricing, and guest communication, can offer valuable lessons for optimizing your own Airbnb operations in Pollonia.
Dive Deeper: Advanced Pollonia STR Market Data (2026)
Ready to unlock more insights? AirROI provides access to advanced metrics and comprehensive Airbnb data for Pollonia. Explore detailed analytics beyond this report to refine your investment strategy, optimize pricing, and maximize your vacation rental profits.
Explore Advanced MetricsPollonia Short-Term Rental Market Composition (2026): Property & Room Types
Room Type Distribution
Property Type Distribution
Market Composition Insights for Pollonia
- The Pollonia Airbnb market composition is heavily skewed towards Entire Home/Apt listings, which make up 81.3% of the 128 active rentals. This indicates strong guest preference for privacy and space.
- Looking at the property type distribution in Pollonia, Apartment/Condo properties are the most common (46.1%), reflecting the local real estate landscape.
- Houses represent a significant 40.6% portion, catering likely to families or larger groups.
- The presence of 10.9% Hotel/Boutique listings indicates integration with traditional hospitality.
- Smaller segments like others (combined 2.3%) offer potential for unique stay experiences.
Pollonia Airbnb Room Capacity Analysis (2026): Bedroom Distribution
Distribution of Listings by Number of Bedrooms
Room Capacity Insights for Pollonia
- The dominant room capacity in Pollonia is 1 bedroom listings, making up 50.8% of the market. This suggests a strong demand for properties suitable for couples or solo travelers.
- Together, 1 bedroom and 2 bedrooms properties represent 78.1% of the active Airbnb listings in Pollonia, indicating a high concentration in these sizes.
- With over half the market (50.8%) consisting of studios or 1-bedroom units, Pollonia is particularly well-suited for individuals or couples.
- Listings with 3+ bedrooms (7.8%) represent a smaller niche, potentially indicating an underserved market for larger group accommodations in Pollonia.
Pollonia Vacation Rental Guest Capacity Trends (2026)
Distribution of Listings by Guest Capacity
Guest Capacity Insights for Pollonia
- The most common guest capacity trend in Pollonia vacation rentals is listings accommodating 2 guests (28.9%). This suggests the primary traveler segment is likely couples or solo travelers.
- Properties designed for 2 guests and 4 guests dominate the Pollonia STR market, accounting for 53.1% of listings.
- 11.8% of properties accommodate 6+ guests, serving the market segment for larger families or group travel in Pollonia.
- On average, properties in Pollonia are equipped to host 3.4 guests.
Pollonia Airbnb Booking Patterns (2026): Available vs. Booked Days
Available Days Distribution
Booked Days Distribution
Booking Pattern Insights for Pollonia
- The most common availability pattern in Pollonia falls within the 181-270 days range, representing 49.2% of listings. This suggests many properties have significant open periods on their calendars.
- Approximately 85.9% of listings show high availability (181+ days open annually), indicating potential for increased bookings or specific owner usage patterns.
- For booked days, the 91-180 days range is most frequent in Pollonia (50%), reflecting common guest stay durations or potential owner blocking patterns.
- A notable 15.6% of properties secure long booking periods (181+ days booked per year), highlighting successful long-term rental strategies or significant owner usage.
Pollonia Airbnb Minimum Stay Requirements Analysis
Distribution of Listings by Minimum Night Requirement
1 Night
14 listings
10.9% of total
2 Nights
14 listings
10.9% of total
3 Nights
4 listings
3.1% of total
4-6 Nights
7 listings
5.5% of total
30+ Nights
89 listings
69.5% of total
Key Insights
- The most prevalent minimum stay requirement in Pollonia is 30+ Nights, adopted by 69.5% of listings. This highlights the market's preference for longer commitments.
- A significant segment (69.5%) caters to monthly stays (30+ nights) in Pollonia, pointing to opportunities in the extended-stay market.
Recommendations
- Align with the market by considering a 30+ Nights minimum stay, as 69.5% of Pollonia hosts use this setting.
- If feasible, allowing 1-night stays, especially midweek or during low season, could capture last-minute bookings, as only 10.9% currently do.
- Explore offering discounts for stays of 30+ nights to attract the 69.5% of the market seeking extended stays.
- Adjust minimum nights based on seasonality – potentially shorter during low season and longer during peak demand periods in Pollonia.
Pollonia Airbnb Cancellation Policy Trends Analysis (2026)
Super Strict 30 Days
8 listings
6.3% of total
Super Strict 60 Days
2 listings
1.6% of total
Flexible
3 listings
2.3% of total
Moderate
4 listings
3.1% of total
Firm
71 listings
55.5% of total
Strict
40 listings
31.3% of total
Cancellation Policy Insights for Pollonia
- The prevailing Airbnb cancellation policy trend in Pollonia is Firm, used by 55.5% of listings.
- A majority (86.8%) of hosts in Pollonia utilize Firm or Strict policies, indicating a market where hosts prioritize booking security.
Recommendations for Hosts
- Consider adopting a Firm policy to align with the 55.5% market standard in Pollonia.
- With 31.3% using Strict terms, this is a viable option in Pollonia, particularly for high-value properties or during peak demand periods.
- Regularly review your cancellation policy against competitors and market demand shifts in Pollonia.
Pollonia STR Booking Lead Time Analysis (2026)
Average Booking Lead Time by Month
Booking Lead Time Insights for Pollonia
- The overall average booking lead time for vacation rentals in Pollonia is 89 days.
- Guests book furthest in advance for stays during March (average 121 days), likely coinciding with peak travel demand or local events.
- The shortest booking windows occur for stays in December (average 0 days), indicating more last-minute travel plans during this time.
- Seasonally, Spring (99 days avg.) sees the longest lead times, while Winter (32 days avg.) has the shortest, reflecting typical travel planning cycles.
Recommendations for Hosts
- Use the overall average lead time (89 days) as a baseline for your pricing and availability strategy in Pollonia.
- For March stays, consider implementing length-of-stay discounts or slightly higher rates for bookings made less than 121 days out to capitalize on advance planning.
- During December, focus on last-minute booking availability and promotions, as guests book with very short notice (0 days avg.).
- Target marketing efforts for the Spring season well in advance (at least 99 days) to capture early planners.
- Monitor your own booking lead times against these Pollonia averages to identify opportunities for dynamic pricing adjustments.
Popular & Essential Airbnb Amenities in Pollonia (2026)
Amenity Prevalence
Amenity Insights for Pollonia
- Essential amenities in Pollonia that guests expect include: Wifi. Lacking these (this) could significantly impact bookings.
- Popular amenities like Air conditioning, Hot water, Hangers are common but not universal. Offering these can provide a competitive edge.
Recommendations for Hosts
- Ensure your listing includes all essential amenities for Pollonia: Wifi.
- Prioritize adding missing essentials: Wifi.
- Consider adding popular differentiators like Air conditioning or Hot water to increase appeal.
- Highlight unique or less common amenities you offer (e.g., hot tub, dedicated workspace, EV charger) in your listing description and photos.
- Regularly check competitor amenities in Pollonia to stay competitive.
Pollonia Airbnb Guest Demographics & Profile Analysis (2026)
Guest Profile Summary for Pollonia
- The typical guest profile for Airbnb in Pollonia consists of predominantly international visitors (99%), with top international origins including Australia, typically belonging to the Post-2000s (Gen Z/Alpha) group (50%), primarily speaking English or French.
- Domestic travelers account for 0.8% of guests.
- Key international markets include United States (39.4%) and Australia (16.4%).
- Top languages spoken are English (56.7%) followed by French (12.8%).
- A significant demographic segment is the Post-2000s (Gen Z/Alpha) group, representing 50% of guests.
Recommendations for Hosts
- Focus marketing internationally, particularly towards travelers from Australia.
- Tailor amenities and listing descriptions to appeal to the dominant Post-2000s (Gen Z/Alpha) demographic (e.g., highlight fast WiFi, smart home features, local guides).
- Highlight unique local experiences or amenities relevant to the primary guest profile.
- Consider seasonal promotions aligned with peak travel times for key origin markets.
Nearby Short-Term Rental Market Comparison
How does the Pollonia Airbnb market stack up against its neighbors? Compare key performance metrics like average monthly revenue, ADR, and occupancy rates in surrounding areas to understand the broader regional STR landscape.
| Market | Active Properties | Monthly Revenue | Daily Rate | Avg. Occupancy |
|---|---|---|---|---|
| Violi Charaki | 21 | $7,037 | $480.16 | 55% |
| Amnatos | 15 | $5,946 | $730.78 | 48% |
| Skaleta | 57 | $5,258 | $581.34 | 48% |
| Viranepiskopi | 11 | $4,940 | $322.10 | 65% |
| Perama | 27 | $4,927 | $392.67 | 52% |
| Pithari | 22 | $4,920 | $412.56 | 55% |
| Faros Armenistis | 119 | $4,791 | $715.43 | 41% |
| Xiro Chorio | 20 | $4,573 | $393.88 | 51% |
| Nea Magnisia | 22 | $4,332 | $392.45 | 52% |
| Municipality of Milopotamos | 20 | $3,882 | $348.23 | 51% |