Moutsouna Airbnb Market Analysis 2026: Short Term Rental Data & Vacation Rental Statistics in Aegean, Greece
Is Airbnb profitable in Moutsouna in 2026? Explore comprehensive Airbnb analytics for Moutsouna, Aegean, Greece to uncover income potential. This 2026 STR market report for Moutsouna, based on AirROI data from February 2025 to January 2026, reveals key trends in the niche market of 27 active listings.
Whether you're considering an Airbnb investment in Moutsouna, optimizing your existing vacation rental, or exploring rental arbitrage opportunities, understanding the Moutsouna Airbnb data is crucial. Navigating the high regulation landscape is key to maximizing your short term rental income potential. Let's dive into the specifics.
Key Moutsouna Airbnb Performance Metrics Overview
Monthly Airbnb Revenue Variations & Income Potential in Moutsouna (2026)
Understanding the monthly revenue variations for Airbnb listings in Moutsouna is key to maximizing your short term rental income potential. Seasonality significantly impacts earnings. Our analysis, based on data from the past 12 months, shows that the peak revenue month for STRs in Moutsouna is typically August, while February often presents the lowest earnings, highlighting opportunities for strategic pricing adjustments during shoulder and low seasons. Explore the typical Airbnb income in Moutsouna across different performance tiers:
- Best-in-class properties (Top 10%) achieve $3,971+ monthly, often utilizing dynamic pricing and superior guest experiences.
- Strong performing properties (Top 25%) earn $2,187 or more, indicating effective management and desirable locations/amenities.
- Typical properties (Median) generate around $1,269 per month, representing the average market performance.
- Entry-level properties (Bottom 25%) see earnings around $833, often with potential for optimization.
Average Monthly Airbnb Earnings Trend in Moutsouna
Moutsouna Airbnb Occupancy Rate Trends (2026)
Maximize your bookings by understanding the Moutsouna STR occupancy trends. Seasonal demand shifts significantly influence how often properties are booked. Typically, Augustsees the highest demand (peak season occupancy), while February experiences the lowest (low season). Effective strategies, like adjusting minimum stays or offering promotions, can boost occupancy during slower periods. Here's how different property tiers perform in Moutsouna:
- Best-in-class properties (Top 10%) achieve 59%+ occupancy, indicating high desirability and potentially optimized availability.
- Strong performing properties (Top 25%) maintain 53% or higher occupancy, suggesting good market fit and guest satisfaction.
- Typical properties (Median) have an occupancy rate around 33%.
- Entry-level properties (Bottom 25%) average 25% occupancy, potentially facing higher vacancy.
Average Monthly Occupancy Rate Trend in Moutsouna
Average Daily Rate (ADR) Airbnb Trends in Moutsouna (2026)
Effective short term rental pricing strategy in Moutsouna involves understanding monthly ADR fluctuations. The Average Daily Rate (ADR) for Airbnb in Moutsouna typically peaks in August and dips lowest during March. Leveraging Airbnb dynamic pricing tools or strategies based on this seasonality can significantly boost revenue. Here's a look at the typical nightly rates achieved:
- Best-in-class properties (Top 10%) command rates of $336+ per night, often due to premium features or locations.
- Strong performing properties (Top 25%) achieve nightly rates of $164 or more.
- Typical properties (Median) charge around $112 per night.
- Entry-level properties (Bottom 25%) earn around $87 per night.
Average Daily Rate (ADR) Trend by Month in Moutsouna
Get Live Moutsouna Market Intelligence 👇

Explore Real-time Analytics
Airbnb Seasonality Analysis & Trends in Moutsouna (2026)
Peak Season (August, July, September)
- Revenue averages $3,391 per month
- Occupancy rates average 58.7%
- Daily rates average $169
Shoulder Season
- Revenue averages $1,285 per month
- Occupancy maintains around 33.3%
- Daily rates hold near $144
Low Season (January, February, December)
- Revenue drops to average $22 per month
- Occupancy decreases to average 1.2%
- Daily rates adjust to average $141
Seasonality Insights for Moutsouna
- The Airbnb seasonality in Moutsouna shows highly seasonal trends requiring careful strategy. While the sections above show seasonal averages, it's also insightful to look at the extremes:
- During the high season, the absolute peak month showcases Moutsouna's highest earning potential, with monthly revenues capable of climbing to $4,374, occupancy reaching a high of 72.0%, and ADRs peaking at $180.
- Conversely, the slowest single month of the year, typically falling within the low season, marks the market's lowest point. In this month, revenue might dip to $0, occupancy could drop to 0.0%, and ADRs may adjust down to $138.
- Understanding both the seasonal averages and these monthly peaks and troughs in revenue, occupancy, and ADR is crucial for maximizing your Airbnb profit potential in Moutsouna.
Seasonal Strategies for Maximizing Profit
- Peak Season: Maximize revenue through premium pricing and potentially longer minimum stays. Ensure high availability.
- Low Season: Offer competitive pricing, special promotions (e.g., extended stay discounts), and flexible cancellation policies. Target off-season travelers like remote workers or budget-conscious guests.
- Shoulder Seasons: Implement dynamic pricing that balances peak and low rates. Target weekend travelers or specific events. Offer slightly more flexible terms than peak season.
- Regularly analyze your own performance against these Moutsouna seasonality benchmarks and adjust your pricing and availability strategy accordingly.
Best Areas for Airbnb Investment in Moutsouna (2026)
Exploring the top neighborhoods for short-term rentals in Moutsouna? This section highlights key areas, outlining why they are attractive for hosts and guests, along with notable local attractions. Consider these locations based on your target guest profile and investment strategy.
| Neighborhood / Area | Why Host Here? (Target Guests & Appeal) | Key Attractions & Landmarks |
|---|---|---|
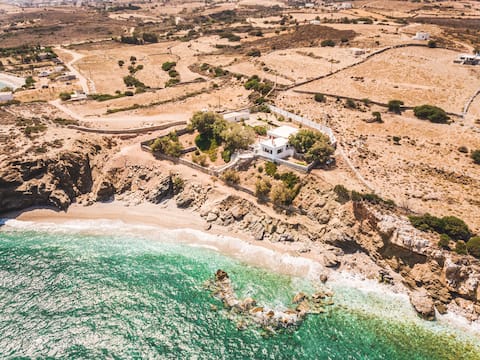
| Plaka Beach | A tranquil and beautiful beach known for its crystal-clear waters and stunning sunsets. Perfect for vacationers looking for relaxation and natural beauty. | Plaka Beach, Koufonisia, Koufonisia boat tours, Local tavernas, Snorkeling spots |
| Moutsouna Village | A charming coastal village that offers a taste of local life in Naxos. Great for tourists who want to explore authentic Greek culture and hospitality. | Village square, Traditional taverns, Fishing harbor, Nearby hiking trails, Local artisan shops |
| Akti Kastraki | A serene beach area with stunning views and less crowded spaces. Ideal for families and solo travelers seeking a peaceful getaway. | Kastraki Beach, Agios Prokopios, Windsurfing spots, Beach bars, Nature reserves |
| Apeiranthos | A picturesque mountain village known for its rich history and beautiful architecture. Attractive to guests interested in local culture and history. | Archaeological Museum, Church of Panagia, Cycladic architecture, Local folklore, Gastronomy experiences |
| Chalki | A small village in Naxos famous for its traditional architecture and famous Kitron liqueur. Draws visitors interested in local delicacies and history. | Kitron distilleries, Historical buildings, Artisan shops, Local markets, Cultural festivals |
| Naxos Town (Chora) | The capital of Naxos, known for its vibrant atmosphere, beautiful waterfront, and historical sites. A central hub for tourists visiting the island. | Portara, Naxos Castle, Old Market, Beaches, Dining and nightlife spots |
| Mikri Vigla | An ideal destination for windsurfing and kitesurfing. Attracts adventure seekers and water sports enthusiasts. | Mikri Vigla Beach, Surf schools, Water sports rentals, Scenic landscapes, Sunset viewing spots |
| Agios Prokopios | Home to one of the most beautiful beaches in Greece. Great for sunbathers and those looking for a lively beach atmosphere. | Agios Prokopios Beach, Beach bars and clubs, Water sports, Dining options on the beach, Sunset bars |
Understanding Airbnb License Requirements & STR Laws in Moutsouna (2026)
Yes, Moutsouna, Aegean, Greece enforces high STR regulations. Obtaining a license and ensuring compliance is almost certainly required according to current 2026 STR laws. Always verify the latest short term rental regulations and Airbnb license requirements directly with local government authorities for Moutsouna to ensure full compliance before hosting.
(Source: AirROI data, 2026, based on 96% licensed listings)
Top Performing Airbnb Properties in Moutsouna (2026)
Benchmark your potential! Explore examples of top-performing Airbnb properties in Moutsounabased on Trailing Twelve Month (TTM) revenue. Analyze their characteristics, revenue, occupancy rate, and ADR to understand what drives success in this market.
AlphaMu Beach House
Entire Place • 4 bedrooms
Naxos Beachfront Villa Ariadne
Entire Place • 4 bedrooms

Naxos Beachfront House Thesseus
Entire Place • 4 bedrooms

Villa Rouvis with outdoor Hot Tub
Entire Place • 2 bedrooms

The Beach House Moutsouna Naxos
Entire Place • 2 bedrooms
Evdokia-Cozy Olive Yard apartment-Sea View
Entire Place • 1 bedroom
Note: Performance varies based on location, size, amenities, seasonality, and management quality. Data reflects the past 12 months.
Top Performing Airbnb Hosts in Moutsouna (2026)
Learn from the best! This table showcases top-performing Airbnb hosts in Moutsouna based on the number of properties managed and estimated total revenue over the past year. Analyze their scale and performance metrics.
| Host Name | Properties | Grossing Revenue | Stay Reviews | Avg Rating |
|---|---|---|---|---|
| Matthew | 2 | $65,771 | 72 | 4.95/5.0 |
| Antonis | 1 | $45,091 | 47 | 4.94/5.0 |
| Μανόλης | 3 | $43,673 | 53 | 4.93/5.0 |
| Ματθούλα Αικατερίνη | 2 | $23,766 | 10 | 5.00/5.0 |
| Georgios | 1 | $21,597 | 24 | 4.92/5.0 |
| Kyriaki | 1 | $20,779 | 28 | 4.86/5.0 |
| Στεφανος | 3 | $17,666 | 15 | 4.93/5.0 |
| Dimitris-Michalis | 4 | $17,003 | 34 | 4.83/5.0 |
| Φλώρος | 1 | $14,744 | 36 | 4.94/5.0 |
| Fratzeskos | 2 | $13,244 | 45 | 4.89/5.0 |
Analyzing the strategies of top hosts, such as their property selection, pricing, and guest communication, can offer valuable lessons for optimizing your own Airbnb operations in Moutsouna.
Dive Deeper: Advanced Moutsouna STR Market Data (2026)
Ready to unlock more insights? AirROI provides access to advanced metrics and comprehensive Airbnb data for Moutsouna. Explore detailed analytics beyond this report to refine your investment strategy, optimize pricing, and maximize your vacation rental profits.
Explore Advanced MetricsMoutsouna Short-Term Rental Market Composition (2026): Property & Room Types
Room Type Distribution
Property Type Distribution
Market Composition Insights for Moutsouna
- The Moutsouna Airbnb market composition is heavily skewed towards Entire Home/Apt listings, which make up 92.6% of the 27 active rentals. This indicates strong guest preference for privacy and space.
- Looking at the property type distribution in Moutsouna, House properties are the most common (66.7%), reflecting the local real estate landscape.
- Houses represent a significant 66.7% portion, catering likely to families or larger groups.
- Smaller segments like hotel/boutique (combined 3.7%) offer potential for unique stay experiences.
Moutsouna Airbnb Room Capacity Analysis (2026): Bedroom Distribution
Distribution of Listings by Number of Bedrooms
Room Capacity Insights for Moutsouna
- The dominant room capacity in Moutsouna is 2 bedrooms listings, making up 44.4% of the market. This suggests a strong demand for properties suitable for couples or solo travelers.
- Together, 2 bedrooms and 1 bedroom properties represent 81.4% of the active Airbnb listings in Moutsouna, indicating a high concentration in these sizes.
Moutsouna Vacation Rental Guest Capacity Trends (2026)
Distribution of Listings by Guest Capacity
Guest Capacity Insights for Moutsouna
- The most common guest capacity trend in Moutsouna vacation rentals is listings accommodating 4 guests (40.7%). This suggests the primary traveler segment is likely small families or groups.
- Properties designed for 4 guests and 8+ guests dominate the Moutsouna STR market, accounting for 59.2% of listings.
- 29.6% of properties accommodate 6+ guests, serving the market segment for larger families or group travel in Moutsouna.
- On average, properties in Moutsouna are equipped to host 4.9 guests.
Moutsouna Airbnb Booking Patterns (2026): Available vs. Booked Days
Available Days Distribution
Booked Days Distribution
Booking Pattern Insights for Moutsouna
- The most common availability pattern in Moutsouna falls within the 271-366 days range, representing 66.7% of listings. This suggests many properties have significant open periods on their calendars.
- Approximately 100.0% of listings show high availability (181+ days open annually), indicating potential for increased bookings or specific owner usage patterns.
- For booked days, the 31-90 days range is most frequent in Moutsouna (44.4%), reflecting common guest stay durations or potential owner blocking patterns.
Moutsouna Airbnb Minimum Stay Requirements Analysis
Distribution of Listings by Minimum Night Requirement
1 Night
2 listings
7.4% of total
2 Nights
4 listings
14.8% of total
3 Nights
5 listings
18.5% of total
4-6 Nights
4 listings
14.8% of total
30+ Nights
12 listings
44.4% of total
Key Insights
- The most prevalent minimum stay requirement in Moutsouna is 30+ Nights, adopted by 44.4% of listings. This highlights the market's preference for longer commitments.
- A significant segment (44.4%) caters to monthly stays (30+ nights) in Moutsouna, pointing to opportunities in the extended-stay market.
Recommendations
- Align with the market by considering a 30+ Nights minimum stay, as 44.4% of Moutsouna hosts use this setting.
- If feasible, allowing 1-night stays, especially midweek or during low season, could capture last-minute bookings, as only 7.4% currently do.
- Explore offering discounts for stays of 30+ nights to attract the 44.4% of the market seeking extended stays.
- Adjust minimum nights based on seasonality – potentially shorter during low season and longer during peak demand periods in Moutsouna.
Moutsouna Airbnb Cancellation Policy Trends Analysis (2026)
Super Strict 30 Days
4 listings
14.8% of total
Flexible
2 listings
7.4% of total
Moderate
3 listings
11.1% of total
Firm
14 listings
51.9% of total
Strict
4 listings
14.8% of total
Cancellation Policy Insights for Moutsouna
- The prevailing Airbnb cancellation policy trend in Moutsouna is Firm, used by 51.9% of listings.
- A majority (66.7%) of hosts in Moutsouna utilize Firm or Strict policies, indicating a market where hosts prioritize booking security.
Recommendations for Hosts
- Consider adopting a Firm policy to align with the 51.9% market standard in Moutsouna.
- Using a Strict policy might deter some guests, as only 14.8% of listings use it. Evaluate if potential revenue protection outweighs possible lower booking rates.
- Regularly review your cancellation policy against competitors and market demand shifts in Moutsouna.
Moutsouna STR Booking Lead Time Analysis (2026)
Average Booking Lead Time by Month
Booking Lead Time Insights for Moutsouna
- The overall average booking lead time for vacation rentals in Moutsouna is 85 days.
- Guests book furthest in advance for stays during November (average 254 days), likely coinciding with peak travel demand or local events.
- The shortest booking windows occur for stays in December (average 0 days), indicating more last-minute travel plans during this time.
- Seasonally, Fall (133 days avg.) sees the longest lead times, while Winter (58 days avg.) has the shortest, reflecting typical travel planning cycles.
Recommendations for Hosts
- Use the overall average lead time (85 days) as a baseline for your pricing and availability strategy in Moutsouna.
- For November stays, consider implementing length-of-stay discounts or slightly higher rates for bookings made less than 254 days out to capitalize on advance planning.
- During December, focus on last-minute booking availability and promotions, as guests book with very short notice (0 days avg.).
- Target marketing efforts for the Fall season well in advance (at least 133 days) to capture early planners.
- Monitor your own booking lead times against these Moutsouna averages to identify opportunities for dynamic pricing adjustments.
Popular & Essential Airbnb Amenities in Moutsouna (2026)
Amenity Prevalence
Amenity Insights for Moutsouna
- Essential amenities in Moutsouna that guests expect include: Wifi, Cooking basics, TV, Air conditioning. Lacking these (any) could significantly impact bookings.
- Popular amenities like Hair dryer, Iron, Hangers are common but not universal. Offering these can provide a competitive edge.
Recommendations for Hosts
- Ensure your listing includes all essential amenities for Moutsouna: Wifi, Cooking basics, TV, Air conditioning.
- Prioritize adding missing essentials: Cooking basics, TV, Air conditioning.
- Consider adding popular differentiators like Hair dryer or Iron to increase appeal.
- Highlight unique or less common amenities you offer (e.g., hot tub, dedicated workspace, EV charger) in your listing description and photos.
- Regularly check competitor amenities in Moutsouna to stay competitive.
Moutsouna Airbnb Guest Demographics & Profile Analysis (2026)
Guest Profile Summary for Moutsouna
- The typical guest profile for Airbnb in Moutsouna consists of predominantly international visitors (96%), with top international origins including Germany, typically belonging to the Post-2000s (Gen Z/Alpha) group (50%), primarily speaking English or German.
- Domestic travelers account for 3.8% of guests.
- Key international markets include France (28.2%) and Germany (16.7%).
- Top languages spoken are English (41%) followed by German (23%).
- A significant demographic segment is the Post-2000s (Gen Z/Alpha) group, representing 50% of guests.
Recommendations for Hosts
- Focus marketing internationally, particularly towards travelers from Germany.
- Tailor amenities and listing descriptions to appeal to the dominant Post-2000s (Gen Z/Alpha) demographic (e.g., highlight fast WiFi, smart home features, local guides).
- Highlight unique local experiences or amenities relevant to the primary guest profile.
- Consider seasonal promotions aligned with peak travel times for key origin markets.
Nearby Short-Term Rental Market Comparison
How does the Moutsouna Airbnb market stack up against its neighbors? Compare key performance metrics like average monthly revenue, ADR, and occupancy rates in surrounding areas to understand the broader regional STR landscape.
| Market | Active Properties | Monthly Revenue | Daily Rate | Avg. Occupancy |
|---|---|---|---|---|
| Faros Armenistis | 119 | $4,791 | $715.43 | 41% |
| Ia Municipal Unit | 722 | $3,844 | $396.32 | 42% |
| Agios Ioannis Diakoftis | 159 | $3,592 | $590.02 | 39% |
| Orkos | 90 | $3,536 | $419.32 | 46% |
| Municipality of Mykonos | 330 | $3,535 | $688.35 | 35% |
| Plaka | 181 | $3,420 | $285.40 | 59% |
| Psarou | 114 | $3,339 | $721.78 | 36% |
| Pollonia | 128 | $3,247 | $316.99 | 55% |
| Plintri | 146 | $3,195 | $575.49 | 38% |
| Platys Gialos | 221 | $3,129 | $408.65 | 46% |