Korissia Airbnb Market Analysis 2026: Short Term Rental Data & Vacation Rental Statistics in Aegean, Greece
Is Airbnb profitable in Korissia in 2026? Explore comprehensive Airbnb analytics for Korissia, Aegean, Greece to uncover income potential. This 2026 STR market report for Korissia, based on AirROI data from February 2025 to January 2026, reveals key trends in the niche market of 103 active listings.
Whether you're considering an Airbnb investment in Korissia, optimizing your existing vacation rental, or exploring rental arbitrage opportunities, understanding the Korissia Airbnb data is crucial. Navigating the high regulation landscape is key to maximizing your short term rental income potential. Let's dive into the specifics.
Key Korissia Airbnb Performance Metrics Overview
Monthly Airbnb Revenue Variations & Income Potential in Korissia (2026)
Understanding the monthly revenue variations for Airbnb listings in Korissia is key to maximizing your short term rental income potential. Seasonality significantly impacts earnings. Our analysis, based on data from the past 12 months, shows that the peak revenue month for STRs in Korissia is typically August, while December often presents the lowest earnings, highlighting opportunities for strategic pricing adjustments during shoulder and low seasons. Explore the typical Airbnb income in Korissia across different performance tiers:
- Best-in-class properties (Top 10%) achieve $5,413+ monthly, often utilizing dynamic pricing and superior guest experiences.
- Strong performing properties (Top 25%) earn $2,510 or more, indicating effective management and desirable locations/amenities.
- Typical properties (Median) generate around $1,494 per month, representing the average market performance.
- Entry-level properties (Bottom 25%) see earnings around $820, often with potential for optimization.
Average Monthly Airbnb Earnings Trend in Korissia
Korissia Airbnb Occupancy Rate Trends (2026)
Maximize your bookings by understanding the Korissia STR occupancy trends. Seasonal demand shifts significantly influence how often properties are booked. Typically, Augustsees the highest demand (peak season occupancy), while December experiences the lowest (low season). Effective strategies, like adjusting minimum stays or offering promotions, can boost occupancy during slower periods. Here's how different property tiers perform in Korissia:
- Best-in-class properties (Top 10%) achieve 68%+ occupancy, indicating high desirability and potentially optimized availability.
- Strong performing properties (Top 25%) maintain 45% or higher occupancy, suggesting good market fit and guest satisfaction.
- Typical properties (Median) have an occupancy rate around 27%.
- Entry-level properties (Bottom 25%) average 14% occupancy, potentially facing higher vacancy.
Average Monthly Occupancy Rate Trend in Korissia
Average Daily Rate (ADR) Airbnb Trends in Korissia (2026)
Effective short term rental pricing strategy in Korissia involves understanding monthly ADR fluctuations. The Average Daily Rate (ADR) for Airbnb in Korissia typically peaks in August and dips lowest during November. Leveraging Airbnb dynamic pricing tools or strategies based on this seasonality can significantly boost revenue. Here's a look at the typical nightly rates achieved:
- Best-in-class properties (Top 10%) command rates of $549+ per night, often due to premium features or locations.
- Strong performing properties (Top 25%) achieve nightly rates of $349 or more.
- Typical properties (Median) charge around $186 per night.
- Entry-level properties (Bottom 25%) earn around $126 per night.
Average Daily Rate (ADR) Trend by Month in Korissia
Get Live Korissia Market Intelligence 👇

Explore Real-time Analytics
Airbnb Seasonality Analysis & Trends in Korissia (2026)
Peak Season (August, July, October)
- Revenue averages $4,084 per month
- Occupancy rates average 50.4%
- Daily rates average $290
Shoulder Season
- Revenue averages $1,878 per month
- Occupancy maintains around 28.3%
- Daily rates hold near $270
Low Season (February, April, December)
- Revenue drops to average $1,093 per month
- Occupancy decreases to average 21.7%
- Daily rates adjust to average $264
Seasonality Insights for Korissia
- The Airbnb seasonality in Korissia shows highly seasonal trends requiring careful strategy. While the sections above show seasonal averages, it's also insightful to look at the extremes:
- During the high season, the absolute peak month showcases Korissia's highest earning potential, with monthly revenues capable of climbing to $5,318, occupancy reaching a high of 63.8%, and ADRs peaking at $310.
- Conversely, the slowest single month of the year, typically falling within the low season, marks the market's lowest point. In this month, revenue might dip to $544, occupancy could drop to 14.9%, and ADRs may adjust down to $256.
- Understanding both the seasonal averages and these monthly peaks and troughs in revenue, occupancy, and ADR is crucial for maximizing your Airbnb profit potential in Korissia.
Seasonal Strategies for Maximizing Profit
- Peak Season: Maximize revenue through premium pricing and potentially longer minimum stays. Ensure high availability.
- Low Season: Offer competitive pricing, special promotions (e.g., extended stay discounts), and flexible cancellation policies. Target off-season travelers like remote workers or budget-conscious guests.
- Shoulder Seasons: Implement dynamic pricing that balances peak and low rates. Target weekend travelers or specific events. Offer slightly more flexible terms than peak season.
- Regularly analyze your own performance against these Korissia seasonality benchmarks and adjust your pricing and availability strategy accordingly.
Best Areas for Airbnb Investment in Korissia (2026)
Exploring the top neighborhoods for short-term rentals in Korissia? This section highlights key areas, outlining why they are attractive for hosts and guests, along with notable local attractions. Consider these locations based on your target guest profile and investment strategy.
| Neighborhood / Area | Why Host Here? (Target Guests & Appeal) | Key Attractions & Landmarks |
|---|---|---|
| Korissia Port | The main entry point of Korissia with a bustling atmosphere, making it ideal for visitors arriving by ferry. Close to restaurants and cafes, it offers a lively experience for tourists. | Korissia Beach, Nearby restaurants, Ferry services to Kea, Local shops, Scenic waterfront |
| Xyla Beach | Known for its sandy shores and calm waters, Xyla Beach is a favorite spot for families and beachgoers. Its relaxed environment makes it an attractive area for vacation rentals. | Xyla Beach, Lifeguards on duty, Sunbeds and umbrellas, Beach bars, Water sports activities |
| Otzias | A charming village with a beautiful bay, Otzias is perfect for those looking for a quiet getaway. It attracts nature lovers and those who appreciate serene beach life. | Otzias Beach, Local tavernas, Scenic hiking trails, Historical sites nearby, Vibrant local culture |
| Kea Town (Ioulida) | The central town of Kea, located just a short drive from Korissia, offers a mix of traditional architecture and modern amenities. It's perfect for tourists wanting to explore the island’s history and culture. | Ioulida Castle, Kea Archaeological Museum, Traditional craftsmanship, Local markets, Scenic viewpoints |
| Koundouros | A popular destination for its beautiful beaches and crystal-clear waters. Koundouros draws visitors looking for a lively seaside experience with numerous amenities. | Koundouros Beach, Beach clubs, Waterfront dining, Scuba diving spots, Lagoon-style beaches |
| Pisses Beach | Famous for its picturesque setting and calm waters, Pisses Beach attracts families and swimmers looking for a relaxing day under the sun. | Pisses Beach, Secluded coves, Nearby tavernas, Sunset views, Calm swimming waters |
| Sights of Kea | The diverse landscapes and natural beauty of Kea offer hiking and outdoor activities. Ideal for tourists interested in nature and adventure tourism. | Hiking trails, Nature reserves, Breathtaking landscapes, Wildlife watching, Cultural heritage sites |
| Gialiskari Beach | This small, beautiful beach is known for its tranquility and picturesque views, making it ideal for a romantic getaway or a peaceful retreat. | Gialiskari Beach, Secluded setting, Scenic spots for photos, Quiet dining options, Sunbathing areas |
Understanding Airbnb License Requirements & STR Laws in Korissia (2026)
Yes, Korissia, Aegean, Greece enforces high STR regulations. Obtaining a license and ensuring compliance is almost certainly required according to current 2026 STR laws. Always verify the latest short term rental regulations and Airbnb license requirements directly with local government authorities for Korissia to ensure full compliance before hosting.
(Source: AirROI data, 2026, based on 89% licensed listings)
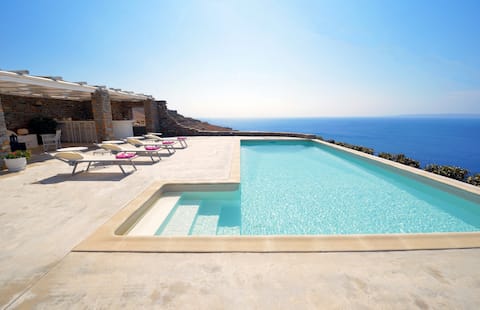
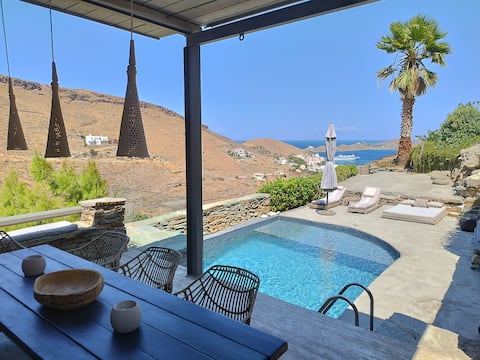
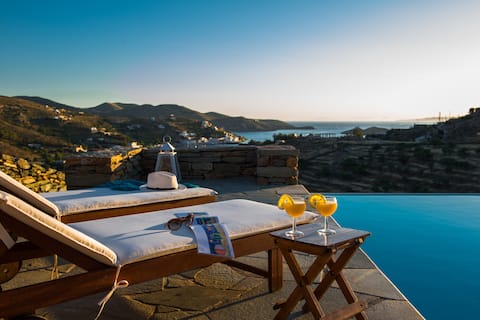
Top Performing Airbnb Properties in Korissia (2026)
Benchmark your potential! Explore examples of top-performing Airbnb properties in Korissiabased on Trailing Twelve Month (TTM) revenue. Analyze their characteristics, revenue, occupancy rate, and ADR to understand what drives success in this market.

Luxurious Villa Luna with pool, sea & sunset view
Entire Place • 4 bedrooms
Spectacular sunset view villa
Entire Place • 5 bedrooms
Kydippi Kea villa
Entire Place • 3 bedrooms

Sunset Heaven Villa on Kea
Entire Place • 4 bedrooms
Kea Summer Villa, serene summer living in Kea/Tzia
Entire Place • 3 bedrooms

Live In Blue - Azure Magic Views & Private Pool
Entire Place • 2 bedrooms
Note: Performance varies based on location, size, amenities, seasonality, and management quality. Data reflects the past 12 months.
Top Performing Airbnb Hosts in Korissia (2026)
Learn from the best! This table showcases top-performing Airbnb hosts in Korissia based on the number of properties managed and estimated total revenue over the past year. Analyze their scale and performance metrics.
| Host Name | Properties | Grossing Revenue | Stay Reviews | Avg Rating |
|---|---|---|---|---|
| Maria | 11 | $229,412 | 96 | 4.81/5.0 |
| Konstantinos | 7 | $131,276 | 70 | 4.70/5.0 |
| Maria | 1 | $62,427 | 31 | 4.90/5.0 |
| Nickos | 1 | $62,332 | 16 | 4.94/5.0 |
| Marietta | 5 | $55,443 | 28 | 4.88/5.0 |
| Mary | 2 | $53,283 | 97 | 4.97/5.0 |
| Aegli | 1 | $49,076 | 5 | 4.80/5.0 |
| Alfredos | 4 | $47,157 | 66 | 4.92/5.0 |
| Eftichia | 3 | $45,785 | 65 | 4.93/5.0 |
| Σοφία | 2 | $44,387 | 11 | 5.00/5.0 |
Analyzing the strategies of top hosts, such as their property selection, pricing, and guest communication, can offer valuable lessons for optimizing your own Airbnb operations in Korissia.
Dive Deeper: Advanced Korissia STR Market Data (2026)
Ready to unlock more insights? AirROI provides access to advanced metrics and comprehensive Airbnb data for Korissia. Explore detailed analytics beyond this report to refine your investment strategy, optimize pricing, and maximize your vacation rental profits.
Explore Advanced MetricsKorissia Short-Term Rental Market Composition (2026): Property & Room Types
Room Type Distribution
Property Type Distribution
Market Composition Insights for Korissia
- The Korissia Airbnb market composition is heavily skewed towards Entire Home/Apt listings, which make up 92.2% of the 103 active rentals. This indicates strong guest preference for privacy and space.
- Looking at the property type distribution in Korissia, House properties are the most common (77.7%), reflecting the local real estate landscape.
- Houses represent a significant 77.7% portion, catering likely to families or larger groups.
- The presence of 9.7% Hotel/Boutique listings indicates integration with traditional hospitality.
- Smaller segments like outdoor/unique, others (combined 2.0%) offer potential for unique stay experiences.
Korissia Airbnb Room Capacity Analysis (2026): Bedroom Distribution
Distribution of Listings by Number of Bedrooms
Room Capacity Insights for Korissia
- The dominant room capacity in Korissia is 1 bedroom listings, making up 38.8% of the market. This suggests a strong demand for properties suitable for couples or solo travelers.
- Together, 1 bedroom and 2 bedrooms properties represent 63.1% of the active Airbnb listings in Korissia, indicating a high concentration in these sizes.
- A significant 31.1% of listings offer 3+ bedrooms, catering to larger groups and families seeking more space in Korissia.
Korissia Vacation Rental Guest Capacity Trends (2026)
Distribution of Listings by Guest Capacity
Guest Capacity Insights for Korissia
- The most common guest capacity trend in Korissia vacation rentals is listings accommodating 4 guests (23.3%). This suggests the primary traveler segment is likely small families or groups.
- Properties designed for 4 guests and 2 guests dominate the Korissia STR market, accounting for 44.7% of listings.
- 35.9% of properties accommodate 6+ guests, serving the market segment for larger families or group travel in Korissia.
- On average, properties in Korissia are equipped to host 4.6 guests.
Korissia Airbnb Booking Patterns (2026): Available vs. Booked Days
Available Days Distribution
Booked Days Distribution
Booking Pattern Insights for Korissia
- The most common availability pattern in Korissia falls within the 271-366 days range, representing 84.5% of listings. This suggests many properties have significant open periods on their calendars.
- Approximately 98.1% of listings show high availability (181+ days open annually), indicating potential for increased bookings or specific owner usage patterns.
- For booked days, the 31-90 days range is most frequent in Korissia (56.3%), reflecting common guest stay durations or potential owner blocking patterns.
- A notable 1.9% of properties secure long booking periods (181+ days booked per year), highlighting successful long-term rental strategies or significant owner usage.
Korissia Airbnb Minimum Stay Requirements Analysis
Distribution of Listings by Minimum Night Requirement
1 Night
1 listings
1% of total
2 Nights
24 listings
23.3% of total
3 Nights
6 listings
5.8% of total
4-6 Nights
18 listings
17.5% of total
7-29 Nights
3 listings
2.9% of total
30+ Nights
51 listings
49.5% of total
Key Insights
- The most prevalent minimum stay requirement in Korissia is 30+ Nights, adopted by 49.5% of listings. This highlights the market's preference for longer commitments.
- A significant segment (49.5%) caters to monthly stays (30+ nights) in Korissia, pointing to opportunities in the extended-stay market.
Recommendations
- Align with the market by considering a 30+ Nights minimum stay, as 49.5% of Korissia hosts use this setting.
- If feasible, allowing 1-night stays, especially midweek or during low season, could capture last-minute bookings, as only 1% currently do.
- Explore offering discounts for stays of 30+ nights to attract the 49.5% of the market seeking extended stays.
- Adjust minimum nights based on seasonality – potentially shorter during low season and longer during peak demand periods in Korissia.
Korissia Airbnb Cancellation Policy Trends Analysis (2026)
Limited
2 listings
1.9% of total
Super Strict 60 Days
1 listings
1% of total
Super Strict 30 Days
2 listings
1.9% of total
Flexible
4 listings
3.9% of total
Moderate
9 listings
8.7% of total
Firm
36 listings
35% of total
Strict
49 listings
47.6% of total
Cancellation Policy Insights for Korissia
- The prevailing Airbnb cancellation policy trend in Korissia is Strict, used by 47.6% of listings.
- A majority (82.6%) of hosts in Korissia utilize Firm or Strict policies, indicating a market where hosts prioritize booking security.
Recommendations for Hosts
- Consider adopting a Strict policy to align with the 47.6% market standard in Korissia.
- With 47.6% using Strict terms, this is a viable option in Korissia, particularly for high-value properties or during peak demand periods.
- Regularly review your cancellation policy against competitors and market demand shifts in Korissia.
Korissia STR Booking Lead Time Analysis (2026)
Average Booking Lead Time by Month
Booking Lead Time Insights for Korissia
- The overall average booking lead time for vacation rentals in Korissia is 55 days.
- Guests book furthest in advance for stays during November (average 101 days), likely coinciding with peak travel demand or local events.
- The shortest booking windows occur for stays in February (average 17 days), indicating more last-minute travel plans during this time.
- Seasonally, Fall (72 days avg.) sees the longest lead times, while Winter (23 days avg.) has the shortest, reflecting typical travel planning cycles.
Recommendations for Hosts
- Use the overall average lead time (55 days) as a baseline for your pricing and availability strategy in Korissia.
- For November stays, consider implementing length-of-stay discounts or slightly higher rates for bookings made less than 101 days out to capitalize on advance planning.
- Target marketing efforts for the Fall season well in advance (at least 72 days) to capture early planners.
- Monitor your own booking lead times against these Korissia averages to identify opportunities for dynamic pricing adjustments.
Popular & Essential Airbnb Amenities in Korissia (2026)
Amenity Prevalence
Amenity Insights for Korissia
- Essential amenities in Korissia that guests expect include: Air conditioning. Lacking these (this) could significantly impact bookings.
- Popular amenities like Hangers, Hair dryer, Hot water are common but not universal. Offering these can provide a competitive edge.
- Warning: Wifi is not universally provided but is considered essential globally. Ensure reliable Wifi is offered.
Recommendations for Hosts
- Ensure your listing includes all essential amenities for Korissia: Air conditioning.
- Prioritize adding missing essentials: Air conditioning.
- Consider adding popular differentiators like Hangers or Hair dryer to increase appeal.
- Highlight unique or less common amenities you offer (e.g., hot tub, dedicated workspace, EV charger) in your listing description and photos.
- Regularly check competitor amenities in Korissia to stay competitive.
Korissia Airbnb Guest Demographics & Profile Analysis (2026)
Guest Profile Summary for Korissia
- The typical guest profile for Airbnb in Korissia consists of predominantly international visitors (79%), with top international origins including United Kingdom, typically belonging to the Post-2000s (Gen Z/Alpha) group (50%), primarily speaking English or French.
- Domestic travelers account for 21.0% of guests.
- Key international markets include Greece (21%) and United Kingdom (17.1%).
- Top languages spoken are English (39.1%) followed by French (14.7%).
- A significant demographic segment is the Post-2000s (Gen Z/Alpha) group, representing 50% of guests.
Recommendations for Hosts
- Focus marketing internationally, particularly towards travelers from United Kingdom.
- Tailor amenities and listing descriptions to appeal to the dominant Post-2000s (Gen Z/Alpha) demographic (e.g., highlight fast WiFi, smart home features, local guides).
- Highlight unique local experiences or amenities relevant to the primary guest profile.
- Consider seasonal promotions aligned with peak travel times for key origin markets.
Nearby Short-Term Rental Market Comparison
How does the Korissia Airbnb market stack up against its neighbors? Compare key performance metrics like average monthly revenue, ADR, and occupancy rates in surrounding areas to understand the broader regional STR landscape.
| Market | Active Properties | Monthly Revenue | Daily Rate | Avg. Occupancy |
|---|---|---|---|---|
| Faros Armenistis | 119 | $4,791 | $715.43 | 41% |
| Ia Municipal Unit | 722 | $3,844 | $396.32 | 42% |
| Agios Ioannis Diakoftis | 159 | $3,592 | $590.02 | 39% |
| Orkos | 90 | $3,536 | $419.32 | 46% |
| Municipality of Mykonos | 330 | $3,535 | $688.35 | 35% |
| Plaka | 181 | $3,420 | $285.40 | 59% |
| Psarou | 114 | $3,339 | $721.78 | 36% |
| Pollonia | 128 | $3,247 | $316.99 | 55% |
| Plintri | 146 | $3,195 | $575.49 | 38% |
| Platys Gialos | 221 | $3,129 | $408.65 | 46% |