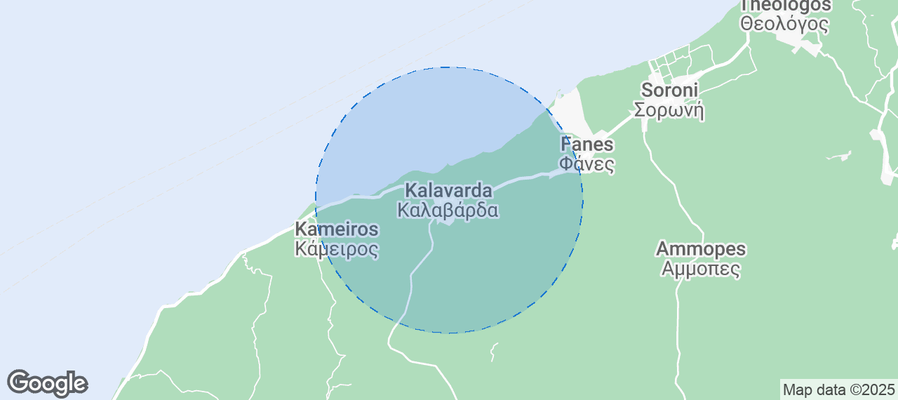
Kalavarda Airbnb Market Analysis 2026: Short Term Rental Data & Vacation Rental Statistics in Aegean, Greece
Is Airbnb profitable in Kalavarda in 2026? Explore comprehensive Airbnb analytics for Kalavarda, Aegean, Greece to uncover income potential. This 2026 STR market report for Kalavarda, based on AirROI data from February 2025 to January 2026, reveals key trends in the niche market of 21 active listings.
Whether you're considering an Airbnb investment in Kalavarda, optimizing your existing vacation rental, or exploring rental arbitrage opportunities, understanding the Kalavarda Airbnb data is crucial. Navigating the high regulation landscape is key to maximizing your short term rental income potential. Let's dive into the specifics.
Key Kalavarda Airbnb Performance Metrics Overview
Monthly Airbnb Revenue Variations & Income Potential in Kalavarda (2026)
Understanding the monthly revenue variations for Airbnb listings in Kalavarda is key to maximizing your short term rental income potential. Seasonality significantly impacts earnings. Our analysis, based on data from the past 12 months, shows that the peak revenue month for STRs in Kalavarda is typically August, while January often presents the lowest earnings, highlighting opportunities for strategic pricing adjustments during shoulder and low seasons. Explore the typical Airbnb income in Kalavarda across different performance tiers:
- Best-in-class properties (Top 10%) achieve $4,594+ monthly, often utilizing dynamic pricing and superior guest experiences.
- Strong performing properties (Top 25%) earn $2,730 or more, indicating effective management and desirable locations/amenities.
- Typical properties (Median) generate around $1,584 per month, representing the average market performance.
- Entry-level properties (Bottom 25%) see earnings around $803, often with potential for optimization.
Average Monthly Airbnb Earnings Trend in Kalavarda
Kalavarda Airbnb Occupancy Rate Trends (2026)
Maximize your bookings by understanding the Kalavarda STR occupancy trends. Seasonal demand shifts significantly influence how often properties are booked. Typically, Julysees the highest demand (peak season occupancy), while January experiences the lowest (low season). Effective strategies, like adjusting minimum stays or offering promotions, can boost occupancy during slower periods. Here's how different property tiers perform in Kalavarda:
- Best-in-class properties (Top 10%) achieve 76%+ occupancy, indicating high desirability and potentially optimized availability.
- Strong performing properties (Top 25%) maintain 57% or higher occupancy, suggesting good market fit and guest satisfaction.
- Typical properties (Median) have an occupancy rate around 40%.
- Entry-level properties (Bottom 25%) average 22% occupancy, potentially facing higher vacancy.
Average Monthly Occupancy Rate Trend in Kalavarda
Average Daily Rate (ADR) Airbnb Trends in Kalavarda (2026)
Effective short term rental pricing strategy in Kalavarda involves understanding monthly ADR fluctuations. The Average Daily Rate (ADR) for Airbnb in Kalavarda typically peaks in September and dips lowest during February. Leveraging Airbnb dynamic pricing tools or strategies based on this seasonality can significantly boost revenue. Here's a look at the typical nightly rates achieved:
- Best-in-class properties (Top 10%) command rates of $269+ per night, often due to premium features or locations.
- Strong performing properties (Top 25%) achieve nightly rates of $163 or more.
- Typical properties (Median) charge around $114 per night.
- Entry-level properties (Bottom 25%) earn around $79 per night.
Average Daily Rate (ADR) Trend by Month in Kalavarda
Get Live Kalavarda Market Intelligence 👇
Explore Real-time Analytics
Airbnb Seasonality Analysis & Trends in Kalavarda (2026)
Peak Season (August, July, September)
- Revenue averages $3,950 per month
- Occupancy rates average 63.8%
- Daily rates average $168
Shoulder Season
- Revenue averages $1,821 per month
- Occupancy maintains around 38.8%
- Daily rates hold near $142
Low Season (January, February, December)
- Revenue drops to average $716 per month
- Occupancy decreases to average 27.9%
- Daily rates adjust to average $137
Seasonality Insights for Kalavarda
- The Airbnb seasonality in Kalavarda shows highly seasonal trends requiring careful strategy. While the sections above show seasonal averages, it's also insightful to look at the extremes:
- During the high season, the absolute peak month showcases Kalavarda's highest earning potential, with monthly revenues capable of climbing to $4,530, occupancy reaching a high of 71.0%, and ADRs peaking at $178.
- Conversely, the slowest single month of the year, typically falling within the low season, marks the market's lowest point. In this month, revenue might dip to $293, occupancy could drop to 16.1%, and ADRs may adjust down to $125.
- Understanding both the seasonal averages and these monthly peaks and troughs in revenue, occupancy, and ADR is crucial for maximizing your Airbnb profit potential in Kalavarda.
Seasonal Strategies for Maximizing Profit
- Peak Season: Maximize revenue through premium pricing and potentially longer minimum stays. Ensure high availability.
- Low Season: Offer competitive pricing, special promotions (e.g., extended stay discounts), and flexible cancellation policies. Target off-season travelers like remote workers or budget-conscious guests.
- Shoulder Seasons: Implement dynamic pricing that balances peak and low rates. Target weekend travelers or specific events. Offer slightly more flexible terms than peak season.
- Regularly analyze your own performance against these Kalavarda seasonality benchmarks and adjust your pricing and availability strategy accordingly.
Best Areas for Airbnb Investment in Kalavarda (2026)
Exploring the top neighborhoods for short-term rentals in Kalavarda? This section highlights key areas, outlining why they are attractive for hosts and guests, along with notable local attractions. Consider these locations based on your target guest profile and investment strategy.
| Neighborhood / Area | Why Host Here? (Target Guests & Appeal) | Key Attractions & Landmarks |
|---|---|---|
| Kalavarda Village | A picturesque village in Rhodes known for its traditional ambiance, Kalavarda offers a peaceful retreat with beautiful landscapes and proximity to historical sites. | Ancient Kamiros, Kalavarda Beach, Local tavernas and shops, Scenic hiking trails, Church of the Assumption |
| The Ancient City of Kamiros | A UNESCO World Heritage site, this ancient city attracts history buffs and tourists interested in ancient Greek culture, making it ideal for Airbnb hosting. | Archaeological Site of Kamiros, Stunning views of the Aegean Sea, Nearby beaches, Ancient ruins and architecture |
| Lardos | A charming village close to Kalavarda, known for its vibrant atmosphere and local experiences. It attracts families and couples looking for a relaxed vacation. | Lardos Beach, Traditional Greek architecture, Local festivals, Restaurants serving traditional cuisine |
| Pefkos | A popular beach resort area, Pefkos offers a good mix of relaxation and entertainment, appealing to tourists seeking sun, sea, and nightlife. | Pefkos Beach, Lively bars and clubs, Water sports activities, Proximity to Lindos |
| Lindos | Famous for its stunning acropolis and beaches, Lindos attracts many visitors throughout the year, making it a prime spot for Airbnb accommodations. | Lindos Acropolis, St. Paul’s Bay, Lindos' traditional houses, Vibrant nightlife |
| Rhodes Town | As the capital of the island, Rhodes Town is a bustling hub of activity, history, and culture, making it a top choice for travelers. | The Old Town of Rhodes, Palace of the Grand Master, Rhodes Aquarium, Local shops and markets |
| Butterfly Valley (Petaloudes) | A unique natural habitat that attracts visitors seeking tranquility and nature, ideal for eco-tourism focused Airbnb options. | Butterfly Valley Nature Park, Walking trails, Picnic areas, Scenic views and photography spots |
| Fanes Beach | Known for its long stretches of sandy beaches and clear blue waters, Fanes offers a relaxing alternative to busier tourist areas. | Fanes Beach, Water sports, Beach bars and restaurants, Nearby vineyards |
Understanding Airbnb License Requirements & STR Laws in Kalavarda (2026)
Yes, Kalavarda, Aegean, Greece enforces high STR regulations. Obtaining a license and ensuring compliance is almost certainly required according to current 2026 STR laws. Always verify the latest short term rental regulations and Airbnb license requirements directly with local government authorities for Kalavarda to ensure full compliance before hosting.
(Source: AirROI data, 2026, based on 81% licensed listings)
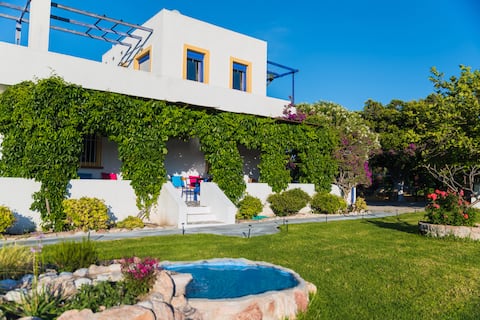
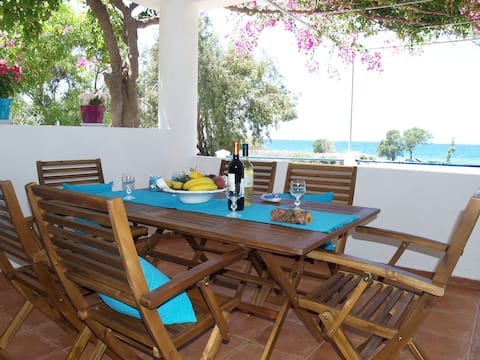
Top Performing Airbnb Properties in Kalavarda (2026)
Benchmark your potential! Explore examples of top-performing Airbnb properties in Kalavardabased on Trailing Twelve Month (TTM) revenue. Analyze their characteristics, revenue, occupancy rate, and ADR to understand what drives success in this market.
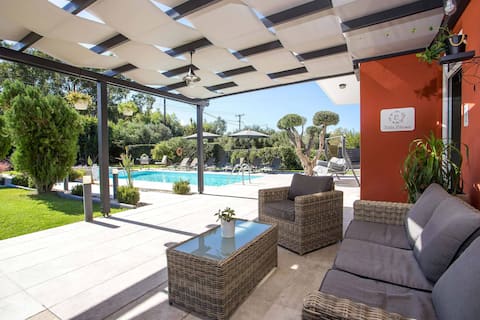
Villa Eleonas with pool, stylish and homely
Entire Place • 4 bedrooms

Beautiful villa with pool, 400m from the beach
Entire Place • 4 bedrooms
Villa Marqua
Entire Place • 3 bedrooms
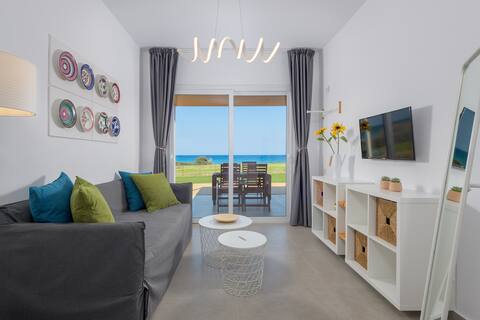
Ammos Apartment
Entire Place • 1 bedroom
MAGICAL SUNSET HOUSE BEACH FRONT
Entire Place • 2 bedrooms
Rizes Traditional House
Entire Place • 2 bedrooms
Note: Performance varies based on location, size, amenities, seasonality, and management quality. Data reflects the past 12 months.
Top Performing Airbnb Hosts in Kalavarda (2026)
Learn from the best! This table showcases top-performing Airbnb hosts in Kalavarda based on the number of properties managed and estimated total revenue over the past year. Analyze their scale and performance metrics.
| Host Name | Properties | Grossing Revenue | Stay Reviews | Avg Rating |
|---|---|---|---|---|
| Aleka | 1 | $58,961 | 29 | 5.00/5.0 |
| Emmanuel | 1 | $48,812 | 13 | 5.00/5.0 |
| Marios | 1 | $36,248 | 20 | 5.00/5.0 |
| Nikitas | 1 | $28,956 | 40 | 4.88/5.0 |
| Tsampika | 1 | $28,527 | 22 | 4.95/5.0 |
| Βαγγέλης | 1 | $20,557 | 6 | 4.50/5.0 |
| Euthaleia | 1 | $19,367 | 17 | 4.94/5.0 |
| Aikaterini | 2 | $19,291 | 59 | 5.00/5.0 |
| Χρήστος | 1 | $11,912 | 1 | Not Rated |
| Vasso | 1 | $11,427 | 19 | 4.95/5.0 |
Analyzing the strategies of top hosts, such as their property selection, pricing, and guest communication, can offer valuable lessons for optimizing your own Airbnb operations in Kalavarda.
Dive Deeper: Advanced Kalavarda STR Market Data (2026)
Ready to unlock more insights? AirROI provides access to advanced metrics and comprehensive Airbnb data for Kalavarda. Explore detailed analytics beyond this report to refine your investment strategy, optimize pricing, and maximize your vacation rental profits.
Explore Advanced MetricsKalavarda Short-Term Rental Market Composition (2026): Property & Room Types
Room Type Distribution
Property Type Distribution
Market Composition Insights for Kalavarda
- The Kalavarda Airbnb market composition is heavily skewed towards Entire Home/Apt listings, which make up 85.7% of the 21 active rentals. This indicates strong guest preference for privacy and space.
- Looking at the property type distribution in Kalavarda, House properties are the most common (66.7%), reflecting the local real estate landscape.
- Houses represent a significant 66.7% portion, catering likely to families or larger groups.
- Smaller segments like others (combined 4.8%) offer potential for unique stay experiences.
Kalavarda Airbnb Room Capacity Analysis (2026): Bedroom Distribution
Distribution of Listings by Number of Bedrooms
Room Capacity Insights for Kalavarda
- The dominant room capacity in Kalavarda is 2 bedrooms listings, making up 47.6% of the market. This suggests a strong demand for properties suitable for couples or solo travelers.
- Together, 2 bedrooms and 1 bedroom properties represent 66.6% of the active Airbnb listings in Kalavarda, indicating a high concentration in these sizes.
- A significant 23.8% of listings offer 3+ bedrooms, catering to larger groups and families seeking more space in Kalavarda.
Kalavarda Vacation Rental Guest Capacity Trends (2026)
Distribution of Listings by Guest Capacity
Guest Capacity Insights for Kalavarda
- The most common guest capacity trend in Kalavarda vacation rentals is listings accommodating 6 guests (33.3%). This suggests the primary traveler segment is likely larger groups.
- Properties designed for 6 guests and 4 guests dominate the Kalavarda STR market, accounting for 66.6% of listings.
- 47.6% of properties accommodate 6+ guests, serving the market segment for larger families or group travel in Kalavarda.
- On average, properties in Kalavarda are equipped to host 4.5 guests.
Kalavarda Airbnb Booking Patterns (2026): Available vs. Booked Days
Available Days Distribution
Booked Days Distribution
Booking Pattern Insights for Kalavarda
- The most common availability pattern in Kalavarda falls within the 271-366 days range, representing 52.4% of listings. This suggests many properties have significant open periods on their calendars.
- Approximately 85.7% of listings show high availability (181+ days open annually), indicating potential for increased bookings or specific owner usage patterns.
- For booked days, the 91-180 days range is most frequent in Kalavarda (38.1%), reflecting common guest stay durations or potential owner blocking patterns.
- A notable 14.3% of properties secure long booking periods (181+ days booked per year), highlighting successful long-term rental strategies or significant owner usage.
Kalavarda Airbnb Minimum Stay Requirements Analysis
Distribution of Listings by Minimum Night Requirement
1 Night
1 listings
4.8% of total
2 Nights
2 listings
9.5% of total
3 Nights
6 listings
28.6% of total
4-6 Nights
6 listings
28.6% of total
30+ Nights
6 listings
28.6% of total
Key Insights
- The most prevalent minimum stay requirement in Kalavarda is 3 Nights, adopted by 28.6% of listings. This highlights the market's preference for longer commitments.
- Very short stays (1-2 nights) are less common (14.3%), suggesting hosts prefer slightly longer bookings to optimize turnover.
- A significant segment (28.6%) caters to monthly stays (30+ nights) in Kalavarda, pointing to opportunities in the extended-stay market.
Recommendations
- Align with the market by considering a 3 Nights minimum stay, as 28.6% of Kalavarda hosts use this setting.
- If feasible, allowing 1-night stays, especially midweek or during low season, could capture last-minute bookings, as only 4.8% currently do.
- Explore offering discounts for stays of 30+ nights to attract the 28.6% of the market seeking extended stays.
- Adjust minimum nights based on seasonality – potentially shorter during low season and longer during peak demand periods in Kalavarda.
Kalavarda Airbnb Cancellation Policy Trends Analysis (2026)
Flexible
2 listings
9.5% of total
Moderate
4 listings
19% of total
Firm
11 listings
52.4% of total
Strict
4 listings
19% of total
Cancellation Policy Insights for Kalavarda
- The prevailing Airbnb cancellation policy trend in Kalavarda is Firm, used by 52.4% of listings.
- A majority (71.4%) of hosts in Kalavarda utilize Firm or Strict policies, indicating a market where hosts prioritize booking security.
Recommendations for Hosts
- Consider adopting a Firm policy to align with the 52.4% market standard in Kalavarda.
- Regularly review your cancellation policy against competitors and market demand shifts in Kalavarda.
Kalavarda STR Booking Lead Time Analysis (2026)
Average Booking Lead Time by Month
Booking Lead Time Insights for Kalavarda
- The overall average booking lead time for vacation rentals in Kalavarda is 87 days.
- Guests book furthest in advance for stays during December (average 137 days), likely coinciding with peak travel demand or local events.
- The shortest booking windows occur for stays in January (average 0 days), indicating more last-minute travel plans during this time.
- Seasonally, Summer (112 days avg.) sees the longest lead times, while Winter (66 days avg.) has the shortest, reflecting typical travel planning cycles.
Recommendations for Hosts
- Use the overall average lead time (87 days) as a baseline for your pricing and availability strategy in Kalavarda.
- For December stays, consider implementing length-of-stay discounts or slightly higher rates for bookings made less than 137 days out to capitalize on advance planning.
- During January, focus on last-minute booking availability and promotions, as guests book with very short notice (0 days avg.).
- Target marketing efforts for the Summer season well in advance (at least 112 days) to capture early planners.
- Monitor your own booking lead times against these Kalavarda averages to identify opportunities for dynamic pricing adjustments.
Popular & Essential Airbnb Amenities in Kalavarda (2026)
Amenity Prevalence
Amenity Insights for Kalavarda
- Essential amenities in Kalavarda that guests expect include: Wifi, Air conditioning, Kitchen, Free parking on premises, Cooking basics, Dishes and silverware, Hangers, Refrigerator, Coffee maker. Lacking these (any) could significantly impact bookings.
- Popular amenities like Essentials are common but not universal. Offering these can provide a competitive edge.
Recommendations for Hosts
- Ensure your listing includes all essential amenities for Kalavarda: Wifi, Air conditioning, Kitchen, Free parking on premises, Cooking basics, Dishes and silverware, Hangers, Refrigerator, Coffee maker.
- Prioritize adding missing essentials: Cooking basics, Dishes and silverware, Hangers, Refrigerator, Coffee maker.
- Consider adding popular differentiators like Essentials to increase appeal.
- Highlight unique or less common amenities you offer (e.g., hot tub, dedicated workspace, EV charger) in your listing description and photos.
- Regularly check competitor amenities in Kalavarda to stay competitive.
Kalavarda Airbnb Guest Demographics & Profile Analysis (2026)
Guest Profile Summary for Kalavarda
- The typical guest profile for Airbnb in Kalavarda consists of predominantly international visitors (98%), with top international origins including United Kingdom, typically belonging to the Post-2000s (Gen Z/Alpha) group (50%), primarily speaking English or German.
- Domestic travelers account for 2.5% of guests.
- Key international markets include Germany (40%) and United Kingdom (25%).
- Top languages spoken are English (44.2%) followed by German (27.9%).
- A significant demographic segment is the Post-2000s (Gen Z/Alpha) group, representing 50% of guests.
Recommendations for Hosts
- Focus marketing internationally, particularly towards travelers from United Kingdom.
- Tailor amenities and listing descriptions to appeal to the dominant Post-2000s (Gen Z/Alpha) demographic (e.g., highlight fast WiFi, smart home features, local guides).
- Highlight unique local experiences or amenities relevant to the primary guest profile.
- Consider seasonal promotions aligned with peak travel times for key origin markets.
Nearby Short-Term Rental Market Comparison
How does the Kalavarda Airbnb market stack up against its neighbors? Compare key performance metrics like average monthly revenue, ADR, and occupancy rates in surrounding areas to understand the broader regional STR landscape.
| Market | Active Properties | Monthly Revenue | Daily Rate | Avg. Occupancy |
|---|---|---|---|---|
| Μάσαρη | 23 | $2,949 | $260.24 | 50% |
| Kalathos | 53 | $2,908 | $304.93 | 50% |
| Municipality of Rhodes | 440 | $2,455 | $280.73 | 46% |
| Lachania | 50 | $2,448 | $347.79 | 46% |
| Lagoudi | 11 | $2,368 | $213.89 | 48% |
| Μαριτσά | 12 | $2,358 | $252.72 | 45% |
| Fanes | 24 | $2,255 | $252.48 | 41% |
| Lardos | 25 | $2,180 | $274.26 | 45% |
| Kolymbia | 134 | $2,156 | $236.46 | 48% |
| Lindos | 272 | $2,147 | $276.11 | 47% |