Ia Municipal Unit Airbnb Market Analysis 2026: Short Term Rental Data & Vacation Rental Statistics in Aegean, Greece
Is Airbnb profitable in Ia Municipal Unit in 2026? Explore comprehensive Airbnb analytics for Ia Municipal Unit, Aegean, Greece to uncover income potential. This 2026 STR market report for Ia Municipal Unit, based on AirROI data from February 2025 to January 2026, reveals key trends in the market of 722 active listings.
Whether you're considering an Airbnb investment in Ia Municipal Unit, optimizing your existing vacation rental, or exploring rental arbitrage opportunities, understanding the Ia Municipal Unit Airbnb data is crucial. Navigating the high regulation landscape is key to maximizing your short term rental income potential. Let's dive into the specifics.
Key Ia Municipal Unit Airbnb Performance Metrics Overview
Monthly Airbnb Revenue Variations & Income Potential in Ia Municipal Unit (2026)
Understanding the monthly revenue variations for Airbnb listings in Ia Municipal Unit is key to maximizing your short term rental income potential. Seasonality significantly impacts earnings. Our analysis, based on data from the past 12 months, shows that the peak revenue month for STRs in Ia Municipal Unit is typically July, while January often presents the lowest earnings, highlighting opportunities for strategic pricing adjustments during shoulder and low seasons. Explore the typical Airbnb income in Ia Municipal Unit across different performance tiers:
- Best-in-class properties (Top 10%) achieve $12,086+ monthly, often utilizing dynamic pricing and superior guest experiences.
- Strong performing properties (Top 25%) earn $7,214 or more, indicating effective management and desirable locations/amenities.
- Typical properties (Median) generate around $3,588 per month, representing the average market performance.
- Entry-level properties (Bottom 25%) see earnings around $1,655, often with potential for optimization.
Average Monthly Airbnb Earnings Trend in Ia Municipal Unit
Ia Municipal Unit Airbnb Occupancy Rate Trends (2026)
Maximize your bookings by understanding the Ia Municipal Unit STR occupancy trends. Seasonal demand shifts significantly influence how often properties are booked. Typically, Augustsees the highest demand (peak season occupancy), while January experiences the lowest (low season). Effective strategies, like adjusting minimum stays or offering promotions, can boost occupancy during slower periods. Here's how different property tiers perform in Ia Municipal Unit:
- Best-in-class properties (Top 10%) achieve 80%+ occupancy, indicating high desirability and potentially optimized availability.
- Strong performing properties (Top 25%) maintain 63% or higher occupancy, suggesting good market fit and guest satisfaction.
- Typical properties (Median) have an occupancy rate around 39%.
- Entry-level properties (Bottom 25%) average 19% occupancy, potentially facing higher vacancy.
Average Monthly Occupancy Rate Trend in Ia Municipal Unit
Average Daily Rate (ADR) Airbnb Trends in Ia Municipal Unit (2026)
Effective short term rental pricing strategy in Ia Municipal Unit involves understanding monthly ADR fluctuations. The Average Daily Rate (ADR) for Airbnb in Ia Municipal Unit typically peaks in June and dips lowest during November. Leveraging Airbnb dynamic pricing tools or strategies based on this seasonality can significantly boost revenue. Here's a look at the typical nightly rates achieved:
- Best-in-class properties (Top 10%) command rates of $748+ per night, often due to premium features or locations.
- Strong performing properties (Top 25%) achieve nightly rates of $492 or more.
- Typical properties (Median) charge around $315 per night.
- Entry-level properties (Bottom 25%) earn around $198 per night.
Average Daily Rate (ADR) Trend by Month in Ia Municipal Unit
Get Live Ia Municipal Unit Market Intelligence 👇

Explore Real-time Analytics
Airbnb Seasonality Analysis & Trends in Ia Municipal Unit (2026)
Peak Season (July, August, June)
- Revenue averages $7,815 per month
- Occupancy rates average 52.0%
- Daily rates average $465
Shoulder Season
- Revenue averages $5,227 per month
- Occupancy maintains around 42.2%
- Daily rates hold near $386
Low Season (January, November, December)
- Revenue drops to average $3,041 per month
- Occupancy decreases to average 31.8%
- Daily rates adjust to average $342
Seasonality Insights for Ia Municipal Unit
- The Airbnb seasonality in Ia Municipal Unit shows highly seasonal trends requiring careful strategy. While the sections above show seasonal averages, it's also insightful to look at the extremes:
- During the high season, the absolute peak month showcases Ia Municipal Unit's highest earning potential, with monthly revenues capable of climbing to $8,078, occupancy reaching a high of 55.1%, and ADRs peaking at $473.
- Conversely, the slowest single month of the year, typically falling within the low season, marks the market's lowest point. In this month, revenue might dip to $2,076, occupancy could drop to 23.5%, and ADRs may adjust down to $321.
- Understanding both the seasonal averages and these monthly peaks and troughs in revenue, occupancy, and ADR is crucial for maximizing your Airbnb profit potential in Ia Municipal Unit.
Seasonal Strategies for Maximizing Profit
- Peak Season: Maximize revenue through premium pricing and potentially longer minimum stays. Ensure high availability.
- Low Season: Offer competitive pricing, special promotions (e.g., extended stay discounts), and flexible cancellation policies. Target off-season travelers like remote workers or budget-conscious guests.
- Shoulder Seasons: Implement dynamic pricing that balances peak and low rates. Target weekend travelers or specific events. Offer slightly more flexible terms than peak season.
- Regularly analyze your own performance against these Ia Municipal Unit seasonality benchmarks and adjust your pricing and availability strategy accordingly.
Best Areas for Airbnb Investment in Ia Municipal Unit (2026)
Exploring the top neighborhoods for short-term rentals in Ia Municipal Unit? This section highlights key areas, outlining why they are attractive for hosts and guests, along with notable local attractions. Consider these locations based on your target guest profile and investment strategy.
| Neighborhood / Area | Why Host Here? (Target Guests & Appeal) | Key Attractions & Landmarks |
|---|---|---|
| Ia Village | Famous for its breathtaking sunsets and stunning views of the caldera. This picturesque village is a popular destination for tourists seeking authentic Greek architecture, fine dining, and unique shopping. | Sunset in Oia, Castle of Oia, Amoudi Bay, Oia's Maritime Museum, Panagia Platsani Church |
| Fira | The capital of Santorini, known for its vibrant nightlife and dramatic cliffs. A hub for transportation, dining, and spectacular views, ideal for attracting tourists year-round. | Fira's main square, Cable car to the port, Archaeological Museum of Thera, Agios Nikolaos Monastery, Wine Museum Koutsogiannopoulos |
| Oia Castle | A historic castle offering the best panoramic views of the island, especially during sunset. Attracts visitors for its romantic ambiance and historical significance. | Oia Castle sunset views, Traditional Cycladic architecture, Cafes and shops, Hiking trails to nearby beaches |
| Pyrgos | A less touristy village with a rich history and local charm. Known for its traditional Cycladic architecture and stunning views from the Pyrgos Castle. | Pyrgos Castle, Wine tasting at local wineries, Ancient Thera, Koutsoyannopoulos Wine Museum, Local tavernas and cafes |
| Akrotiri | Famous for its archaeological site of the ancient Minoan city and beautiful red and black sand beaches. It attracts history enthusiasts and beachgoers alike. | Akrotiri Archaeological Site, Red Beach, White Beach, Santorini Light House, Akrotiri's traditional village |
| Kamari | A popular beach resort known for its black sand beach and active nightlife. Great for families and beach lovers wanting a lively atmosphere. | Kamari Beach, Ancient Thera ruins, Beach bars and restaurants, Water sports activities, Kamari Cinema |
| Vlychada | Known for its unique lunar landscapes and quiet beaches. Ideal for tourists seeking tranquility away from the crowded areas. | Vlychada Beach, Lava formations, Vlychada Marina, Local seafood restaurants, Beach bars |
| Megalochori | A traditional village with picturesque landscapes and local wineries. Attracts visitors who want to experience authentic village life and local wine culture. | Megalochori's wineries, Boutari Winery, Ancient Thera, Charming village streets, Local festivals |
Understanding Airbnb License Requirements & STR Laws in Ia Municipal Unit (2026)
Yes, Ia Municipal Unit, Aegean, Greece enforces high STR regulations. Obtaining a license and ensuring compliance is almost certainly required according to current 2026 STR laws. Always verify the latest short term rental regulations and Airbnb license requirements directly with local government authorities for Ia Municipal Unit to ensure full compliance before hosting.
(Source: AirROI data, 2026, based on 96% licensed listings)
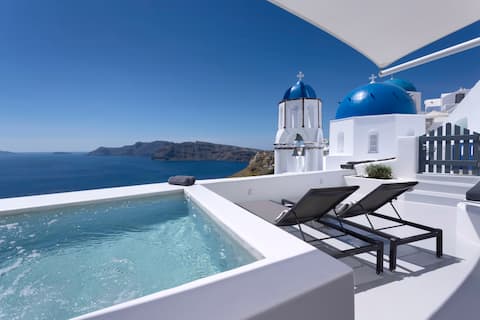
Top Performing Airbnb Properties in Ia Municipal Unit (2026)
Benchmark your potential! Explore examples of top-performing Airbnb properties in Ia Municipal Unitbased on Trailing Twelve Month (TTM) revenue. Analyze their characteristics, revenue, occupancy rate, and ADR to understand what drives success in this market.
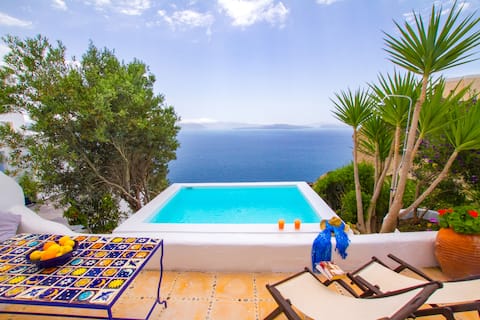
Grand 3 Bedroom Villa with Plunge Pool & Sea View
Entire Place • 3 bedrooms

Cave Villa With Heated Plunge Pool & Caldera View
Entire Place • 2 bedrooms
Bluedome Cavehouse by Otium Villas Santorini
Entire Place • 2 bedrooms

Villa Santorini 520 with private swimming pool
Entire Place • 3 bedrooms

By the Mill, Caldera, Oia
Entire Place • 3 bedrooms

Santo blue horizon -blue domes-outdoor jacuzzi
Entire Place • 3 bedrooms
Note: Performance varies based on location, size, amenities, seasonality, and management quality. Data reflects the past 12 months.
Top Performing Airbnb Hosts in Ia Municipal Unit (2026)
Learn from the best! This table showcases top-performing Airbnb hosts in Ia Municipal Unit based on the number of properties managed and estimated total revenue over the past year. Analyze their scale and performance metrics.
| Host Name | Properties | Grossing Revenue | Stay Reviews | Avg Rating |
|---|---|---|---|---|
| Maria | 31 | $1,580,485 | 10742 | 4.87/5.0 |
| Mary | 8 | $1,332,563 | 1159 | 4.97/5.0 |
| Fanis&Tina | 11 | $989,221 | 1653 | 4.84/5.0 |
| Nicoletta Christina Alexandra | 9 | $836,100 | 2657 | 4.92/5.0 |
| Otium Villas Santorini | 5 | $829,973 | 1074 | 4.93/5.0 |
| Panos | 7 | $787,173 | 1551 | 4.94/5.0 |
| Myblue | 8 | $762,705 | 1511 | 4.92/5.0 |
| Katerina | 3 | $727,890 | 314 | 4.93/5.0 |
| Diamond | 6 | $710,196 | 350 | 4.86/5.0 |
| Evelyn | 9 | $678,492 | 447 | 4.80/5.0 |
Analyzing the strategies of top hosts, such as their property selection, pricing, and guest communication, can offer valuable lessons for optimizing your own Airbnb operations in Ia Municipal Unit.
Dive Deeper: Advanced Ia Municipal Unit STR Market Data (2026)
Ready to unlock more insights? AirROI provides access to advanced metrics and comprehensive Airbnb data for Ia Municipal Unit. Explore detailed analytics beyond this report to refine your investment strategy, optimize pricing, and maximize your vacation rental profits.
Explore Advanced MetricsIa Municipal Unit Short-Term Rental Market Composition (2026): Property & Room Types
Room Type Distribution
Property Type Distribution
Market Composition Insights for Ia Municipal Unit
- The Ia Municipal Unit Airbnb market composition is heavily skewed towards Entire Home/Apt listings, which make up 87.4% of the 722 active rentals. This indicates strong guest preference for privacy and space.
- Looking at the property type distribution in Ia Municipal Unit, House properties are the most common (51.8%), reflecting the local real estate landscape.
- Houses represent a significant 51.8% portion, catering likely to families or larger groups.
- The presence of 7.6% Hotel/Boutique listings indicates integration with traditional hospitality.
- Smaller segments like others (combined 2.8%) offer potential for unique stay experiences.
Ia Municipal Unit Airbnb Room Capacity Analysis (2026): Bedroom Distribution
Distribution of Listings by Number of Bedrooms
Room Capacity Insights for Ia Municipal Unit
- The dominant room capacity in Ia Municipal Unit is 1 bedroom listings, making up 58.6% of the market. This suggests a strong demand for properties suitable for couples or solo travelers.
- Together, 1 bedroom and 2 bedrooms properties represent 82.3% of the active Airbnb listings in Ia Municipal Unit, indicating a high concentration in these sizes.
- With over half the market (58.6%) consisting of studios or 1-bedroom units, Ia Municipal Unit is particularly well-suited for individuals or couples.
Ia Municipal Unit Vacation Rental Guest Capacity Trends (2026)
Distribution of Listings by Guest Capacity
Guest Capacity Insights for Ia Municipal Unit
- The most common guest capacity trend in Ia Municipal Unit vacation rentals is listings accommodating 2 guests (31.4%). This suggests the primary traveler segment is likely couples or solo travelers.
- Properties designed for 2 guests and 4 guests dominate the Ia Municipal Unit STR market, accounting for 51.5% of listings.
- 17.1% of properties accommodate 6+ guests, serving the market segment for larger families or group travel in Ia Municipal Unit.
- On average, properties in Ia Municipal Unit are equipped to host 3.6 guests.
Ia Municipal Unit Airbnb Booking Patterns (2026): Available vs. Booked Days
Available Days Distribution
Booked Days Distribution
Booking Pattern Insights for Ia Municipal Unit
- The most common availability pattern in Ia Municipal Unit falls within the 271-366 days range, representing 48.2% of listings. This suggests many properties have significant open periods on their calendars.
- Approximately 82.0% of listings show high availability (181+ days open annually), indicating potential for increased bookings or specific owner usage patterns.
- For booked days, the 91-180 days range is most frequent in Ia Municipal Unit (34.2%), reflecting common guest stay durations or potential owner blocking patterns.
- A notable 19.1% of properties secure long booking periods (181+ days booked per year), highlighting successful long-term rental strategies or significant owner usage.
Ia Municipal Unit Airbnb Minimum Stay Requirements Analysis
Distribution of Listings by Minimum Night Requirement
1 Night
231 listings
32% of total
2 Nights
116 listings
16.1% of total
3 Nights
14 listings
1.9% of total
4-6 Nights
1 listings
0.1% of total
30+ Nights
360 listings
49.9% of total
Key Insights
- The most prevalent minimum stay requirement in Ia Municipal Unit is 30+ Nights, adopted by 49.9% of listings. This highlights the market's preference for longer commitments.
- A significant segment (49.9%) caters to monthly stays (30+ nights) in Ia Municipal Unit, pointing to opportunities in the extended-stay market.
Recommendations
- Align with the market by considering a 30+ Nights minimum stay, as 49.9% of Ia Municipal Unit hosts use this setting.
- Explore offering discounts for stays of 30+ nights to attract the 49.9% of the market seeking extended stays.
- Adjust minimum nights based on seasonality – potentially shorter during low season and longer during peak demand periods in Ia Municipal Unit.
Ia Municipal Unit Airbnb Cancellation Policy Trends Analysis (2026)
Limited
25 listings
3.5% of total
Super Strict 30 Days
47 listings
6.5% of total
Super Strict 60 Days
12 listings
1.7% of total
Flexible
31 listings
4.3% of total
Moderate
79 listings
10.9% of total
Firm
385 listings
53.3% of total
Strict
143 listings
19.8% of total
Cancellation Policy Insights for Ia Municipal Unit
- The prevailing Airbnb cancellation policy trend in Ia Municipal Unit is Firm, used by 53.3% of listings.
- A majority (73.1%) of hosts in Ia Municipal Unit utilize Firm or Strict policies, indicating a market where hosts prioritize booking security.
Recommendations for Hosts
- Consider adopting a Firm policy to align with the 53.3% market standard in Ia Municipal Unit.
- Regularly review your cancellation policy against competitors and market demand shifts in Ia Municipal Unit.
Ia Municipal Unit STR Booking Lead Time Analysis (2026)
Average Booking Lead Time by Month
Booking Lead Time Insights for Ia Municipal Unit
- The overall average booking lead time for vacation rentals in Ia Municipal Unit is 80 days.
- Guests book furthest in advance for stays during February (average 105 days), likely coinciding with peak travel demand or local events.
- The shortest booking windows occur for stays in January (average 58 days), indicating more last-minute travel plans during this time.
- Seasonally, Spring (88 days avg.) sees the longest lead times, while Summer (75 days avg.) has the shortest, reflecting typical travel planning cycles.
Recommendations for Hosts
- Use the overall average lead time (80 days) as a baseline for your pricing and availability strategy in Ia Municipal Unit.
- For February stays, consider implementing length-of-stay discounts or slightly higher rates for bookings made less than 105 days out to capitalize on advance planning.
- Target marketing efforts for the Spring season well in advance (at least 88 days) to capture early planners.
- Monitor your own booking lead times against these Ia Municipal Unit averages to identify opportunities for dynamic pricing adjustments.
Popular & Essential Airbnb Amenities in Ia Municipal Unit (2026)
Amenity Prevalence
Amenity Insights for Ia Municipal Unit
- Essential amenities in Ia Municipal Unit that guests expect include: Wifi, Air conditioning, Hair dryer. Lacking these (any) could significantly impact bookings.
- Popular amenities like Essentials, Shampoo, Hangers are common but not universal. Offering these can provide a competitive edge.
Recommendations for Hosts
- Ensure your listing includes all essential amenities for Ia Municipal Unit: Wifi, Air conditioning, Hair dryer.
- Prioritize adding missing essentials: Air conditioning, Hair dryer.
- Consider adding popular differentiators like Essentials or Shampoo to increase appeal.
- Highlight unique or less common amenities you offer (e.g., hot tub, dedicated workspace, EV charger) in your listing description and photos.
- Regularly check competitor amenities in Ia Municipal Unit to stay competitive.
Ia Municipal Unit Airbnb Guest Demographics & Profile Analysis (2026)
Guest Profile Summary for Ia Municipal Unit
- The typical guest profile for Airbnb in Ia Municipal Unit consists of predominantly international visitors (100%), with top international origins including Canada, typically belonging to the Post-2000s (Gen Z/Alpha) group (50%), primarily speaking English or Spanish.
- Domestic travelers account for 0.5% of guests.
- Key international markets include United States (57.7%) and Canada (8.8%).
- Top languages spoken are English (56.9%) followed by Spanish (13.1%).
- A significant demographic segment is the Post-2000s (Gen Z/Alpha) group, representing 50% of guests.
Recommendations for Hosts
- Focus marketing internationally, particularly towards travelers from Canada.
- Tailor amenities and listing descriptions to appeal to the dominant Post-2000s (Gen Z/Alpha) demographic (e.g., highlight fast WiFi, smart home features, local guides).
- Highlight unique local experiences or amenities relevant to the primary guest profile.
- Consider seasonal promotions aligned with peak travel times for key origin markets.
Nearby Short-Term Rental Market Comparison
How does the Ia Municipal Unit Airbnb market stack up against its neighbors? Compare key performance metrics like average monthly revenue, ADR, and occupancy rates in surrounding areas to understand the broader regional STR landscape.
| Market | Active Properties | Monthly Revenue | Daily Rate | Avg. Occupancy |
|---|---|---|---|---|
| Violi Charaki | 21 | $7,037 | $480.16 | 55% |
| Amnatos | 15 | $5,946 | $730.78 | 48% |
| Skaleta | 57 | $5,258 | $581.34 | 48% |
| Viranepiskopi | 11 | $4,940 | $322.10 | 65% |
| Perama | 27 | $4,927 | $392.67 | 52% |
| Pithari | 22 | $4,920 | $412.56 | 55% |
| Faros Armenistis | 119 | $4,791 | $715.43 | 41% |
| Xiro Chorio | 20 | $4,573 | $393.88 | 51% |
| Nea Magnisia | 22 | $4,332 | $392.45 | 52% |
| Municipality of Milopotamos | 20 | $3,882 | $348.22 | 51% |