Wangels Airbnb Market Analysis 2026: Short Term Rental Data & Vacation Rental Statistics in Schleswig-Holstein, Germany
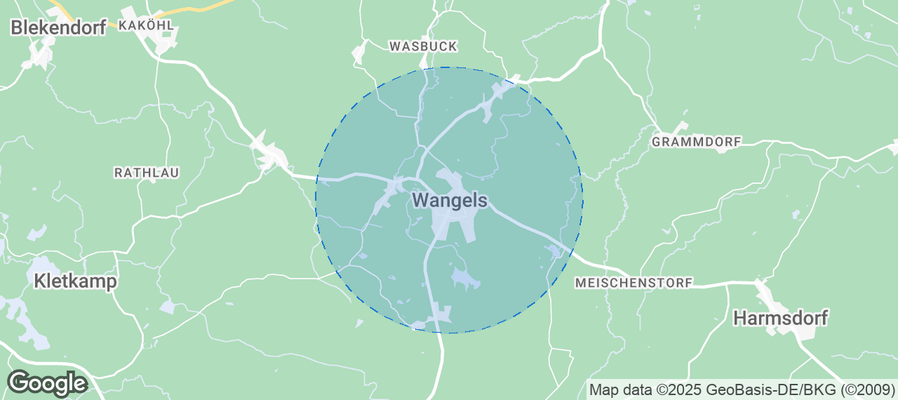
Is Airbnb profitable in Wangels in 2026? Explore comprehensive Airbnb analytics for Wangels, Schleswig-Holstein, Germany to uncover income potential. This 2026 STR market report for Wangels, based on AirROI data from February 2025 to January 2026, reveals key trends in the niche market of 33 active listings.
Whether you're considering an Airbnb investment in Wangels, optimizing your existing vacation rental, or exploring rental arbitrage opportunities, understanding the Wangels Airbnb data is crucial. Leveraging the low regulation environment is key to maximizing your short term rental income potential. Let's dive into the specifics.
Key Wangels Airbnb Performance Metrics Overview
Monthly Airbnb Revenue Variations & Income Potential in Wangels (2026)
Understanding the monthly revenue variations for Airbnb listings in Wangels is key to maximizing your short term rental income potential. Seasonality significantly impacts earnings. Our analysis, based on data from the past 12 months, shows that the peak revenue month for STRs in Wangels is typically August, while January often presents the lowest earnings, highlighting opportunities for strategic pricing adjustments during shoulder and low seasons. Explore the typical Airbnb income in Wangels across different performance tiers:
- Best-in-class properties (Top 10%) achieve $3,084+ monthly, often utilizing dynamic pricing and superior guest experiences.
- Strong performing properties (Top 25%) earn $1,720 or more, indicating effective management and desirable locations/amenities.
- Typical properties (Median) generate around $1,022 per month, representing the average market performance.
- Entry-level properties (Bottom 25%) see earnings around $510, often with potential for optimization.
Average Monthly Airbnb Earnings Trend in Wangels
Wangels Airbnb Occupancy Rate Trends (2026)
Maximize your bookings by understanding the Wangels STR occupancy trends. Seasonal demand shifts significantly influence how often properties are booked. Typically, Augustsees the highest demand (peak season occupancy), while January experiences the lowest (low season). Effective strategies, like adjusting minimum stays or offering promotions, can boost occupancy during slower periods. Here's how different property tiers perform in Wangels:
- Best-in-class properties (Top 10%) achieve 67%+ occupancy, indicating high desirability and potentially optimized availability.
- Strong performing properties (Top 25%) maintain 42% or higher occupancy, suggesting good market fit and guest satisfaction.
- Typical properties (Median) have an occupancy rate around 26%.
- Entry-level properties (Bottom 25%) average 14% occupancy, potentially facing higher vacancy.
Average Monthly Occupancy Rate Trend in Wangels
Average Daily Rate (ADR) Airbnb Trends in Wangels (2026)
Effective short term rental pricing strategy in Wangels involves understanding monthly ADR fluctuations. The Average Daily Rate (ADR) for Airbnb in Wangels typically peaks in May and dips lowest during February. Leveraging Airbnb dynamic pricing tools or strategies based on this seasonality can significantly boost revenue. Here's a look at the typical nightly rates achieved:
- Best-in-class properties (Top 10%) command rates of $261+ per night, often due to premium features or locations.
- Strong performing properties (Top 25%) achieve nightly rates of $182 or more.
- Typical properties (Median) charge around $127 per night.
- Entry-level properties (Bottom 25%) earn around $99 per night.
Average Daily Rate (ADR) Trend by Month in Wangels
Get Live Wangels Market Intelligence 👇
Explore Real-time Analytics
Airbnb Seasonality Analysis & Trends in Wangels (2026)
Peak Season (August, July, April)
- Revenue averages $2,087 per month
- Occupancy rates average 47.6%
- Daily rates average $150
Shoulder Season
- Revenue averages $1,236 per month
- Occupancy maintains around 28.2%
- Daily rates hold near $149
Low Season (January, February, September)
- Revenue drops to average $983 per month
- Occupancy decreases to average 24.9%
- Daily rates adjust to average $145
Seasonality Insights for Wangels
- The Airbnb seasonality in Wangels shows highly seasonal trends requiring careful strategy. While the sections above show seasonal averages, it's also insightful to look at the extremes:
- During the high season, the absolute peak month showcases Wangels's highest earning potential, with monthly revenues capable of climbing to $2,565, occupancy reaching a high of 56.5%, and ADRs peaking at $154.
- Conversely, the slowest single month of the year, typically falling within the low season, marks the market's lowest point. In this month, revenue might dip to $807, occupancy could drop to 20.3%, and ADRs may adjust down to $137.
- Understanding both the seasonal averages and these monthly peaks and troughs in revenue, occupancy, and ADR is crucial for maximizing your Airbnb profit potential in Wangels.
Seasonal Strategies for Maximizing Profit
- Peak Season: Maximize revenue through premium pricing and potentially longer minimum stays. Ensure high availability.
- Low Season: Offer competitive pricing, special promotions (e.g., extended stay discounts), and flexible cancellation policies. Target off-season travelers like remote workers or budget-conscious guests.
- Shoulder Seasons: Implement dynamic pricing that balances peak and low rates. Target weekend travelers or specific events. Offer slightly more flexible terms than peak season.
- Regularly analyze your own performance against these Wangels seasonality benchmarks and adjust your pricing and availability strategy accordingly.
Best Areas for Airbnb Investment in Wangels (2026)
Exploring the top neighborhoods for short-term rentals in Wangels? This section highlights key areas, outlining why they are attractive for hosts and guests, along with notable local attractions. Consider these locations based on your target guest profile and investment strategy.
| Neighborhood / Area | Why Host Here? (Target Guests & Appeal) | Key Attractions & Landmarks |
|---|---|---|
| Wangels Beach | A beautiful beach area, perfect for families and visitors looking to enjoy the sun and sea. Its proximity to the Baltic Sea makes it a popular choice for summer vacations. | Seabridge Grömitz, Kiel Canal |
| Sierksdorf | A charming seaside town known for its welcoming atmosphere and family-oriented services, including amusement parks and water sports activities. | Hansapark, Sierksdorf Beach, Piraten Golf Sierksdorf, Schnüsch |
| Grömitz | A well-known resort town with a lively promenade, numerous restaurants, and plenty of recreational activities, making it ideal for vacation rentals. | Grömitzer Hafen, Grömitz Pier, Ostsee-Seebrücke, Lighthouse Grömitz, Wellenbad Grömitz |
| Pelzerhaken | A quiet area popular among kite surfers and wind surfers, ideal for those looking for water sports and a relaxed environment. | Pelzerhaken Beach, Water sports activities, Kitesurfing School, Beach cafes |
| Neustadt in Holstein | A historic town with a charming harbor, offering cultural experiences and local cuisine, appealing to tourists looking for a mix of relaxation and activities. | Neustadt Harbor, Old Town, Museum of Local History, Bunker Museum |
| Kellenhusen | A quaint coastal village known for its long beach and wooden piers, perfect for peaceful getaways by the Baltic Sea. | Kellenhusen Beach, Wooden Pier |
| Hohwacht | Less crowded than some of the other beach areas, Hohwacht offers a serene environment for relaxation and nature walks along the Baltic Sea. | Hohwacht Beach, Hohwacht Castle, Walking Trails, Seaside Promenade |
| Oldenburg in Holstein | Centrally located with access to various attractions in the region. Great for visitors wanting to explore both the countryside and coastal towns. | Oldenburg Castle, Historical Museum, Nearby beaches, Natural reserves |
Understanding Airbnb License Requirements & STR Laws in Wangels (2026)
While Wangels, Schleswig-Holstein, Germany currently shows low STR regulations, specific Airbnb license requirements might still exist or change. Always verify the latest short term rental regulations and Airbnb license requirements directly with local government authorities for Wangels to ensure full compliance before hosting.
(Source: AirROI data, 2026, finding no licensed listings among those analyzed)
Top Performing Airbnb Properties in Wangels (2026)
Benchmark your potential! Explore examples of top-performing Airbnb properties in Wangelsbased on Trailing Twelve Month (TTM) revenue. Analyze their characteristics, revenue, occupancy rate, and ADR to understand what drives success in this market.
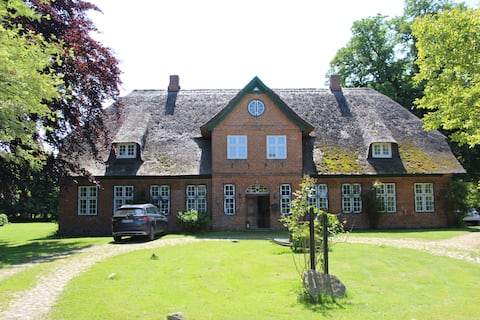
Perfect for family vacations near the Baltic Sea!
Entire Place • 4 bedrooms
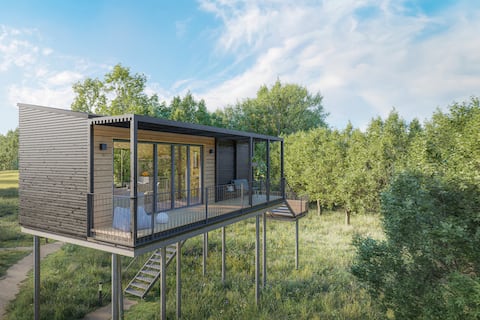
Tree house lodge in the Baltic Sea Tree house hotel, spa incl.
Entire Place • 1 bedroom
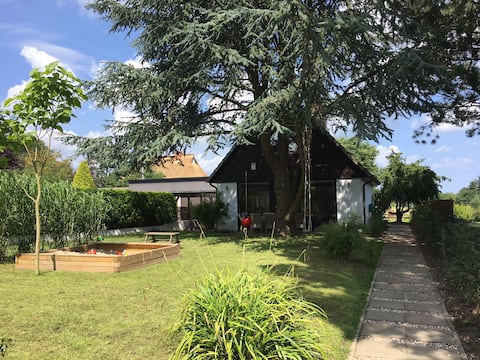
Holiday home Ostsee-Lust
Entire Place • 3 bedrooms

Apartments in Weissenhäuser Strand amusement park
Entire Place • 1 bedroom
Holiday and Leisure Park Weissenhäuser Strand
Entire Place • 1 bedroom
Apartments in the Weissenhäuser Strand amusement park
Entire Place • N/A
Note: Performance varies based on location, size, amenities, seasonality, and management quality. Data reflects the past 12 months.
Top Performing Airbnb Hosts in Wangels (2026)
Learn from the best! This table showcases top-performing Airbnb hosts in Wangels based on the number of properties managed and estimated total revenue over the past year. Analyze their scale and performance metrics.
| Host Name | Properties | Grossing Revenue | Stay Reviews | Avg Rating |
|---|---|---|---|---|
| Ritesh | 6 | $74,073 | 53 | 4.09/5.0 |
| Ambra - Belvilla | 2 | $36,456 | 4 | 4.67/5.0 |
| Franziska | 1 | $27,547 | 9 | 5.00/5.0 |
| Oliver | 1 | $25,600 | 1 | Not Rated |
| Andreas | 1 | $24,445 | 9 | 5.00/5.0 |
| Jochen | 1 | $17,359 | 45 | 4.93/5.0 |
| Ina | 2 | $16,835 | 143 | 4.87/5.0 |
| Sylvia | 4 | $16,465 | 118 | 4.62/5.0 |
| Rosica | 1 | $14,999 | 112 | 4.89/5.0 |
| Deike | 2 | $13,462 | 99 | 5.00/5.0 |
Analyzing the strategies of top hosts, such as their property selection, pricing, and guest communication, can offer valuable lessons for optimizing your own Airbnb operations in Wangels.
Dive Deeper: Advanced Wangels STR Market Data (2026)
Ready to unlock more insights? AirROI provides access to advanced metrics and comprehensive Airbnb data for Wangels. Explore detailed analytics beyond this report to refine your investment strategy, optimize pricing, and maximize your vacation rental profits.
Explore Advanced MetricsWangels Short-Term Rental Market Composition (2026): Property & Room Types
Room Type Distribution
Property Type Distribution
Market Composition Insights for Wangels
- The Wangels Airbnb market composition is heavily skewed towards Entire Home/Apt listings, which make up 93.9% of the 33 active rentals. This indicates strong guest preference for privacy and space.
- Looking at the property type distribution in Wangels, Apartment/Condo properties are the most common (54.5%), reflecting the local real estate landscape.
- Houses represent a significant 42.4% portion, catering likely to families or larger groups.
- Smaller segments like unique stays (combined 3.0%) offer potential for unique stay experiences.
Wangels Airbnb Room Capacity Analysis (2026): Bedroom Distribution
Distribution of Listings by Number of Bedrooms
Room Capacity Insights for Wangels
- The dominant room capacity in Wangels is 2 bedrooms listings, making up 39.4% of the market. This suggests a strong demand for properties suitable for couples or solo travelers.
- Together, 2 bedrooms and 1 bedroom properties represent 66.7% of the active Airbnb listings in Wangels, indicating a high concentration in these sizes.
Wangels Vacation Rental Guest Capacity Trends (2026)
Distribution of Listings by Guest Capacity
Guest Capacity Insights for Wangels
- The most common guest capacity trend in Wangels vacation rentals is listings accommodating 4 guests (30.3%). This suggests the primary traveler segment is likely small families or groups.
- Properties designed for 4 guests and 2 guests dominate the Wangels STR market, accounting for 57.6% of listings.
- 27.3% of properties accommodate 6+ guests, serving the market segment for larger families or group travel in Wangels.
- On average, properties in Wangels are equipped to host 3.9 guests.
Wangels Airbnb Booking Patterns (2026): Available vs. Booked Days
Available Days Distribution
Booked Days Distribution
Booking Pattern Insights for Wangels
- The most common availability pattern in Wangels falls within the 271-366 days range, representing 63.6% of listings. This suggests many properties have significant open periods on their calendars.
- Approximately 96.9% of listings show high availability (181+ days open annually), indicating potential for increased bookings or specific owner usage patterns.
- For booked days, the 31-90 days range is most frequent in Wangels (33.3%), reflecting common guest stay durations or potential owner blocking patterns.
- A notable 6.1% of properties secure long booking periods (181+ days booked per year), highlighting successful long-term rental strategies or significant owner usage.
Wangels Airbnb Minimum Stay Requirements Analysis
Distribution of Listings by Minimum Night Requirement
1 Night
11 listings
33.3% of total
2 Nights
1 listings
3% of total
3 Nights
5 listings
15.2% of total
4-6 Nights
2 listings
6.1% of total
7-29 Nights
2 listings
6.1% of total
30+ Nights
12 listings
36.4% of total
Key Insights
- The most prevalent minimum stay requirement in Wangels is 30+ Nights, adopted by 36.4% of listings. This highlights the market's preference for longer commitments.
- A significant segment (36.4%) caters to monthly stays (30+ nights) in Wangels, pointing to opportunities in the extended-stay market.
Recommendations
- Align with the market by considering a 30+ Nights minimum stay, as 36.4% of Wangels hosts use this setting.
- Explore offering discounts for stays of 30+ nights to attract the 36.4% of the market seeking extended stays.
- Adjust minimum nights based on seasonality – potentially shorter during low season and longer during peak demand periods in Wangels.
Wangels Airbnb Cancellation Policy Trends Analysis (2026)
Flexible
10 listings
31.3% of total
Moderate
5 listings
15.6% of total
Firm
17 listings
53.1% of total
Cancellation Policy Insights for Wangels
- The prevailing Airbnb cancellation policy trend in Wangels is Firm, used by 53.1% of listings.
- A majority (53.1%) of hosts in Wangels utilize Firm or Strict policies, indicating a market where hosts prioritize booking security.
Recommendations for Hosts
- Consider adopting a Firm policy to align with the 53.1% market standard in Wangels.
- Regularly review your cancellation policy against competitors and market demand shifts in Wangels.
Wangels STR Booking Lead Time Analysis (2026)
Average Booking Lead Time by Month
Booking Lead Time Insights for Wangels
- The overall average booking lead time for vacation rentals in Wangels is 82 days.
- Guests book furthest in advance for stays during November (average 188 days), likely coinciding with peak travel demand or local events.
- The shortest booking windows occur for stays in March (average 20 days), indicating more last-minute travel plans during this time.
- Seasonally, Winter (120 days avg.) sees the longest lead times, while Spring (49 days avg.) has the shortest, reflecting typical travel planning cycles.
Recommendations for Hosts
- Use the overall average lead time (82 days) as a baseline for your pricing and availability strategy in Wangels.
- For November stays, consider implementing length-of-stay discounts or slightly higher rates for bookings made less than 188 days out to capitalize on advance planning.
- Target marketing efforts for the Winter season well in advance (at least 120 days) to capture early planners.
- Monitor your own booking lead times against these Wangels averages to identify opportunities for dynamic pricing adjustments.
Popular & Essential Airbnb Amenities in Wangels (2026)
Amenity Prevalence
Amenity Insights for Wangels
- Essential amenities in Wangels that guests expect include: Heating. Lacking these (this) could significantly impact bookings.
- Popular amenities like Hangers, Kitchen, Refrigerator are common but not universal. Offering these can provide a competitive edge.
- Warning: Wifi is not universally provided but is considered essential globally. Ensure reliable Wifi is offered.
Recommendations for Hosts
- Ensure your listing includes all essential amenities for Wangels: Heating.
- Consider adding popular differentiators like Hangers or Kitchen to increase appeal.
- Highlight unique or less common amenities you offer (e.g., hot tub, dedicated workspace, EV charger) in your listing description and photos.
- Regularly check competitor amenities in Wangels to stay competitive.
Wangels Airbnb Guest Demographics & Profile Analysis (2026)
Guest Profile Summary for Wangels
- The typical guest profile for Airbnb in Wangels consists of primarily domestic travelers (84%), often arriving from nearby Hamburg, typically belonging to the Post-2000s (Gen Z/Alpha) group (50%), primarily speaking German or English.
- Domestic travelers account for 83.7% of guests.
- Key international markets include Germany (83.7%) and Netherlands (10.2%).
- Top languages spoken are German (36.5%) followed by English (34.9%).
- A significant demographic segment is the Post-2000s (Gen Z/Alpha) group, representing 50% of guests.
Recommendations for Hosts
- Target domestic marketing efforts towards travelers from Hamburg and Hanover.
- Tailor amenities and listing descriptions to appeal to the dominant Post-2000s (Gen Z/Alpha) demographic (e.g., highlight fast WiFi, smart home features, local guides).
- Highlight unique local experiences or amenities relevant to the primary guest profile.
- Consider seasonal promotions aligned with peak travel times for key origin markets.
Nearby Short-Term Rental Market Comparison
How does the Wangels Airbnb market stack up against its neighbors? Compare key performance metrics like average monthly revenue, ADR, and occupancy rates in surrounding areas to understand the broader regional STR landscape.
| Market | Active Properties | Monthly Revenue | Daily Rate | Avg. Occupancy |
|---|---|---|---|---|
| Wittenbeck | 14 | $2,937 | $224.34 | 43% |
| Lohals | 20 | $2,866 | $331.99 | 40% |
| Bissee | 13 | $2,338 | $180.13 | 48% |
| Rude Strand | 27 | $2,198 | $254.15 | 41% |
| Korshavn | 14 | $2,192 | $244.24 | 41% |
| Tørresø Strand | 26 | $2,145 | $235.54 | 42% |
| Harmsdorf | 10 | $2,076 | $326.10 | 36% |
| Billund | 105 | $2,027 | $194.14 | 46% |
| Ærøskøbing | 33 | $1,996 | $177.48 | 46% |
| Oberndorf | 10 | $1,872 | $186.86 | 28% |