Sylt Airbnb Market Analysis 2026: Short Term Rental Data & Vacation Rental Statistics in Schleswig-Holstein, Germany
Is Airbnb profitable in Sylt in 2026? Explore comprehensive Airbnb analytics for Sylt, Schleswig-Holstein, Germany to uncover income potential. This 2026 STR market report for Sylt, based on AirROI data from February 2025 to January 2026, reveals key trends in the market of 678 active listings.
Whether you're considering an Airbnb investment in Sylt, optimizing your existing vacation rental, or exploring rental arbitrage opportunities, understanding the Sylt Airbnb data is crucial. Leveraging the low regulation environment is key to maximizing your short term rental income potential. Let's dive into the specifics.
Key Sylt Airbnb Performance Metrics Overview
Monthly Airbnb Revenue Variations & Income Potential in Sylt (2026)
Understanding the monthly revenue variations for Airbnb listings in Sylt is key to maximizing your short term rental income potential. Seasonality significantly impacts earnings. Our analysis, based on data from the past 12 months, shows that the peak revenue month for STRs in Sylt is typically August, while January often presents the lowest earnings, highlighting opportunities for strategic pricing adjustments during shoulder and low seasons. Explore the typical Airbnb income in Sylt across different performance tiers:
- Best-in-class properties (Top 10%) achieve $3,682+ monthly, often utilizing dynamic pricing and superior guest experiences.
- Strong performing properties (Top 25%) earn $2,431 or more, indicating effective management and desirable locations/amenities.
- Typical properties (Median) generate around $1,408 per month, representing the average market performance.
- Entry-level properties (Bottom 25%) see earnings around $619, often with potential for optimization.
Average Monthly Airbnb Earnings Trend in Sylt
Sylt Airbnb Occupancy Rate Trends (2026)
Maximize your bookings by understanding the Sylt STR occupancy trends. Seasonal demand shifts significantly influence how often properties are booked. Typically, Augustsees the highest demand (peak season occupancy), while January experiences the lowest (low season). Effective strategies, like adjusting minimum stays or offering promotions, can boost occupancy during slower periods. Here's how different property tiers perform in Sylt:
- Best-in-class properties (Top 10%) achieve 73%+ occupancy, indicating high desirability and potentially optimized availability.
- Strong performing properties (Top 25%) maintain 56% or higher occupancy, suggesting good market fit and guest satisfaction.
- Typical properties (Median) have an occupancy rate around 27%.
- Entry-level properties (Bottom 25%) average 12% occupancy, potentially facing higher vacancy.
Average Monthly Occupancy Rate Trend in Sylt
Average Daily Rate (ADR) Airbnb Trends in Sylt (2026)
Effective short term rental pricing strategy in Sylt involves understanding monthly ADR fluctuations. The Average Daily Rate (ADR) for Airbnb in Sylt typically peaks in September and dips lowest during February. Leveraging Airbnb dynamic pricing tools or strategies based on this seasonality can significantly boost revenue. Here's a look at the typical nightly rates achieved:
- Best-in-class properties (Top 10%) command rates of $345+ per night, often due to premium features or locations.
- Strong performing properties (Top 25%) achieve nightly rates of $236 or more.
- Typical properties (Median) charge around $165 per night.
- Entry-level properties (Bottom 25%) earn around $128 per night.
Average Daily Rate (ADR) Trend by Month in Sylt
Get Live Sylt Market Intelligence 👇

Explore Real-time Analytics
Airbnb Seasonality Analysis & Trends in Sylt (2026)
Peak Season (August, September, July)
- Revenue averages $3,264 per month
- Occupancy rates average 45.2%
- Daily rates average $226
Shoulder Season
- Revenue averages $1,738 per month
- Occupancy maintains around 33.3%
- Daily rates hold near $201
Low Season (January, February, March)
- Revenue drops to average $1,035 per month
- Occupancy decreases to average 25.2%
- Daily rates adjust to average $179
Seasonality Insights for Sylt
- The Airbnb seasonality in Sylt shows highly seasonal trends requiring careful strategy. While the sections above show seasonal averages, it's also insightful to look at the extremes:
- During the high season, the absolute peak month showcases Sylt's highest earning potential, with monthly revenues capable of climbing to $3,753, occupancy reaching a high of 49.0%, and ADRs peaking at $240.
- Conversely, the slowest single month of the year, typically falling within the low season, marks the market's lowest point. In this month, revenue might dip to $933, occupancy could drop to 15.7%, and ADRs may adjust down to $159.
- Understanding both the seasonal averages and these monthly peaks and troughs in revenue, occupancy, and ADR is crucial for maximizing your Airbnb profit potential in Sylt.
Seasonal Strategies for Maximizing Profit
- Peak Season: Maximize revenue through premium pricing and potentially longer minimum stays. Ensure high availability.
- Low Season: Offer competitive pricing, special promotions (e.g., extended stay discounts), and flexible cancellation policies. Target off-season travelers like remote workers or budget-conscious guests.
- Shoulder Seasons: Implement dynamic pricing that balances peak and low rates. Target weekend travelers or specific events. Offer slightly more flexible terms than peak season.
- Regularly analyze your own performance against these Sylt seasonality benchmarks and adjust your pricing and availability strategy accordingly.
Best Areas for Airbnb Investment in Sylt (2026)
Exploring the top neighborhoods for short-term rentals in Sylt? This section highlights key areas, outlining why they are attractive for hosts and guests, along with notable local attractions. Consider these locations based on your target guest profile and investment strategy.
| Neighborhood / Area | Why Host Here? (Target Guests & Appeal) | Key Attractions & Landmarks |
|---|---|---|
| Kampen | Kampen is known as the most luxurious village on Sylt, offering pristine beaches and upscale amenities. It's a favorite among wealthy tourists looking for privacy and high-end experiences. | Sylt Aquarium, Kampen Lighthouse, Red Cliff, Uwe Düne (highest dune on Sylt) |
| List | List is the northernmost village in Germany, famous for its tranquil atmosphere and beautiful nature reserves. It's ideal for nature lovers and offers unique ecological experiences. | Wadden Sea National Park, List Harbor, The Ellenbogen, Küstenweg walking trail |
| Sylt Ost (East Sylt) | The East side of Sylt is perfect for those seeking quieter beaches and family-friendly activities. It's known for its picturesque landscapes and charming villages. | Langeness Island, Westerland Beach, Children's play parks, Various cycling paths |
| Westerland | Westerland is the vibrant center of Sylt's tourism scene, with a lively promenade and numerous restaurants, bars, and shops. Great for tourists seeking convenience and entertainment. | Westerland Beach, Sylt Wave water park, Shopping on Friedrichstraße, Kurplatz |
| Rømø | Although technically in Denmark, the island of Rømø is very close to Sylt and offers stunning beaches. It’s popular among tourists looking for diverse coastal experiences. | Rømø's wide beaches, Windmill of Rømø, Rømø Mini-Village, Eco-friendly activities |
| Braderup | Braderup is renowned for its scenic views and tranquility. It's a great place for those who want to be close to nature and enjoy quiet walks. | Braderup Dunes, Beautiful landscapes, Various hiking paths |
| Tinnum | Tinnum offers a mix of rural and coastal charm with its picturesque landscapes and proximity to the beach. It's suitable for families and couples looking for peaceful stays. | Tinnum Castle ruins, Local farms, Nature conservation area |
| Archsum | A small and peaceful village that is perfect for those looking to escape the hustle of tourist areas. It provides an authentic Sylt experience. | Archsum's nature trails, Farmlands, Local wildlife watching |
Understanding Airbnb License Requirements & STR Laws in Sylt (2026)
While Sylt, Schleswig-Holstein, Germany currently shows low STR regulations, specific Airbnb license requirements might still exist or change. Always verify the latest short term rental regulations and Airbnb license requirements directly with local government authorities for Sylt to ensure full compliance before hosting.
(Source: AirROI data, 2026, based on 0% licensed listings)
Top Performing Airbnb Properties in Sylt (2026)
Benchmark your potential! Explore examples of top-performing Airbnb properties in Syltbased on Trailing Twelve Month (TTM) revenue. Analyze their characteristics, revenue, occupancy rate, and ADR to understand what drives success in this market.
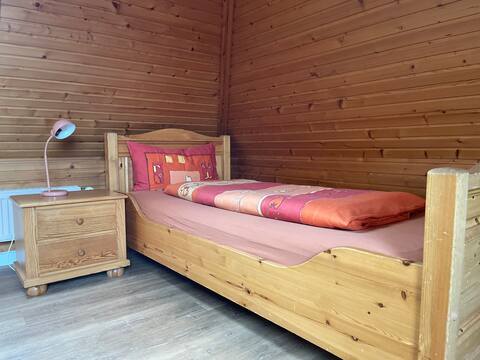
Cozy single room in the attic
Private Room • N/A
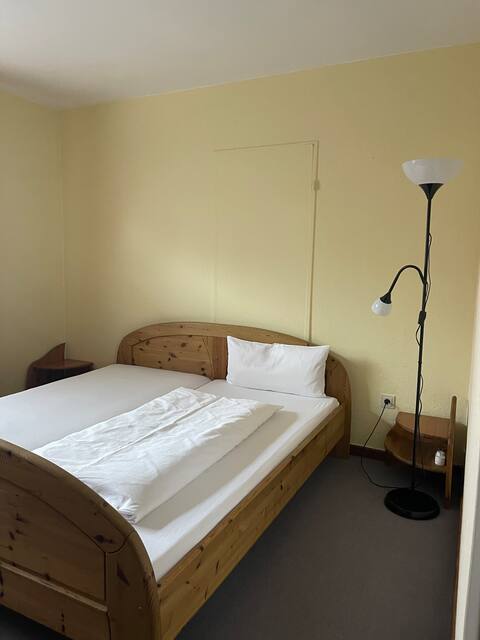
Apartment im EG
Private Room • N/A
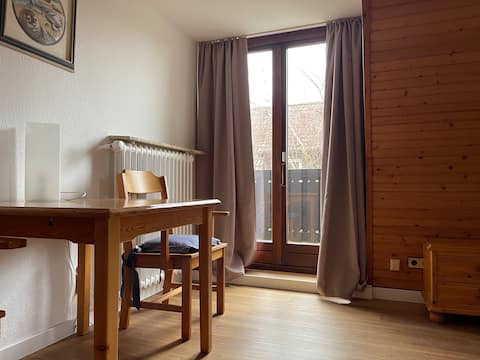
Cozy double room with sunny balcony
Private Room • N/A
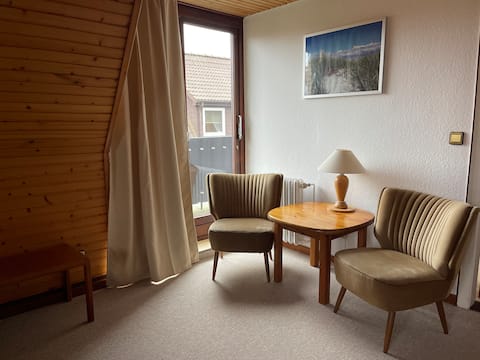
Cozy double room with sunny balcony
Private Room • N/A
Cozy double room with sunny balcony
Private Room • N/A

Cozy single room with sunny balcony
Private Room • N/A
Note: Performance varies based on location, size, amenities, seasonality, and management quality. Data reflects the past 12 months.
Top Performing Airbnb Hosts in Sylt (2026)
Learn from the best! This table showcases top-performing Airbnb hosts in Sylt based on the number of properties managed and estimated total revenue over the past year. Analyze their scale and performance metrics.
| Host Name | Properties | Grossing Revenue | Stay Reviews | Avg Rating |
|---|---|---|---|---|
| Gerhard | 11 | $1,156,949 | 192 | 4.75/5.0 |
| Frederic & Jana | 9 | $258,758 | 789 | 4.79/5.0 |
| Claudia | 96 | $250,407 | 355 | 4.60/5.0 |
| Bernd | 10 | $203,559 | 139 | 4.92/5.0 |
| Martina & Jörg | 6 | $186,448 | 622 | 4.78/5.0 |
| Weiss-Sylt, Sandra Weiß | 2 | $171,225 | 29 | 4.94/5.0 |
| Sylt-ER GmbH | 17 | $166,751 | 34 | 4.90/5.0 |
| Sylt To Hus Appartementvermitt | 28 | $164,481 | 54 | 4.81/5.0 |
| Carina | 7 | $164,406 | 589 | 4.81/5.0 |
| Liz | 6 | $162,710 | 173 | 4.56/5.0 |
Analyzing the strategies of top hosts, such as their property selection, pricing, and guest communication, can offer valuable lessons for optimizing your own Airbnb operations in Sylt.
Dive Deeper: Advanced Sylt STR Market Data (2026)
Ready to unlock more insights? AirROI provides access to advanced metrics and comprehensive Airbnb data for Sylt. Explore detailed analytics beyond this report to refine your investment strategy, optimize pricing, and maximize your vacation rental profits.
Explore Advanced MetricsSylt Short-Term Rental Market Composition (2026): Property & Room Types
Room Type Distribution
Property Type Distribution
Market Composition Insights for Sylt
- The Sylt Airbnb market composition is heavily skewed towards Entire Home/Apt listings, which make up 96.6% of the 678 active rentals. This indicates strong guest preference for privacy and space.
- Looking at the property type distribution in Sylt, Apartment/Condo properties are the most common (80.5%), reflecting the local real estate landscape.
- Houses represent a significant 18.1% portion, catering likely to families or larger groups.
- Smaller segments like hotel/boutique, outdoor/unique, others, unique stays (combined 1.2%) offer potential for unique stay experiences.
Sylt Airbnb Room Capacity Analysis (2026): Bedroom Distribution
Distribution of Listings by Number of Bedrooms
Room Capacity Insights for Sylt
- The dominant room capacity in Sylt is 1 bedroom listings, making up 49.4% of the market. This suggests a strong demand for properties suitable for couples or solo travelers.
- Together, 1 bedroom and 2 bedrooms properties represent 73.9% of the active Airbnb listings in Sylt, indicating a high concentration in these sizes.
Sylt Vacation Rental Guest Capacity Trends (2026)
Distribution of Listings by Guest Capacity
Guest Capacity Insights for Sylt
- The most common guest capacity trend in Sylt vacation rentals is listings accommodating 2 guests (41.9%). This suggests the primary traveler segment is likely couples or solo travelers.
- Properties designed for 2 guests and 4 guests dominate the Sylt STR market, accounting for 68.9% of listings.
- A significant 42.6% of listings cater specifically to 1-2 guests, highlighting strong demand from couples and solo travelers in Sylt.
- 11.9% of properties accommodate 6+ guests, serving the market segment for larger families or group travel in Sylt.
- On average, properties in Sylt are equipped to host 3.2 guests.
Sylt Airbnb Booking Patterns (2026): Available vs. Booked Days
Available Days Distribution
Booked Days Distribution
Booking Pattern Insights for Sylt
- The most common availability pattern in Sylt falls within the 271-366 days range, representing 72% of listings. This suggests many properties have significant open periods on their calendars.
- Approximately 88.2% of listings show high availability (181+ days open annually), indicating potential for increased bookings or specific owner usage patterns.
- For booked days, the 1-30 days range is most frequent in Sylt (53.1%), reflecting common guest stay durations or potential owner blocking patterns.
- A notable 12.4% of properties secure long booking periods (181+ days booked per year), highlighting successful long-term rental strategies or significant owner usage.
Sylt Airbnb Minimum Stay Requirements Analysis
Distribution of Listings by Minimum Night Requirement
1 Night
45 listings
6.6% of total
2 Nights
33 listings
4.9% of total
3 Nights
15 listings
2.2% of total
4-6 Nights
109 listings
16.1% of total
7-29 Nights
12 listings
1.8% of total
30+ Nights
464 listings
68.4% of total
Key Insights
- The most prevalent minimum stay requirement in Sylt is 30+ Nights, adopted by 68.4% of listings. This highlights the market's preference for longer commitments.
- Very short stays (1-2 nights) are less common (11.5%), suggesting hosts prefer slightly longer bookings to optimize turnover.
- A significant segment (68.4%) caters to monthly stays (30+ nights) in Sylt, pointing to opportunities in the extended-stay market.
Recommendations
- Align with the market by considering a 30+ Nights minimum stay, as 68.4% of Sylt hosts use this setting.
- If feasible, allowing 1-night stays, especially midweek or during low season, could capture last-minute bookings, as only 6.6% currently do.
- Explore offering discounts for stays of 30+ nights to attract the 68.4% of the market seeking extended stays.
- Adjust minimum nights based on seasonality – potentially shorter during low season and longer during peak demand periods in Sylt.
Sylt Airbnb Cancellation Policy Trends Analysis (2026)
Super Strict 60 Days
119 listings
17.8% of total
Refundable
1 listings
0.1% of total
Super Strict 30 Days
11 listings
1.6% of total
Flexible
24 listings
3.6% of total
Moderate
26 listings
3.9% of total
Firm
387 listings
57.8% of total
Strict
101 listings
15.1% of total
Cancellation Policy Insights for Sylt
- The prevailing Airbnb cancellation policy trend in Sylt is Firm, used by 57.8% of listings.
- A majority (72.9%) of hosts in Sylt utilize Firm or Strict policies, indicating a market where hosts prioritize booking security.
Recommendations for Hosts
- Consider adopting a Firm policy to align with the 57.8% market standard in Sylt.
- Regularly review your cancellation policy against competitors and market demand shifts in Sylt.
Sylt STR Booking Lead Time Analysis (2026)
Average Booking Lead Time by Month
Booking Lead Time Insights for Sylt
- The overall average booking lead time for vacation rentals in Sylt is 89 days.
- Guests book furthest in advance for stays during August (average 105 days), likely coinciding with peak travel demand or local events.
- The shortest booking windows occur for stays in February (average 56 days), indicating more last-minute travel plans during this time.
- Seasonally, Summer (95 days avg.) sees the longest lead times, while Spring (74 days avg.) has the shortest, reflecting typical travel planning cycles.
Recommendations for Hosts
- Use the overall average lead time (89 days) as a baseline for your pricing and availability strategy in Sylt.
- For August stays, consider implementing length-of-stay discounts or slightly higher rates for bookings made less than 105 days out to capitalize on advance planning.
- Target marketing efforts for the Summer season well in advance (at least 95 days) to capture early planners.
- Monitor your own booking lead times against these Sylt averages to identify opportunities for dynamic pricing adjustments.
Popular & Essential Airbnb Amenities in Sylt (2026)
Amenity Prevalence
Amenity Insights for Sylt
- Essential amenities in Sylt that guests expect include: Wifi, Heating, TV, Kitchen. Lacking these (any) could significantly impact bookings.
- Popular amenities like Smoke alarm, Refrigerator, Hair dryer are common but not universal. Offering these can provide a competitive edge.
Recommendations for Hosts
- Ensure your listing includes all essential amenities for Sylt: Wifi, Heating, TV, Kitchen.
- Prioritize adding missing essentials: Wifi, Heating, TV, Kitchen.
- Consider adding popular differentiators like Smoke alarm or Refrigerator to increase appeal.
- Highlight unique or less common amenities you offer (e.g., hot tub, dedicated workspace, EV charger) in your listing description and photos.
- Regularly check competitor amenities in Sylt to stay competitive.
Sylt Airbnb Guest Demographics & Profile Analysis (2026)
Guest Profile Summary for Sylt
- The typical guest profile for Airbnb in Sylt consists of primarily domestic travelers (90%), often arriving from nearby Hamburg, typically belonging to the Post-2000s (Gen Z/Alpha) group (50%), primarily speaking German or English.
- Domestic travelers account for 90.2% of guests.
- Key international markets include Germany (90.2%) and Switzerland (4.7%).
- Top languages spoken are German (39.9%) followed by English (39.3%).
- A significant demographic segment is the Post-2000s (Gen Z/Alpha) group, representing 50% of guests.
Recommendations for Hosts
- Target domestic marketing efforts towards travelers from Hamburg and Berlin.
- Tailor amenities and listing descriptions to appeal to the dominant Post-2000s (Gen Z/Alpha) demographic (e.g., highlight fast WiFi, smart home features, local guides).
- Highlight unique local experiences or amenities relevant to the primary guest profile.
- Consider seasonal promotions aligned with peak travel times for key origin markets.
Nearby Short-Term Rental Market Comparison
How does the Sylt Airbnb market stack up against its neighbors? Compare key performance metrics like average monthly revenue, ADR, and occupancy rates in surrounding areas to understand the broader regional STR landscape.
| Market | Active Properties | Monthly Revenue | Daily Rate | Avg. Occupancy |
|---|---|---|---|---|
| Husum-Ballum | 13 | $4,837 | $499.93 | 44% |
| Blåvand | 16 | $2,374 | $318.93 | 40% |
| Helgoland | 11 | $2,199 | $167.07 | 58% |
| Billund | 105 | $2,027 | $194.14 | 46% |
| Vlagtwedde | 38 | $2,018 | $352.87 | 31% |
| Oberndorf | 10 | $1,872 | $186.86 | 28% |
| Tetenbüll | 29 | $1,849 | $238.36 | 34% |
| Hamburg | 2,515 | $1,836 | $157.66 | 49% |
| Kampen (Sylt) | 25 | $1,824 | $508.88 | 23% |
| Brake | 19 | $1,755 | $136.43 | 46% |