Scharbeutz Airbnb Market Analysis 2026: Short Term Rental Data & Vacation Rental Statistics in Schleswig-Holstein, Germany
Is Airbnb profitable in Scharbeutz in 2026? Explore comprehensive Airbnb analytics for Scharbeutz, Schleswig-Holstein, Germany to uncover income potential. This 2026 STR market report for Scharbeutz, based on AirROI data from February 2025 to January 2026, reveals key trends in the market of 319 active listings.
Whether you're considering an Airbnb investment in Scharbeutz, optimizing your existing vacation rental, or exploring rental arbitrage opportunities, understanding the Scharbeutz Airbnb data is crucial. Leveraging the low regulation environment is key to maximizing your short term rental income potential. Let's dive into the specifics.
Key Scharbeutz Airbnb Performance Metrics Overview
Monthly Airbnb Revenue Variations & Income Potential in Scharbeutz (2026)
Understanding the monthly revenue variations for Airbnb listings in Scharbeutz is key to maximizing your short term rental income potential. Seasonality significantly impacts earnings. Our analysis, based on data from the past 12 months, shows that the peak revenue month for STRs in Scharbeutz is typically August, while January often presents the lowest earnings, highlighting opportunities for strategic pricing adjustments during shoulder and low seasons. Explore the typical Airbnb income in Scharbeutz across different performance tiers:
- Best-in-class properties (Top 10%) achieve $3,873+ monthly, often utilizing dynamic pricing and superior guest experiences.
- Strong performing properties (Top 25%) earn $2,509 or more, indicating effective management and desirable locations/amenities.
- Typical properties (Median) generate around $1,351 per month, representing the average market performance.
- Entry-level properties (Bottom 25%) see earnings around $560, often with potential for optimization.
Average Monthly Airbnb Earnings Trend in Scharbeutz
Scharbeutz Airbnb Occupancy Rate Trends (2026)
Maximize your bookings by understanding the Scharbeutz STR occupancy trends. Seasonal demand shifts significantly influence how often properties are booked. Typically, Augustsees the highest demand (peak season occupancy), while January experiences the lowest (low season). Effective strategies, like adjusting minimum stays or offering promotions, can boost occupancy during slower periods. Here's how different property tiers perform in Scharbeutz:
- Best-in-class properties (Top 10%) achieve 74%+ occupancy, indicating high desirability and potentially optimized availability.
- Strong performing properties (Top 25%) maintain 55% or higher occupancy, suggesting good market fit and guest satisfaction.
- Typical properties (Median) have an occupancy rate around 31%.
- Entry-level properties (Bottom 25%) average 12% occupancy, potentially facing higher vacancy.
Average Monthly Occupancy Rate Trend in Scharbeutz
Average Daily Rate (ADR) Airbnb Trends in Scharbeutz (2026)
Effective short term rental pricing strategy in Scharbeutz involves understanding monthly ADR fluctuations. The Average Daily Rate (ADR) for Airbnb in Scharbeutz typically peaks in August and dips lowest during February. Leveraging Airbnb dynamic pricing tools or strategies based on this seasonality can significantly boost revenue. Here's a look at the typical nightly rates achieved:
- Best-in-class properties (Top 10%) command rates of $255+ per night, often due to premium features or locations.
- Strong performing properties (Top 25%) achieve nightly rates of $198 or more.
- Typical properties (Median) charge around $158 per night.
- Entry-level properties (Bottom 25%) earn around $123 per night.
Average Daily Rate (ADR) Trend by Month in Scharbeutz
Get Live Scharbeutz Market Intelligence 👇

Explore Real-time Analytics
Airbnb Seasonality Analysis & Trends in Scharbeutz (2026)
Peak Season (August, July, September)
- Revenue averages $2,655 per month
- Occupancy rates average 48.2%
- Daily rates average $184
Shoulder Season
- Revenue averages $1,725 per month
- Occupancy maintains around 35.4%
- Daily rates hold near $165
Low Season (January, February, December)
- Revenue drops to average $1,039 per month
- Occupancy decreases to average 22.6%
- Daily rates adjust to average $165
Seasonality Insights for Scharbeutz
- The Airbnb seasonality in Scharbeutz shows highly seasonal trends requiring careful strategy. While the sections above show seasonal averages, it's also insightful to look at the extremes:
- During the high season, the absolute peak month showcases Scharbeutz's highest earning potential, with monthly revenues capable of climbing to $2,912, occupancy reaching a high of 51.7%, and ADRs peaking at $186.
- Conversely, the slowest single month of the year, typically falling within the low season, marks the market's lowest point. In this month, revenue might dip to $798, occupancy could drop to 14.7%, and ADRs may adjust down to $142.
- Understanding both the seasonal averages and these monthly peaks and troughs in revenue, occupancy, and ADR is crucial for maximizing your Airbnb profit potential in Scharbeutz.
Seasonal Strategies for Maximizing Profit
- Peak Season: Maximize revenue through premium pricing and potentially longer minimum stays. Ensure high availability.
- Low Season: Offer competitive pricing, special promotions (e.g., extended stay discounts), and flexible cancellation policies. Target off-season travelers like remote workers or budget-conscious guests.
- Shoulder Seasons: Implement dynamic pricing that balances peak and low rates. Target weekend travelers or specific events. Offer slightly more flexible terms than peak season.
- Regularly analyze your own performance against these Scharbeutz seasonality benchmarks and adjust your pricing and availability strategy accordingly.
Best Areas for Airbnb Investment in Scharbeutz (2026)
Exploring the top neighborhoods for short-term rentals in Scharbeutz? This section highlights key areas, outlining why they are attractive for hosts and guests, along with notable local attractions. Consider these locations based on your target guest profile and investment strategy.
| Neighborhood / Area | Why Host Here? (Target Guests & Appeal) | Key Attractions & Landmarks |
|---|---|---|
| Scharbeutz Beach | A beautiful sandy beach attracting visitors year-round, known for its water activities and promenade. Ideal for tourists looking for relaxation and leisure by the sea. | Scharbeutz Beach, Promenade, Hansa Park, Water sports activities, Local cafes and restaurants |
| Timmendorfer Strand | Adjacent to Scharbeutz, this upscale resort area is famous for its beach clubs and luxury accommodations. A prime destination for families and couples seeking comfort and activity. | Timmendorfer Strand Beach, Sea Life Timmendorfer Strand, Explore the local nightlife, Shopping in beach boutiques, Beach volleyball events |
| Pönitz | A quieter, more residential area offering a peaceful retreat and proximity to nature. Great for guests wanting a tranquil getaway while still being close to attractions. | Pönitzer See, Nature walks, Local farms and markets, Hiking trails, Café Pönitz |
| Ahrensburg | A picturesque town with historic charm, close to Scharbeutz. Attracts visitors interested in history, culture, and serene landscapes. | Ahrensburg Castle, Historic town center, Parks and gardens, Café culture, Nearby hiking paths |
| Lübeck | A UNESCO World Heritage site located nearby, Lübeck offers rich history, architecture, and culture. Perfect for guests interested in a cultural experience. | Lübeck Cathedral, Holstentor, Historic old town, Marzipan shops, Museums of Lübeck |
| Niendorf | A small fishing village with a quaint harbor, ideal for visitors seeking a peaceful seaside experience away from the crowds of bigger towns. | Niendorf harbor, Local fish market, Beach walks, Relaxing parks, Quiet cafés |
| Kiel | The capital city of Schleswig-Holstein, known for its maritime heritage and vibrant events. Attracts a diverse range of tourists, from students to families. | Kiel Canal, U-Boat Museum, Kiel Week (sailing regatta), Shopping districts, Various cultural festivals |
| Sierksdorf | An appealing coastal town with family-friendly attractions, Sierksdorf is perfect for guests seeking amusement parks and beach fun. | Hansapark amusement park, Sierksdorf Beach, Family-friendly activities, Water parks, Playgrounds and outdoor sports |
Understanding Airbnb License Requirements & STR Laws in Scharbeutz (2026)
While Scharbeutz, Schleswig-Holstein, Germany currently shows low STR regulations, specific Airbnb license requirements might still exist or change. Always verify the latest short term rental regulations and Airbnb license requirements directly with local government authorities for Scharbeutz to ensure full compliance before hosting.
(Source: AirROI data, 2026, based on 1% licensed listings)
Top Performing Airbnb Properties in Scharbeutz (2026)
Benchmark your potential! Explore examples of top-performing Airbnb properties in Scharbeutzbased on Trailing Twelve Month (TTM) revenue. Analyze their characteristics, revenue, occupancy rate, and ADR to understand what drives success in this market.
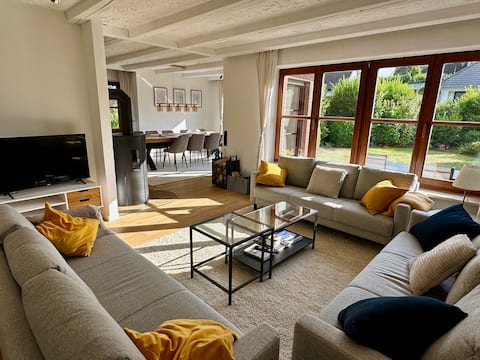
400 m to the beach - Spacious house with a great garden
Entire Place • 5 bedrooms

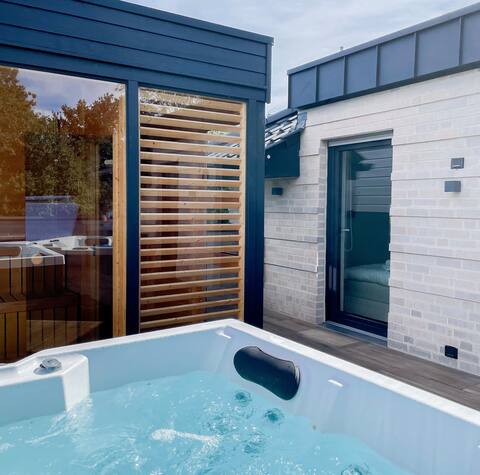
Villa with 4 bedrooms and 4 bathrooms for guests 8
Entire Place • 4 bedrooms
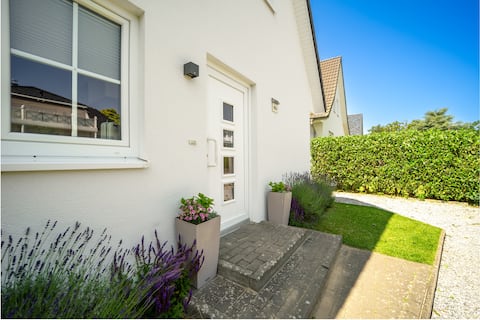
Ferienwohnung Crystal Cove by My Baltic Sea
Entire Place • 2 bedrooms
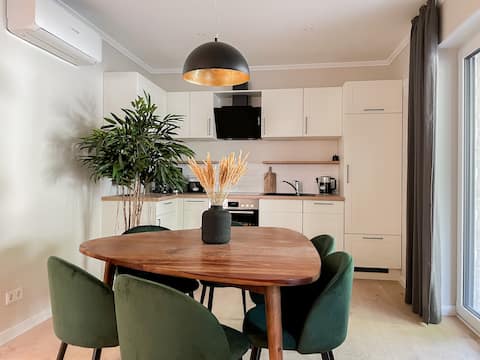
Vacation home close to the beach on Ludwigstr. Scharbeutz
Entire Place • 4 bedrooms

Lake and sand at the Baltic Sea beach in Scharbeutz
Entire Place • 4 bedrooms
Ferienwohnung Happy Harbour by My Baltic Sea
Entire Place • 2 bedrooms
Note: Performance varies based on location, size, amenities, seasonality, and management quality. Data reflects the past 12 months.
Top Performing Airbnb Hosts in Scharbeutz (2026)
Learn from the best! This table showcases top-performing Airbnb hosts in Scharbeutz based on the number of properties managed and estimated total revenue over the past year. Analyze their scale and performance metrics.
| Host Name | Properties | Grossing Revenue | Stay Reviews | Avg Rating |
|---|---|---|---|---|
| Kim & Marie | 19 | $644,185 | 319 | 4.89/5.0 |
| Baltic | 58 | $181,703 | 710 | 4.64/5.0 |
| Sebastian | 5 | $162,685 | 298 | 4.92/5.0 |
| Reiterhof Am Dorfteich | 3 | $131,765 | 200 | 4.96/5.0 |
| Hildes HEim Projektbau GmbH | 5 | $115,663 | 49 | 4.14/5.0 |
| Stephan | 2 | $112,562 | 95 | 4.93/5.0 |
| Silvia | 10 | $98,865 | 917 | 4.76/5.0 |
| Martin & Katharina | 3 | $91,097 | 341 | 4.95/5.0 |
| Samir | 2 | $89,074 | 88 | 4.97/5.0 |
| Rike | 4 | $79,599 | 541 | 4.65/5.0 |
Analyzing the strategies of top hosts, such as their property selection, pricing, and guest communication, can offer valuable lessons for optimizing your own Airbnb operations in Scharbeutz.
Dive Deeper: Advanced Scharbeutz STR Market Data (2026)
Ready to unlock more insights? AirROI provides access to advanced metrics and comprehensive Airbnb data for Scharbeutz. Explore detailed analytics beyond this report to refine your investment strategy, optimize pricing, and maximize your vacation rental profits.
Explore Advanced MetricsScharbeutz Short-Term Rental Market Composition (2026): Property & Room Types
Room Type Distribution
Property Type Distribution
Market Composition Insights for Scharbeutz
- The Scharbeutz Airbnb market composition is heavily skewed towards Entire Home/Apt listings, which make up 96.6% of the 319 active rentals. This indicates strong guest preference for privacy and space.
- Looking at the property type distribution in Scharbeutz, Apartment/Condo properties are the most common (68%), reflecting the local real estate landscape.
- Houses represent a significant 27.3% portion, catering likely to families or larger groups.
- Smaller segments like hotel/boutique, outdoor/unique (combined 4.7%) offer potential for unique stay experiences.
Scharbeutz Airbnb Room Capacity Analysis (2026): Bedroom Distribution
Distribution of Listings by Number of Bedrooms
Room Capacity Insights for Scharbeutz
- The dominant room capacity in Scharbeutz is 1 bedroom listings, making up 41.4% of the market. This suggests a strong demand for properties suitable for couples or solo travelers.
- Together, 1 bedroom and 2 bedrooms properties represent 75.3% of the active Airbnb listings in Scharbeutz, indicating a high concentration in these sizes.
Scharbeutz Vacation Rental Guest Capacity Trends (2026)
Distribution of Listings by Guest Capacity
Guest Capacity Insights for Scharbeutz
- The most common guest capacity trend in Scharbeutz vacation rentals is listings accommodating 4 guests (34.5%). This suggests the primary traveler segment is likely small families or groups.
- Properties designed for 4 guests and 2 guests dominate the Scharbeutz STR market, accounting for 52.4% of listings.
- 21.3% of properties accommodate 6+ guests, serving the market segment for larger families or group travel in Scharbeutz.
- On average, properties in Scharbeutz are equipped to host 4.1 guests.
Scharbeutz Airbnb Booking Patterns (2026): Available vs. Booked Days
Available Days Distribution
Booked Days Distribution
Booking Pattern Insights for Scharbeutz
- The most common availability pattern in Scharbeutz falls within the 271-366 days range, representing 62.1% of listings. This suggests many properties have significant open periods on their calendars.
- Approximately 88.1% of listings show high availability (181+ days open annually), indicating potential for increased bookings or specific owner usage patterns.
- For booked days, the 1-30 days range is most frequent in Scharbeutz (43.9%), reflecting common guest stay durations or potential owner blocking patterns.
- A notable 12.6% of properties secure long booking periods (181+ days booked per year), highlighting successful long-term rental strategies or significant owner usage.
Scharbeutz Airbnb Minimum Stay Requirements Analysis
Distribution of Listings by Minimum Night Requirement
1 Night
9 listings
2.8% of total
2 Nights
33 listings
10.3% of total
3 Nights
23 listings
7.2% of total
4-6 Nights
45 listings
14.1% of total
7-29 Nights
7 listings
2.2% of total
30+ Nights
202 listings
63.3% of total
Key Insights
- The most prevalent minimum stay requirement in Scharbeutz is 30+ Nights, adopted by 63.3% of listings. This highlights the market's preference for longer commitments.
- Very short stays (1-2 nights) are less common (13.1%), suggesting hosts prefer slightly longer bookings to optimize turnover.
- A significant segment (63.3%) caters to monthly stays (30+ nights) in Scharbeutz, pointing to opportunities in the extended-stay market.
Recommendations
- Align with the market by considering a 30+ Nights minimum stay, as 63.3% of Scharbeutz hosts use this setting.
- If feasible, allowing 1-night stays, especially midweek or during low season, could capture last-minute bookings, as only 2.8% currently do.
- Explore offering discounts for stays of 30+ nights to attract the 63.3% of the market seeking extended stays.
- Adjust minimum nights based on seasonality – potentially shorter during low season and longer during peak demand periods in Scharbeutz.
Scharbeutz Airbnb Cancellation Policy Trends Analysis (2026)
Super Strict 30 Days
74 listings
23.2% of total
Limited
1 listings
0.3% of total
Super Strict 60 Days
17 listings
5.3% of total
Flexible
9 listings
2.8% of total
Moderate
37 listings
11.6% of total
Firm
147 listings
46.1% of total
Strict
34 listings
10.7% of total
Cancellation Policy Insights for Scharbeutz
- The prevailing Airbnb cancellation policy trend in Scharbeutz is Firm, used by 46.1% of listings.
- A majority (56.8%) of hosts in Scharbeutz utilize Firm or Strict policies, indicating a market where hosts prioritize booking security.
Recommendations for Hosts
- Consider adopting a Firm policy to align with the 46.1% market standard in Scharbeutz.
- Using a Strict policy might deter some guests, as only 10.7% of listings use it. Evaluate if potential revenue protection outweighs possible lower booking rates.
- Regularly review your cancellation policy against competitors and market demand shifts in Scharbeutz.
Scharbeutz STR Booking Lead Time Analysis (2026)
Average Booking Lead Time by Month
Booking Lead Time Insights for Scharbeutz
- The overall average booking lead time for vacation rentals in Scharbeutz is 66 days.
- Guests book furthest in advance for stays during August (average 93 days), likely coinciding with peak travel demand or local events.
- The shortest booking windows occur for stays in February (average 26 days), indicating more last-minute travel plans during this time.
- Seasonally, Summer (84 days avg.) sees the longest lead times, while Winter (36 days avg.) has the shortest, reflecting typical travel planning cycles.
Recommendations for Hosts
- Use the overall average lead time (66 days) as a baseline for your pricing and availability strategy in Scharbeutz.
- For August stays, consider implementing length-of-stay discounts or slightly higher rates for bookings made less than 93 days out to capitalize on advance planning.
- Target marketing efforts for the Summer season well in advance (at least 84 days) to capture early planners.
- Monitor your own booking lead times against these Scharbeutz averages to identify opportunities for dynamic pricing adjustments.
Popular & Essential Airbnb Amenities in Scharbeutz (2026)
Amenity Prevalence
Amenity Insights for Scharbeutz
- Essential amenities in Scharbeutz that guests expect include: TV, Wifi, Smoke alarm, Heating. Lacking these (any) could significantly impact bookings.
- Popular amenities like Kitchen, Free parking on premises, Refrigerator are common but not universal. Offering these can provide a competitive edge.
Recommendations for Hosts
- Ensure your listing includes all essential amenities for Scharbeutz: TV, Wifi, Smoke alarm, Heating.
- Prioritize adding missing essentials: TV, Wifi, Smoke alarm, Heating.
- Consider adding popular differentiators like Kitchen or Free parking on premises to increase appeal.
- Highlight unique or less common amenities you offer (e.g., hot tub, dedicated workspace, EV charger) in your listing description and photos.
- Regularly check competitor amenities in Scharbeutz to stay competitive.
Scharbeutz Airbnb Guest Demographics & Profile Analysis (2026)
Guest Profile Summary for Scharbeutz
- The typical guest profile for Airbnb in Scharbeutz consists of primarily domestic travelers (90%), often arriving from nearby Hamburg, typically belonging to the Post-2000s (Gen Z/Alpha) group (50%), primarily speaking German or English.
- Domestic travelers account for 90.2% of guests.
- Key international markets include Germany (90.2%) and Netherlands (1.5%).
- Top languages spoken are German (39.7%) followed by English (38.9%).
- A significant demographic segment is the Post-2000s (Gen Z/Alpha) group, representing 50% of guests.
Recommendations for Hosts
- Target domestic marketing efforts towards travelers from Hamburg and Hanover.
- Tailor amenities and listing descriptions to appeal to the dominant Post-2000s (Gen Z/Alpha) demographic (e.g., highlight fast WiFi, smart home features, local guides).
- Highlight unique local experiences or amenities relevant to the primary guest profile.
- Consider seasonal promotions aligned with peak travel times for key origin markets.
Nearby Short-Term Rental Market Comparison
How does the Scharbeutz Airbnb market stack up against its neighbors? Compare key performance metrics like average monthly revenue, ADR, and occupancy rates in surrounding areas to understand the broader regional STR landscape.
| Market | Active Properties | Monthly Revenue | Daily Rate | Avg. Occupancy |
|---|---|---|---|---|
| Wittenbeck | 14 | $2,937 | $224.34 | 43% |
| Lohals | 20 | $2,866 | $331.99 | 40% |
| Bissee | 13 | $2,338 | $180.13 | 48% |
| Rude Strand | 27 | $2,198 | $254.15 | 41% |
| Korshavn | 14 | $2,192 | $244.24 | 41% |
| Tørresø Strand | 26 | $2,145 | $235.54 | 42% |
| Harmsdorf | 10 | $2,076 | $326.10 | 36% |
| Billund | 105 | $2,027 | $194.14 | 46% |
| Ærøskøbing | 33 | $1,996 | $177.48 | 46% |
| Oberndorf | 10 | $1,872 | $186.86 | 28% |