Pellworm Airbnb Market Analysis 2026: Short Term Rental Data & Vacation Rental Statistics in Schleswig-Holstein, Germany
Is Airbnb profitable in Pellworm in 2026? Explore comprehensive Airbnb analytics for Pellworm, Schleswig-Holstein, Germany to uncover income potential. This 2026 STR market report for Pellworm, based on AirROI data from February 2025 to January 2026, reveals key trends in the niche market of 66 active listings.
Whether you're considering an Airbnb investment in Pellworm, optimizing your existing vacation rental, or exploring rental arbitrage opportunities, understanding the Pellworm Airbnb data is crucial. Leveraging the low regulation environment is key to maximizing your short term rental income potential. Let's dive into the specifics.
Key Pellworm Airbnb Performance Metrics Overview
Monthly Airbnb Revenue Variations & Income Potential in Pellworm (2026)
Understanding the monthly revenue variations for Airbnb listings in Pellworm is key to maximizing your short term rental income potential. Seasonality significantly impacts earnings. Our analysis, based on data from the past 12 months, shows that the peak revenue month for STRs in Pellworm is typically July, while January often presents the lowest earnings, highlighting opportunities for strategic pricing adjustments during shoulder and low seasons. Explore the typical Airbnb income in Pellworm across different performance tiers:
- Best-in-class properties (Top 10%) achieve $2,681+ monthly, often utilizing dynamic pricing and superior guest experiences.
- Strong performing properties (Top 25%) earn $1,899 or more, indicating effective management and desirable locations/amenities.
- Typical properties (Median) generate around $986 per month, representing the average market performance.
- Entry-level properties (Bottom 25%) see earnings around $450, often with potential for optimization.
Average Monthly Airbnb Earnings Trend in Pellworm
Pellworm Airbnb Occupancy Rate Trends (2026)
Maximize your bookings by understanding the Pellworm STR occupancy trends. Seasonal demand shifts significantly influence how often properties are booked. Typically, Julysees the highest demand (peak season occupancy), while January experiences the lowest (low season). Effective strategies, like adjusting minimum stays or offering promotions, can boost occupancy during slower periods. Here's how different property tiers perform in Pellworm:
- Best-in-class properties (Top 10%) achieve 57%+ occupancy, indicating high desirability and potentially optimized availability.
- Strong performing properties (Top 25%) maintain 39% or higher occupancy, suggesting good market fit and guest satisfaction.
- Typical properties (Median) have an occupancy rate around 20%.
- Entry-level properties (Bottom 25%) average 8% occupancy, potentially facing higher vacancy.
Average Monthly Occupancy Rate Trend in Pellworm
Average Daily Rate (ADR) Airbnb Trends in Pellworm (2026)
Effective short term rental pricing strategy in Pellworm involves understanding monthly ADR fluctuations. The Average Daily Rate (ADR) for Airbnb in Pellworm typically peaks in July and dips lowest during February. Leveraging Airbnb dynamic pricing tools or strategies based on this seasonality can significantly boost revenue. Here's a look at the typical nightly rates achieved:
- Best-in-class properties (Top 10%) command rates of $281+ per night, often due to premium features or locations.
- Strong performing properties (Top 25%) achieve nightly rates of $231 or more.
- Typical properties (Median) charge around $139 per night.
- Entry-level properties (Bottom 25%) earn around $111 per night.
Average Daily Rate (ADR) Trend by Month in Pellworm
Get Live Pellworm Market Intelligence 👇

Explore Real-time Analytics
Airbnb Seasonality Analysis & Trends in Pellworm (2026)
Peak Season (July, August, April)
- Revenue averages $1,982 per month
- Occupancy rates average 36.1%
- Daily rates average $184
Shoulder Season
- Revenue averages $1,343 per month
- Occupancy maintains around 27.2%
- Daily rates hold near $176
Low Season (January, November, December)
- Revenue drops to average $741 per month
- Occupancy decreases to average 14.4%
- Daily rates adjust to average $181
Seasonality Insights for Pellworm
- The Airbnb seasonality in Pellworm shows highly seasonal trends requiring careful strategy. While the sections above show seasonal averages, it's also insightful to look at the extremes:
- During the high season, the absolute peak month showcases Pellworm's highest earning potential, with monthly revenues capable of climbing to $2,071, occupancy reaching a high of 40.7%, and ADRs peaking at $192.
- Conversely, the slowest single month of the year, typically falling within the low season, marks the market's lowest point. In this month, revenue might dip to $473, occupancy could drop to 9.6%, and ADRs may adjust down to $162.
- Understanding both the seasonal averages and these monthly peaks and troughs in revenue, occupancy, and ADR is crucial for maximizing your Airbnb profit potential in Pellworm.
Seasonal Strategies for Maximizing Profit
- Peak Season: Maximize revenue through premium pricing and potentially longer minimum stays. Ensure high availability.
- Low Season: Offer competitive pricing, special promotions (e.g., extended stay discounts), and flexible cancellation policies. Target off-season travelers like remote workers or budget-conscious guests.
- Shoulder Seasons: Implement dynamic pricing that balances peak and low rates. Target weekend travelers or specific events. Offer slightly more flexible terms than peak season.
- Regularly analyze your own performance against these Pellworm seasonality benchmarks and adjust your pricing and availability strategy accordingly.
Best Areas for Airbnb Investment in Pellworm (2026)
Exploring the top neighborhoods for short-term rentals in Pellworm? This section highlights key areas, outlining why they are attractive for hosts and guests, along with notable local attractions. Consider these locations based on your target guest profile and investment strategy.
| Neighborhood / Area | Why Host Here? (Target Guests & Appeal) | Key Attractions & Landmarks |
|---|---|---|
| Pellworm North Beach | Stunning coastal area known for its picturesque views and serene environment. Ideal for tourists looking for a beach getaway and nature lovers wanting to explore the Wadden Sea. | Pellworm Lighthouse, Pellworm Risk, Wadden Sea National Park, Küsten-Kraftwerk, Beach sports activities |
| Pellworm Village | Charming village showcasing local culture and traditions. Great for families and those interested in a more authentic German experience. | Local shops and restaurants, Pellworm Church, Farms and rural scenery, Community events, Cycling paths |
| Boat Harbor | Popular area for water sports enthusiasts and nature lovers. Offers activities such as sailing and cycling through beautiful landscapes. | Marina facilities, Sailing tours, Wadden Sea access, Scenic bike routes, Fishing opportunities |
| West Coast Trail | Ideal for hikers and outdoor enthusiasts, this area offers beautiful trails with stunning views of the coastline and diverse wildlife. | Hiking trails, Birdwatching spots, Dune landscapes, Picnic areas, Scenic viewpoints |
| Pellworm Nature Reserve | A protected area rich in ecosystems that attracts nature lovers and photographers. A perfect retreat for those seeking tranquility and wildlife observation. | Wildlife watching, Photography spots, Nature walks, Herb garden, Information centers |
| Pellworm Ferry Terminal | Key transit point for visitors, making it convenient for tourists to access Pellworm and surrounding areas. | Ferry services to the mainland, Nearby cafes and shops, Transportation hub, Local events, Scenic views |
| Iversand Dunes | A unique geographical feature attracting tourists interested in geology and natural beauty. Offers opportunities for exploration and learning. | Dune exploration, Educational tours, Breathtaking views, Flora and fauna, Picnic spots |
| Historic Sheepfolds | Showcases traditional Pellworm architecture and farming practices. Attracts tourists interested in history and culture. | Cultural heritage sites, Local history exhibits, Guided tours, Agriculture experiences, Community interactions |
Understanding Airbnb License Requirements & STR Laws in Pellworm (2026)
While Pellworm, Schleswig-Holstein, Germany currently shows low STR regulations, specific Airbnb license requirements might still exist or change. Always verify the latest short term rental regulations and Airbnb license requirements directly with local government authorities for Pellworm to ensure full compliance before hosting.
(Source: AirROI data, 2026, finding no licensed listings among those analyzed)
Top Performing Airbnb Properties in Pellworm (2026)
Benchmark your potential! Explore examples of top-performing Airbnb properties in Pellwormbased on Trailing Twelve Month (TTM) revenue. Analyze their characteristics, revenue, occupancy rate, and ADR to understand what drives success in this market.
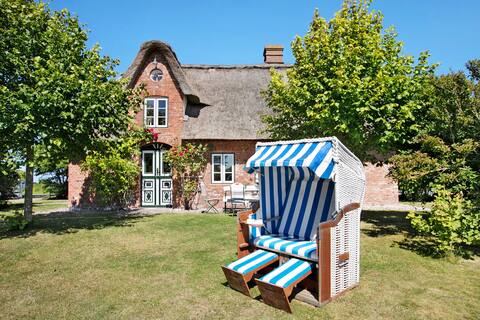
Pellwormhäuschen
Entire Place • 3 bedrooms

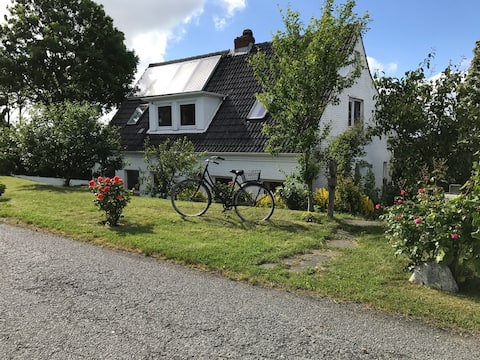
Rickmer's Hoff Apartment No. 1
Entire Place • 6 bedrooms
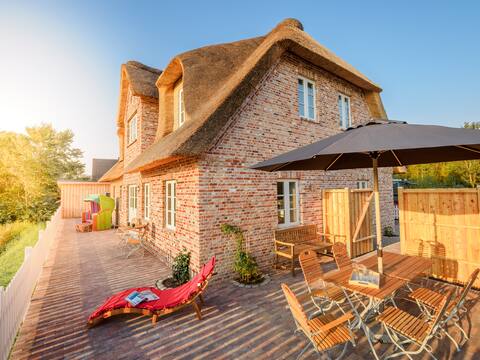
Lovingly furnished house
Entire Place • 4 bedrooms
Hermine | Elegant thatched roof house with fireplace & sauna
Entire Place • 1 bedroom

Shepherd's wagon meadow lodge
Entire Place • 2 bedrooms

Tede Warft Apartment No. 1
Entire Place • 2 bedrooms
Note: Performance varies based on location, size, amenities, seasonality, and management quality. Data reflects the past 12 months.
Top Performing Airbnb Hosts in Pellworm (2026)
Learn from the best! This table showcases top-performing Airbnb hosts in Pellworm based on the number of properties managed and estimated total revenue over the past year. Analyze their scale and performance metrics.
| Host Name | Properties | Grossing Revenue | Stay Reviews | Avg Rating |
|---|---|---|---|---|
| Seegatten | 14 | $197,194 | 82 | 4.91/5.0 |
| Gud Jard Resort | 12 | $122,216 | 22 | 5.00/5.0 |
| Christina | 11 | $109,543 | 39 | 5.00/5.0 |
| Vitalij | 13 | $51,168 | 107 | 4.95/5.0 |
| Holidu | 1 | $45,190 | 16 | 5.00/5.0 |
| Donata | 3 | $40,201 | 68 | 4.91/5.0 |
| Jennifer | 2 | $32,580 | 197 | 4.95/5.0 |
| Jana | 1 | $30,947 | 39 | 4.79/5.0 |
| Ingrid | 1 | $18,147 | 53 | 4.91/5.0 |
| Claire | 1 | $15,465 | 78 | 4.99/5.0 |
Analyzing the strategies of top hosts, such as their property selection, pricing, and guest communication, can offer valuable lessons for optimizing your own Airbnb operations in Pellworm.
Dive Deeper: Advanced Pellworm STR Market Data (2026)
Ready to unlock more insights? AirROI provides access to advanced metrics and comprehensive Airbnb data for Pellworm. Explore detailed analytics beyond this report to refine your investment strategy, optimize pricing, and maximize your vacation rental profits.
Explore Advanced MetricsPellworm Short-Term Rental Market Composition (2026): Property & Room Types
Room Type Distribution
Property Type Distribution
Market Composition Insights for Pellworm
- The Pellworm Airbnb market composition is heavily skewed towards Entire Home/Apt listings, which make up 98.5% of the 66 active rentals. This indicates strong guest preference for privacy and space.
- Looking at the property type distribution in Pellworm, Apartment/Condo properties are the most common (57.6%), reflecting the local real estate landscape.
- Houses represent a significant 39.4% portion, catering likely to families or larger groups.
- Smaller segments like unique stays (combined 3.0%) offer potential for unique stay experiences.
Pellworm Airbnb Room Capacity Analysis (2026): Bedroom Distribution
Distribution of Listings by Number of Bedrooms
Room Capacity Insights for Pellworm
- The dominant room capacity in Pellworm is 2 bedrooms listings, making up 37.9% of the market. This suggests a strong demand for properties suitable for couples or solo travelers.
- Together, 2 bedrooms and 1 bedroom properties represent 75.8% of the active Airbnb listings in Pellworm, indicating a high concentration in these sizes.
Pellworm Vacation Rental Guest Capacity Trends (2026)
Distribution of Listings by Guest Capacity
Guest Capacity Insights for Pellworm
- The most common guest capacity trend in Pellworm vacation rentals is listings accommodating 2 guests (37.9%). This suggests the primary traveler segment is likely couples or solo travelers.
- Properties designed for 2 guests and 4 guests dominate the Pellworm STR market, accounting for 62.1% of listings.
- 18.2% of properties accommodate 6+ guests, serving the market segment for larger families or group travel in Pellworm.
- On average, properties in Pellworm are equipped to host 3.9 guests.
Pellworm Airbnb Booking Patterns (2026): Available vs. Booked Days
Available Days Distribution
Booked Days Distribution
Booking Pattern Insights for Pellworm
- The most common availability pattern in Pellworm falls within the 271-366 days range, representing 80.3% of listings. This suggests many properties have significant open periods on their calendars.
- Approximately 93.9% of listings show high availability (181+ days open annually), indicating potential for increased bookings or specific owner usage patterns.
- For booked days, the 31-90 days range is most frequent in Pellworm (62.1%), reflecting common guest stay durations or potential owner blocking patterns.
- A notable 6.1% of properties secure long booking periods (181+ days booked per year), highlighting successful long-term rental strategies or significant owner usage.
Pellworm Airbnb Minimum Stay Requirements Analysis
Distribution of Listings by Minimum Night Requirement
1 Night
2 listings
3% of total
2 Nights
3 listings
4.5% of total
3 Nights
13 listings
19.7% of total
4-6 Nights
16 listings
24.2% of total
7-29 Nights
1 listings
1.5% of total
30+ Nights
31 listings
47% of total
Key Insights
- The most prevalent minimum stay requirement in Pellworm is 30+ Nights, adopted by 47% of listings. This highlights the market's preference for longer commitments.
- Very short stays (1-2 nights) are less common (7.5%), suggesting hosts prefer slightly longer bookings to optimize turnover.
- A significant segment (47%) caters to monthly stays (30+ nights) in Pellworm, pointing to opportunities in the extended-stay market.
Recommendations
- Align with the market by considering a 30+ Nights minimum stay, as 47% of Pellworm hosts use this setting.
- If feasible, allowing 1-night stays, especially midweek or during low season, could capture last-minute bookings, as only 3% currently do.
- Explore offering discounts for stays of 30+ nights to attract the 47% of the market seeking extended stays.
- Adjust minimum nights based on seasonality – potentially shorter during low season and longer during peak demand periods in Pellworm.
Pellworm Airbnb Cancellation Policy Trends Analysis (2026)
Super Strict 30 Days
15 listings
22.7% of total
Flexible
6 listings
9.1% of total
Moderate
5 listings
7.6% of total
Firm
29 listings
43.9% of total
Strict
11 listings
16.7% of total
Cancellation Policy Insights for Pellworm
- The prevailing Airbnb cancellation policy trend in Pellworm is Firm, used by 43.9% of listings.
- A majority (60.6%) of hosts in Pellworm utilize Firm or Strict policies, indicating a market where hosts prioritize booking security.
Recommendations for Hosts
- Consider adopting a Firm policy to align with the 43.9% market standard in Pellworm.
- Regularly review your cancellation policy against competitors and market demand shifts in Pellworm.
Pellworm STR Booking Lead Time Analysis (2026)
Average Booking Lead Time by Month
Booking Lead Time Insights for Pellworm
- The overall average booking lead time for vacation rentals in Pellworm is 102 days.
- Guests book furthest in advance for stays during December (average 122 days), likely coinciding with peak travel demand or local events.
- The shortest booking windows occur for stays in February (average 61 days), indicating more last-minute travel plans during this time.
- Seasonally, Summer (99 days avg.) sees the longest lead times, while Fall (73 days avg.) has the shortest, reflecting typical travel planning cycles.
Recommendations for Hosts
- Use the overall average lead time (102 days) as a baseline for your pricing and availability strategy in Pellworm.
- For December stays, consider implementing length-of-stay discounts or slightly higher rates for bookings made less than 122 days out to capitalize on advance planning.
- Target marketing efforts for the Summer season well in advance (at least 99 days) to capture early planners.
- Monitor your own booking lead times against these Pellworm averages to identify opportunities for dynamic pricing adjustments.
Popular & Essential Airbnb Amenities in Pellworm (2026)
Amenity Prevalence
Amenity Insights for Pellworm
- Essential amenities in Pellworm that guests expect include: Wifi, Coffee maker, Refrigerator. Lacking these (any) could significantly impact bookings.
- Popular amenities like Hair dryer, Kitchen, Dishwasher are common but not universal. Offering these can provide a competitive edge.
Recommendations for Hosts
- Ensure your listing includes all essential amenities for Pellworm: Wifi, Coffee maker, Refrigerator.
- Prioritize adding missing essentials: Coffee maker, Refrigerator.
- Consider adding popular differentiators like Hair dryer or Kitchen to increase appeal.
- Highlight unique or less common amenities you offer (e.g., hot tub, dedicated workspace, EV charger) in your listing description and photos.
- Regularly check competitor amenities in Pellworm to stay competitive.
Pellworm Airbnb Guest Demographics & Profile Analysis (2026)
Guest Profile Summary for Pellworm
- The typical guest profile for Airbnb in Pellworm consists of primarily domestic travelers (94%), often arriving from nearby Hamburg, typically belonging to the Post-2000s (Gen Z/Alpha) group (50%), primarily speaking German or English.
- Domestic travelers account for 93.9% of guests.
- Key international markets include Germany (93.9%) and Switzerland (2%).
- Top languages spoken are German (39.8%) followed by English (38.7%).
- A significant demographic segment is the Post-2000s (Gen Z/Alpha) group, representing 50% of guests.
Recommendations for Hosts
- Target domestic marketing efforts towards travelers from Hamburg and Berlin.
- Tailor amenities and listing descriptions to appeal to the dominant Post-2000s (Gen Z/Alpha) demographic (e.g., highlight fast WiFi, smart home features, local guides).
- Highlight unique local experiences or amenities relevant to the primary guest profile.
- Consider seasonal promotions aligned with peak travel times for key origin markets.
Nearby Short-Term Rental Market Comparison
How does the Pellworm Airbnb market stack up against its neighbors? Compare key performance metrics like average monthly revenue, ADR, and occupancy rates in surrounding areas to understand the broader regional STR landscape.
| Market | Active Properties | Monthly Revenue | Daily Rate | Avg. Occupancy |
|---|---|---|---|---|
| Husum-Ballum | 13 | $4,837 | $499.93 | 44% |
| Blåvand | 16 | $2,374 | $318.93 | 40% |
| Helgoland | 11 | $2,199 | $167.07 | 58% |
| Billund | 105 | $2,027 | $194.14 | 46% |
| Vlagtwedde | 38 | $2,018 | $352.87 | 31% |
| Oberndorf | 10 | $1,872 | $186.86 | 28% |
| Tetenbüll | 29 | $1,849 | $238.36 | 34% |
| Hamburg | 2,515 | $1,836 | $157.66 | 49% |
| Kampen (Sylt) | 25 | $1,824 | $508.88 | 23% |
| Brake | 19 | $1,755 | $136.43 | 46% |