Niebüll Airbnb Market Analysis 2026: Short Term Rental Data & Vacation Rental Statistics in Schleswig-Holstein, Germany
Is Airbnb profitable in Niebüll in 2026? Explore comprehensive Airbnb analytics for Niebüll, Schleswig-Holstein, Germany to uncover income potential. This 2026 STR market report for Niebüll, based on AirROI data from February 2025 to January 2026, reveals key trends in the niche market of 39 active listings.
Whether you're considering an Airbnb investment in Niebüll, optimizing your existing vacation rental, or exploring rental arbitrage opportunities, understanding the Niebüll Airbnb data is crucial. Leveraging the low regulation environment is key to maximizing your short term rental income potential. Let's dive into the specifics.
Key Niebüll Airbnb Performance Metrics Overview
Monthly Airbnb Revenue Variations & Income Potential in Niebüll (2026)
Understanding the monthly revenue variations for Airbnb listings in Niebüll is key to maximizing your short term rental income potential. Seasonality significantly impacts earnings. Our analysis, based on data from the past 12 months, shows that the peak revenue month for STRs in Niebüll is typically August, while January often presents the lowest earnings, highlighting opportunities for strategic pricing adjustments during shoulder and low seasons. Explore the typical Airbnb income in Niebüll across different performance tiers:
- Best-in-class properties (Top 10%) achieve $2,392+ monthly, often utilizing dynamic pricing and superior guest experiences.
- Strong performing properties (Top 25%) earn $1,575 or more, indicating effective management and desirable locations/amenities.
- Typical properties (Median) generate around $856 per month, representing the average market performance.
- Entry-level properties (Bottom 25%) see earnings around $455, often with potential for optimization.
Average Monthly Airbnb Earnings Trend in Niebüll
Niebüll Airbnb Occupancy Rate Trends (2026)
Maximize your bookings by understanding the Niebüll STR occupancy trends. Seasonal demand shifts significantly influence how often properties are booked. Typically, Augustsees the highest demand (peak season occupancy), while January experiences the lowest (low season). Effective strategies, like adjusting minimum stays or offering promotions, can boost occupancy during slower periods. Here's how different property tiers perform in Niebüll:
- Best-in-class properties (Top 10%) achieve 71%+ occupancy, indicating high desirability and potentially optimized availability.
- Strong performing properties (Top 25%) maintain 54% or higher occupancy, suggesting good market fit and guest satisfaction.
- Typical properties (Median) have an occupancy rate around 35%.
- Entry-level properties (Bottom 25%) average 18% occupancy, potentially facing higher vacancy.
Average Monthly Occupancy Rate Trend in Niebüll
Average Daily Rate (ADR) Airbnb Trends in Niebüll (2026)
Effective short term rental pricing strategy in Niebüll involves understanding monthly ADR fluctuations. The Average Daily Rate (ADR) for Airbnb in Niebüll typically peaks in January and dips lowest during March. Leveraging Airbnb dynamic pricing tools or strategies based on this seasonality can significantly boost revenue. Here's a look at the typical nightly rates achieved:
- Best-in-class properties (Top 10%) command rates of $172+ per night, often due to premium features or locations.
- Strong performing properties (Top 25%) achieve nightly rates of $139 or more.
- Typical properties (Median) charge around $105 per night.
- Entry-level properties (Bottom 25%) earn around $66 per night.
Average Daily Rate (ADR) Trend by Month in Niebüll
Get Live Niebüll Market Intelligence 👇

Explore Real-time Analytics
Airbnb Seasonality Analysis & Trends in Niebüll (2026)
Peak Season (August, September, July)
- Revenue averages $1,640 per month
- Occupancy rates average 53.6%
- Daily rates average $109
Shoulder Season
- Revenue averages $1,059 per month
- Occupancy maintains around 36.3%
- Daily rates hold near $108
Low Season (January, February, May)
- Revenue drops to average $633 per month
- Occupancy decreases to average 23.3%
- Daily rates adjust to average $107
Seasonality Insights for Niebüll
- The Airbnb seasonality in Niebüll shows highly seasonal trends requiring careful strategy. While the sections above show seasonal averages, it's also insightful to look at the extremes:
- During the high season, the absolute peak month showcases Niebüll's highest earning potential, with monthly revenues capable of climbing to $1,968, occupancy reaching a high of 60.4%, and ADRs peaking at $124.
- Conversely, the slowest single month of the year, typically falling within the low season, marks the market's lowest point. In this month, revenue might dip to $501, occupancy could drop to 15.9%, and ADRs may adjust down to $93.
- Understanding both the seasonal averages and these monthly peaks and troughs in revenue, occupancy, and ADR is crucial for maximizing your Airbnb profit potential in Niebüll.
Seasonal Strategies for Maximizing Profit
- Peak Season: Maximize revenue through premium pricing and potentially longer minimum stays. Ensure high availability.
- Low Season: Offer competitive pricing, special promotions (e.g., extended stay discounts), and flexible cancellation policies. Target off-season travelers like remote workers or budget-conscious guests.
- Shoulder Seasons: Implement dynamic pricing that balances peak and low rates. Target weekend travelers or specific events. Offer slightly more flexible terms than peak season.
- Regularly analyze your own performance against these Niebüll seasonality benchmarks and adjust your pricing and availability strategy accordingly.
Best Areas for Airbnb Investment in Niebüll (2026)
Exploring the top neighborhoods for short-term rentals in Niebüll? This section highlights key areas, outlining why they are attractive for hosts and guests, along with notable local attractions. Consider these locations based on your target guest profile and investment strategy.
| Neighborhood / Area | Why Host Here? (Target Guests & Appeal) | Key Attractions & Landmarks |
|---|---|---|
| Niebüll City Center | The hub of local commerce with access to shops, restaurants, and public transport. Perfect for visitors interested in experiencing the local culture and cuisine. | Niebüll Market Square, St. John's Church, Local shops and cafes, Niebüll Railway Station |
| Nearby North Sea Coast | Proximity to the North Sea, attracting visitors for beach activities and nature. Ideal for beach lovers and families. | Schluchsee Beach, Westerhever Lighthouse, North Sea mudflat hiking, Outdoor sports activities |
| Bökingharde Nature Reserve | A natural escape offering hiking trails and wildlife observation, appealing to eco-tourists and nature enthusiasts. | Hiking trails, Bird watching, Scenic views, Nature photography opportunities |
| Sylt Island Access | Easy access to the popular vacation destination of Sylt, appealing to tourists looking for upscale beach vacations. | Sylt Beach, Wattenmeer National Park, Local seafood restaurants, Cultural festivals |
| Historic Niebüll | Rich in history with traditional architecture, attracting visitors interested in cultural heritage and history. | Local museums, Historical buildings, Cultural events |
| Westerland | Another vibrant beach town nearby with lively promenades and entertainment. Popular with tourists during the summer season. | Westerland Beach, Shopping street, Water sports, Restaurants and nightlife |
| Dagebüll | Famous for its ferry to the islands and beautiful coastal views, attracting visitors who want to explore the North Frisian Islands. | Ferry to Föhr and Amrum, Dagebüll Beach, Scenic coastal paths, Dining options by the sea |
| Family-Friendly Areas | Neighborhoods that cater specifically to families with children, providing kid-friendly amenities and nearby attractions. | Playgrounds, Family-oriented events, Close to nature parks, Kid-friendly restaurants |
Understanding Airbnb License Requirements & STR Laws in Niebüll (2026)
While Niebüll, Schleswig-Holstein, Germany currently shows low STR regulations, specific Airbnb license requirements might still exist or change. Always verify the latest short term rental regulations and Airbnb license requirements directly with local government authorities for Niebüll to ensure full compliance before hosting.
(Source: AirROI data, 2026, finding no licensed listings among those analyzed)
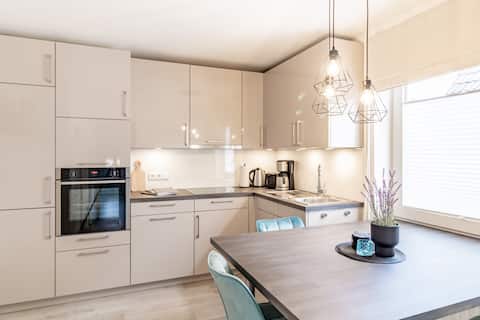
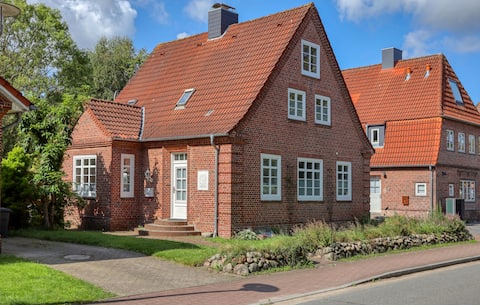
Top Performing Airbnb Properties in Niebüll (2026)
Benchmark your potential! Explore examples of top-performing Airbnb properties in Niebüllbased on Trailing Twelve Month (TTM) revenue. Analyze their characteristics, revenue, occupancy rate, and ADR to understand what drives success in this market.

Feel-good moments by the lake with fantastic views
Entire Place • 1 bedroom
Küstenkoje vacation home in Niebüll
Entire Place • 3 bedrooms

Living under thatch 2
Entire Place • 2 bedrooms
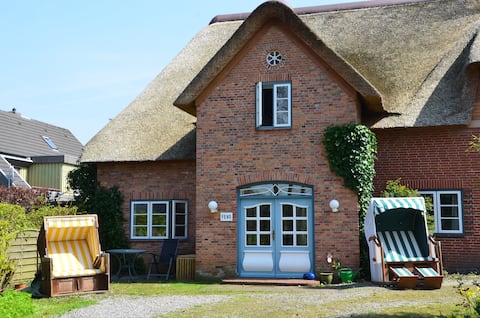
Vacation in the thatched roof house 1
Entire Place • 1 bedroom

Outdoor thatched roof, interior unique design
Entire Place • 2 bedrooms
Haus Rike
Entire Place • 1 bedroom
Note: Performance varies based on location, size, amenities, seasonality, and management quality. Data reflects the past 12 months.
Top Performing Airbnb Hosts in Niebüll (2026)
Learn from the best! This table showcases top-performing Airbnb hosts in Niebüll based on the number of properties managed and estimated total revenue over the past year. Analyze their scale and performance metrics.
| Host Name | Properties | Grossing Revenue | Stay Reviews | Avg Rating |
|---|---|---|---|---|
| Claudia Anne | 3 | $62,412 | 140 | 4.90/5.0 |
| Ute | 1 | $31,389 | 147 | 4.99/5.0 |
| Alexandra | 1 | $30,402 | 19 | 5.00/5.0 |
| Alex | 2 | $23,239 | 29 | 4.37/5.0 |
| Matthias | 2 | $20,147 | 2 | Not Rated |
| Sina | 1 | $19,882 | 169 | 4.88/5.0 |
| Boy | 6 | $18,542 | 86 | 4.94/5.0 |
| Novasol | 1 | $18,518 | 3 | 4.33/5.0 |
| Alexandra | 3 | $16,875 | 85 | 4.79/5.0 |
| Chantal | 1 | $14,232 | 46 | 4.96/5.0 |
Analyzing the strategies of top hosts, such as their property selection, pricing, and guest communication, can offer valuable lessons for optimizing your own Airbnb operations in Niebüll.
Dive Deeper: Advanced Niebüll STR Market Data (2026)
Ready to unlock more insights? AirROI provides access to advanced metrics and comprehensive Airbnb data for Niebüll. Explore detailed analytics beyond this report to refine your investment strategy, optimize pricing, and maximize your vacation rental profits.
Explore Advanced MetricsNiebüll Short-Term Rental Market Composition (2026): Property & Room Types
Room Type Distribution
Property Type Distribution
Market Composition Insights for Niebüll
- The Niebüll Airbnb market composition is heavily skewed towards Entire Home/Apt listings, which make up 64.1% of the 39 active rentals. This indicates strong guest preference for privacy and space.
- However, a notable 35.9% share for Private Rooms suggests opportunities for budget-conscious travelers or hosts renting out spare rooms.
- Looking at the property type distribution in Niebüll, House properties are the most common (56.4%), reflecting the local real estate landscape.
- Houses represent a significant 56.4% portion, catering likely to families or larger groups.
Niebüll Airbnb Room Capacity Analysis (2026): Bedroom Distribution
Distribution of Listings by Number of Bedrooms
Room Capacity Insights for Niebüll
- The dominant room capacity in Niebüll is 1 bedroom listings, making up 33.3% of the market. This suggests a strong demand for properties suitable for couples or solo travelers.
- Together, 1 bedroom and 2 bedrooms properties represent 56.4% of the active Airbnb listings in Niebüll, indicating a high concentration in these sizes.
Niebüll Vacation Rental Guest Capacity Trends (2026)
Distribution of Listings by Guest Capacity
Guest Capacity Insights for Niebüll
- The most common guest capacity trend in Niebüll vacation rentals is listings accommodating 4 guests (23.1%). This suggests the primary traveler segment is likely small families or groups.
- Properties designed for 4 guests and 2 guests dominate the Niebüll STR market, accounting for 43.6% of listings.
- On average, properties in Niebüll are equipped to host 2.2 guests.
Niebüll Airbnb Booking Patterns (2026): Available vs. Booked Days
Available Days Distribution
Booked Days Distribution
Booking Pattern Insights for Niebüll
- The most common availability pattern in Niebüll falls within the 271-366 days range, representing 48.7% of listings. This suggests many properties have significant open periods on their calendars.
- Approximately 84.6% of listings show high availability (181+ days open annually), indicating potential for increased bookings or specific owner usage patterns.
- For booked days, the 91-180 days range is most frequent in Niebüll (41%), reflecting common guest stay durations or potential owner blocking patterns.
- A notable 15.4% of properties secure long booking periods (181+ days booked per year), highlighting successful long-term rental strategies or significant owner usage.
Niebüll Airbnb Minimum Stay Requirements Analysis
Distribution of Listings by Minimum Night Requirement
1 Night
10 listings
25.6% of total
2 Nights
4 listings
10.3% of total
3 Nights
2 listings
5.1% of total
4-6 Nights
8 listings
20.5% of total
30+ Nights
15 listings
38.5% of total
Key Insights
- The most prevalent minimum stay requirement in Niebüll is 30+ Nights, adopted by 38.5% of listings. This highlights the market's preference for longer commitments.
- A significant segment (38.5%) caters to monthly stays (30+ nights) in Niebüll, pointing to opportunities in the extended-stay market.
Recommendations
- Align with the market by considering a 30+ Nights minimum stay, as 38.5% of Niebüll hosts use this setting.
- If feasible, allowing 1-night stays, especially midweek or during low season, could capture last-minute bookings, as only 25.6% currently do.
- Explore offering discounts for stays of 30+ nights to attract the 38.5% of the market seeking extended stays.
- Adjust minimum nights based on seasonality – potentially shorter during low season and longer during peak demand periods in Niebüll.
Niebüll Airbnb Cancellation Policy Trends Analysis (2026)
Super Strict 60 Days
2 listings
5.1% of total
Super Strict 30 Days
1 listings
2.6% of total
Flexible
14 listings
35.9% of total
Moderate
15 listings
38.5% of total
Firm
7 listings
17.9% of total
Cancellation Policy Insights for Niebüll
- The prevailing Airbnb cancellation policy trend in Niebüll is Moderate, used by 38.5% of listings.
- The market strongly favors guest-friendly terms, with 74.4% of listings offering Flexible or Moderate policies. This suggests guests in Niebüll may expect booking flexibility.
Recommendations for Hosts
- Consider adopting a Moderate policy to align with the 38.5% market standard in Niebüll.
- Regularly review your cancellation policy against competitors and market demand shifts in Niebüll.
Niebüll STR Booking Lead Time Analysis (2026)
Average Booking Lead Time by Month
Booking Lead Time Insights for Niebüll
- The overall average booking lead time for vacation rentals in Niebüll is 53 days.
- Guests book furthest in advance for stays during December (average 74 days), likely coinciding with peak travel demand or local events.
- The shortest booking windows occur for stays in February (average 22 days), indicating more last-minute travel plans during this time.
- Seasonally, Summer (60 days avg.) sees the longest lead times, while Spring (37 days avg.) has the shortest, reflecting typical travel planning cycles.
Recommendations for Hosts
- Use the overall average lead time (53 days) as a baseline for your pricing and availability strategy in Niebüll.
- For December stays, consider implementing length-of-stay discounts or slightly higher rates for bookings made less than 74 days out to capitalize on advance planning.
- Target marketing efforts for the Summer season well in advance (at least 60 days) to capture early planners.
- Monitor your own booking lead times against these Niebüll averages to identify opportunities for dynamic pricing adjustments.
Popular & Essential Airbnb Amenities in Niebüll (2026)
Amenity Prevalence
Amenity Insights for Niebüll
- Essential amenities in Niebüll that guests expect include: Wifi. Lacking these (this) could significantly impact bookings.
- Popular amenities like Smoke alarm, Heating, Kitchen are common but not universal. Offering these can provide a competitive edge.
Recommendations for Hosts
- Ensure your listing includes all essential amenities for Niebüll: Wifi.
- Prioritize adding missing essentials: Wifi.
- Consider adding popular differentiators like Smoke alarm or Heating to increase appeal.
- Highlight unique or less common amenities you offer (e.g., hot tub, dedicated workspace, EV charger) in your listing description and photos.
- Regularly check competitor amenities in Niebüll to stay competitive.
Niebüll Airbnb Guest Demographics & Profile Analysis (2026)
Guest Profile Summary for Niebüll
- The typical guest profile for Airbnb in Niebüll consists of primarily domestic travelers (75%), often arriving from nearby Hamburg, typically belonging to the Post-2000s (Gen Z/Alpha) group (50%), primarily speaking English or German.
- Domestic travelers account for 74.7% of guests.
- Key international markets include Germany (74.7%) and Denmark (4.8%).
- Top languages spoken are English (39.3%) followed by German (36%).
- A significant demographic segment is the Post-2000s (Gen Z/Alpha) group, representing 50% of guests.
Recommendations for Hosts
- Target domestic marketing efforts towards travelers from Hamburg and Berlin.
- Tailor amenities and listing descriptions to appeal to the dominant Post-2000s (Gen Z/Alpha) demographic (e.g., highlight fast WiFi, smart home features, local guides).
- Highlight unique local experiences or amenities relevant to the primary guest profile.
- Consider seasonal promotions aligned with peak travel times for key origin markets.
Nearby Short-Term Rental Market Comparison
How does the Niebüll Airbnb market stack up against its neighbors? Compare key performance metrics like average monthly revenue, ADR, and occupancy rates in surrounding areas to understand the broader regional STR landscape.
| Market | Active Properties | Monthly Revenue | Daily Rate | Avg. Occupancy |
|---|---|---|---|---|
| Husum-Ballum | 13 | $4,837 | $499.93 | 44% |
| Blåvand | 16 | $2,374 | $318.93 | 40% |
| Helgoland | 11 | $2,199 | $167.07 | 58% |
| Billund | 105 | $2,027 | $194.14 | 46% |
| Vlagtwedde | 38 | $2,018 | $352.87 | 31% |
| Oberndorf | 10 | $1,872 | $186.86 | 28% |
| Tetenbüll | 29 | $1,849 | $238.36 | 34% |
| Hamburg | 2,515 | $1,836 | $157.66 | 49% |
| Kampen (Sylt) | 25 | $1,824 | $508.88 | 23% |
| Brake | 19 | $1,755 | $136.43 | 46% |