Husum Airbnb Market Analysis 2026: Short Term Rental Data & Vacation Rental Statistics in Schleswig-Holstein, Germany
Is Airbnb profitable in Husum in 2026? Explore comprehensive Airbnb analytics for Husum, Schleswig-Holstein, Germany to uncover income potential. This 2026 STR market report for Husum, based on AirROI data from February 2025 to January 2026, reveals key trends in the niche market of 103 active listings.
Whether you're considering an Airbnb investment in Husum, optimizing your existing vacation rental, or exploring rental arbitrage opportunities, understanding the Husum Airbnb data is crucial. Leveraging the low regulation environment is key to maximizing your short term rental income potential. Let's dive into the specifics.
Key Husum Airbnb Performance Metrics Overview
Monthly Airbnb Revenue Variations & Income Potential in Husum (2026)
Understanding the monthly revenue variations for Airbnb listings in Husum is key to maximizing your short term rental income potential. Seasonality significantly impacts earnings. Our analysis, based on data from the past 12 months, shows that the peak revenue month for STRs in Husum is typically August, while January often presents the lowest earnings, highlighting opportunities for strategic pricing adjustments during shoulder and low seasons. Explore the typical Airbnb income in Husum across different performance tiers:
- Best-in-class properties (Top 10%) achieve $3,085+ monthly, often utilizing dynamic pricing and superior guest experiences.
- Strong performing properties (Top 25%) earn $2,112 or more, indicating effective management and desirable locations/amenities.
- Typical properties (Median) generate around $1,331 per month, representing the average market performance.
- Entry-level properties (Bottom 25%) see earnings around $764, often with potential for optimization.
Average Monthly Airbnb Earnings Trend in Husum
Husum Airbnb Occupancy Rate Trends (2026)
Maximize your bookings by understanding the Husum STR occupancy trends. Seasonal demand shifts significantly influence how often properties are booked. Typically, Augustsees the highest demand (peak season occupancy), while January experiences the lowest (low season). Effective strategies, like adjusting minimum stays or offering promotions, can boost occupancy during slower periods. Here's how different property tiers perform in Husum:
- Best-in-class properties (Top 10%) achieve 81%+ occupancy, indicating high desirability and potentially optimized availability.
- Strong performing properties (Top 25%) maintain 65% or higher occupancy, suggesting good market fit and guest satisfaction.
- Typical properties (Median) have an occupancy rate around 46%.
- Entry-level properties (Bottom 25%) average 25% occupancy, potentially facing higher vacancy.
Average Monthly Occupancy Rate Trend in Husum
Average Daily Rate (ADR) Airbnb Trends in Husum (2026)
Effective short term rental pricing strategy in Husum involves understanding monthly ADR fluctuations. The Average Daily Rate (ADR) for Airbnb in Husum typically peaks in January and dips lowest during February. Leveraging Airbnb dynamic pricing tools or strategies based on this seasonality can significantly boost revenue. Here's a look at the typical nightly rates achieved:
- Best-in-class properties (Top 10%) command rates of $221+ per night, often due to premium features or locations.
- Strong performing properties (Top 25%) achieve nightly rates of $171 or more.
- Typical properties (Median) charge around $127 per night.
- Entry-level properties (Bottom 25%) earn around $92 per night.
Average Daily Rate (ADR) Trend by Month in Husum
Get Live Husum Market Intelligence 👇

Explore Real-time Analytics
Airbnb Seasonality Analysis & Trends in Husum (2026)
Peak Season (August, July, September)
- Revenue averages $2,198 per month
- Occupancy rates average 60.3%
- Daily rates average $144
Shoulder Season
- Revenue averages $1,558 per month
- Occupancy maintains around 45.7%
- Daily rates hold near $138
Low Season (January, February, March)
- Revenue drops to average $960 per month
- Occupancy decreases to average 32.9%
- Daily rates adjust to average $141
Seasonality Insights for Husum
- The Airbnb seasonality in Husum shows highly seasonal trends requiring careful strategy. While the sections above show seasonal averages, it's also insightful to look at the extremes:
- During the high season, the absolute peak month showcases Husum's highest earning potential, with monthly revenues capable of climbing to $2,328, occupancy reaching a high of 64.5%, and ADRs peaking at $183.
- Conversely, the slowest single month of the year, typically falling within the low season, marks the market's lowest point. In this month, revenue might dip to $809, occupancy could drop to 22.1%, and ADRs may adjust down to $119.
- Understanding both the seasonal averages and these monthly peaks and troughs in revenue, occupancy, and ADR is crucial for maximizing your Airbnb profit potential in Husum.
Seasonal Strategies for Maximizing Profit
- Peak Season: Maximize revenue through premium pricing and potentially longer minimum stays. Ensure high availability.
- Low Season: Offer competitive pricing, special promotions (e.g., extended stay discounts), and flexible cancellation policies. Target off-season travelers like remote workers or budget-conscious guests.
- Shoulder Seasons: Implement dynamic pricing that balances peak and low rates. Target weekend travelers or specific events. Offer slightly more flexible terms than peak season.
- Regularly analyze your own performance against these Husum seasonality benchmarks and adjust your pricing and availability strategy accordingly.
Best Areas for Airbnb Investment in Husum (2026)
Exploring the top neighborhoods for short-term rentals in Husum? This section highlights key areas, outlining why they are attractive for hosts and guests, along with notable local attractions. Consider these locations based on your target guest profile and investment strategy.
| Neighborhood / Area | Why Host Here? (Target Guests & Appeal) | Key Attractions & Landmarks |
|---|---|---|
| Husum Harbour | A picturesque area known for its charming marina and seafood restaurants. Ideal for tourists looking to enjoy the sea and local culture, with beautiful views and access to boat trips. | Husum Castle, Theodor Storm Museum, Marienkirche, Husum Harbour, Schleswig-Holstein Wadden Sea National Park |
| Old Town (Altstadt) | The historical heart of Husum with charming streets, colorful houses, and a vibrant local market. A perfect spot for visitors interested in history and local culture. | Market Square (Marktplatz), St. Mary's Church (St. Marienkirche), Old Town Hall, Husum Museum, Weekly Market |
| Badestrand | The beach area of Husum that attracts visitors looking for relaxation and seaside activities. A popular spot for families and beachgoers during the summer. | Husum Beach, Beach Promenade, Water Sports Activities, Picnic Areas, Restaurants by the beach |
| Kunsthalle Husum | An area around the Kunsthalle that attracts art lovers and culture seekers. The art gallery hosts exhibitions that draw visitors from near and far. | Kunsthalle Husum, Surrounding Park, Art Exhibitions, Café in the Kunsthalle, Cultural Events |
| Stadtpark | A green oasis in the city where locals and tourists can relax. Great for families and those looking to enjoy outdoor activities. | Stadtpark Husum, Walking Trails, Playgrounds, Picnic Areas, Seasonal Events |
| Nordstrand (North Beach) | A beautiful coastal area ideal for nature lovers and beach enthusiasts. Popular for its scenery and coastal activities, suitable for outdoor stays. | Nordstrand Beach, Nature Reserves, Coastal Hiking Trails, Bird Watching, Beach Campsites |
| Husum Science Park | An area focused on innovation and technology, appealing to business travelers and those attending conferences or events in Husum. | Science Conferences, Innovative Workshops, Business Facilities, Networking Events, Technology Exhibitions |
| Local Markets and Bistros | The food scene in Husum includes various local markets and bistros that showcase regional cuisine, attracting food lovers. | Husum Weekly Market, Local Bistros, Culinary Tours, Food Festivals, Fresh Produce Stalls |
Understanding Airbnb License Requirements & STR Laws in Husum (2026)
While Husum, Schleswig-Holstein, Germany currently shows low STR regulations, specific Airbnb license requirements might still exist or change. Always verify the latest short term rental regulations and Airbnb license requirements directly with local government authorities for Husum to ensure full compliance before hosting.
(Source: AirROI data, 2026, based on 1% licensed listings)
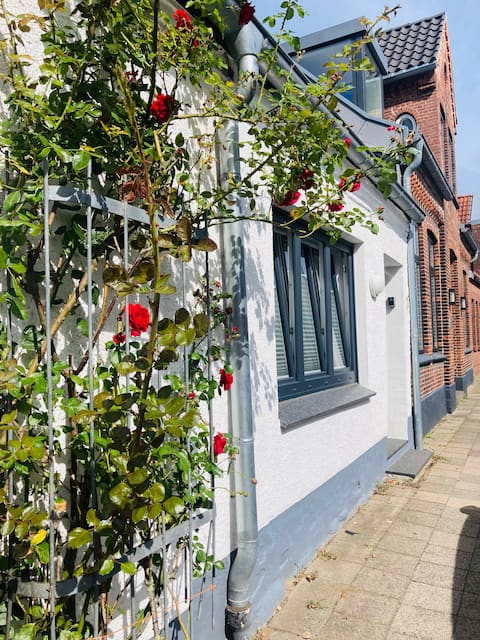
Top Performing Airbnb Properties in Husum (2026)
Benchmark your potential! Explore examples of top-performing Airbnb properties in Husumbased on Trailing Twelve Month (TTM) revenue. Analyze their characteristics, revenue, occupancy rate, and ADR to understand what drives success in this market.
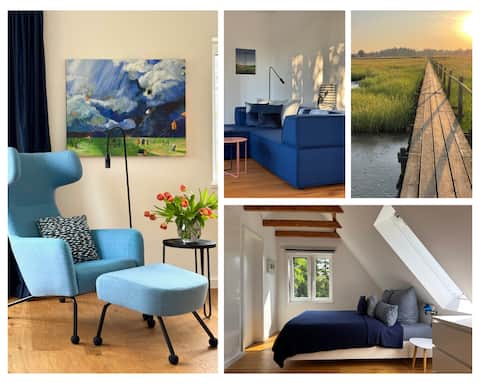
Design with sea view | Quiet & nature | Fireplace
Entire Place • 2 bedrooms

smør. Scandi-style in the warehouse I 1 min to the harbor
Entire Place • 1 bedroom
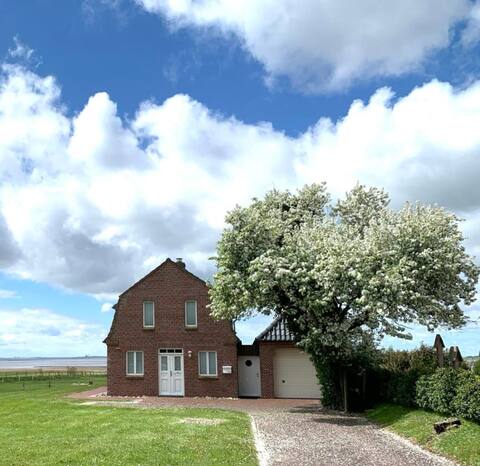
Vacation home with panoramic view
Entire Place • 3 bedrooms

Bellas Patio - Sunny apartment with rooftop terrace
Entire Place • 2 bedrooms

Luxurious vacation home with sauna
Entire Place • 3 bedrooms
Fischerhuus7
Entire Place • 2 bedrooms
Note: Performance varies based on location, size, amenities, seasonality, and management quality. Data reflects the past 12 months.
Top Performing Airbnb Hosts in Husum (2026)
Learn from the best! This table showcases top-performing Airbnb hosts in Husum based on the number of properties managed and estimated total revenue over the past year. Analyze their scale and performance metrics.
| Host Name | Properties | Grossing Revenue | Stay Reviews | Avg Rating |
|---|---|---|---|---|
| Thale | 5 | $114,700 | 260 | 4.87/5.0 |
| Ina | 3 | $92,881 | 151 | 4.86/5.0 |
| Oliver | 8 | $83,190 | 541 | 4.92/5.0 |
| Anja | 4 | $75,111 | 321 | 4.87/5.0 |
| Dietmar | 1 | $55,064 | 24 | 5.00/5.0 |
| Claudia | 2 | $42,740 | 47 | 4.73/5.0 |
| Axel | 1 | $42,695 | 94 | 5.00/5.0 |
| Annkristin | 1 | $39,435 | 47 | 5.00/5.0 |
| Christine | 1 | $38,267 | 73 | 4.89/5.0 |
| Caroline Und Abdeladim | 1 | $36,648 | 33 | 5.00/5.0 |
Analyzing the strategies of top hosts, such as their property selection, pricing, and guest communication, can offer valuable lessons for optimizing your own Airbnb operations in Husum.
Dive Deeper: Advanced Husum STR Market Data (2026)
Ready to unlock more insights? AirROI provides access to advanced metrics and comprehensive Airbnb data for Husum. Explore detailed analytics beyond this report to refine your investment strategy, optimize pricing, and maximize your vacation rental profits.
Explore Advanced MetricsHusum Short-Term Rental Market Composition (2026): Property & Room Types
Room Type Distribution
Property Type Distribution
Market Composition Insights for Husum
- The Husum Airbnb market composition is heavily skewed towards Entire Home/Apt listings, which make up 88.3% of the 103 active rentals. This indicates strong guest preference for privacy and space.
- Looking at the property type distribution in Husum, Apartment/Condo properties are the most common (68%), reflecting the local real estate landscape.
- Houses represent a significant 30.1% portion, catering likely to families or larger groups.
- Smaller segments like hotel/boutique (combined 1.9%) offer potential for unique stay experiences.
Husum Airbnb Room Capacity Analysis (2026): Bedroom Distribution
Distribution of Listings by Number of Bedrooms
Room Capacity Insights for Husum
- The dominant room capacity in Husum is 1 bedroom listings, making up 40.8% of the market. This suggests a strong demand for properties suitable for couples or solo travelers.
- Together, 1 bedroom and 2 bedrooms properties represent 74.8% of the active Airbnb listings in Husum, indicating a high concentration in these sizes.
Husum Vacation Rental Guest Capacity Trends (2026)
Distribution of Listings by Guest Capacity
Guest Capacity Insights for Husum
- The most common guest capacity trend in Husum vacation rentals is listings accommodating 2 guests (35%). This suggests the primary traveler segment is likely couples or solo travelers.
- Properties designed for 2 guests and 4 guests dominate the Husum STR market, accounting for 65.1% of listings.
- 14.6% of properties accommodate 6+ guests, serving the market segment for larger families or group travel in Husum.
- On average, properties in Husum are equipped to host 3.1 guests.
Husum Airbnb Booking Patterns (2026): Available vs. Booked Days
Available Days Distribution
Booked Days Distribution
Booking Pattern Insights for Husum
- The most common availability pattern in Husum falls within the 271-366 days range, representing 43.7% of listings. This suggests many properties have significant open periods on their calendars.
- Approximately 72.8% of listings show high availability (181+ days open annually), indicating potential for increased bookings or specific owner usage patterns.
- For booked days, the 91-180 days range is most frequent in Husum (31.1%), reflecting common guest stay durations or potential owner blocking patterns.
- A notable 27.2% of properties secure long booking periods (181+ days booked per year), highlighting successful long-term rental strategies or significant owner usage.
Husum Airbnb Minimum Stay Requirements Analysis
Distribution of Listings by Minimum Night Requirement
1 Night
20 listings
19.8% of total
2 Nights
13 listings
12.9% of total
3 Nights
11 listings
10.9% of total
4-6 Nights
16 listings
15.8% of total
7-29 Nights
3 listings
3% of total
30+ Nights
38 listings
37.6% of total
Key Insights
- The most prevalent minimum stay requirement in Husum is 30+ Nights, adopted by 37.6% of listings. This highlights the market's preference for longer commitments.
- A significant segment (37.6%) caters to monthly stays (30+ nights) in Husum, pointing to opportunities in the extended-stay market.
Recommendations
- Align with the market by considering a 30+ Nights minimum stay, as 37.6% of Husum hosts use this setting.
- If feasible, allowing 1-night stays, especially midweek or during low season, could capture last-minute bookings, as only 19.8% currently do.
- Explore offering discounts for stays of 30+ nights to attract the 37.6% of the market seeking extended stays.
- Adjust minimum nights based on seasonality – potentially shorter during low season and longer during peak demand periods in Husum.
Husum Airbnb Cancellation Policy Trends Analysis (2026)
Super Strict 30 Days
20 listings
19.8% of total
Flexible
24 listings
23.8% of total
Moderate
20 listings
19.8% of total
Firm
21 listings
20.8% of total
Strict
16 listings
15.8% of total
Cancellation Policy Insights for Husum
- The prevailing Airbnb cancellation policy trend in Husum is Flexible, used by 23.8% of listings.
- There's a relatively balanced mix between guest-friendly (43.6%) and stricter (36.6%) policies, offering choices for different guest needs.
Recommendations for Hosts
- Consider adopting a Flexible policy to align with the 23.8% market standard in Husum.
- Regularly review your cancellation policy against competitors and market demand shifts in Husum.
Husum STR Booking Lead Time Analysis (2026)
Average Booking Lead Time by Month
Booking Lead Time Insights for Husum
- The overall average booking lead time for vacation rentals in Husum is 80 days.
- Guests book furthest in advance for stays during September (average 129 days), likely coinciding with peak travel demand or local events.
- The shortest booking windows occur for stays in January (average 33 days), indicating more last-minute travel plans during this time.
- Seasonally, Summer (98 days avg.) sees the longest lead times, while Winter (51 days avg.) has the shortest, reflecting typical travel planning cycles.
Recommendations for Hosts
- Use the overall average lead time (80 days) as a baseline for your pricing and availability strategy in Husum.
- For September stays, consider implementing length-of-stay discounts or slightly higher rates for bookings made less than 129 days out to capitalize on advance planning.
- Target marketing efforts for the Summer season well in advance (at least 98 days) to capture early planners.
- Monitor your own booking lead times against these Husum averages to identify opportunities for dynamic pricing adjustments.
Popular & Essential Airbnb Amenities in Husum (2026)
Amenity Prevalence
Amenity Insights for Husum
- Essential amenities in Husum that guests expect include: Wifi, Heating, Kitchen. Lacking these (any) could significantly impact bookings.
- Popular amenities like TV, Coffee maker, Hair dryer are common but not universal. Offering these can provide a competitive edge.
Recommendations for Hosts
- Ensure your listing includes all essential amenities for Husum: Wifi, Heating, Kitchen.
- Prioritize adding missing essentials: Wifi, Heating, Kitchen.
- Consider adding popular differentiators like TV or Coffee maker to increase appeal.
- Highlight unique or less common amenities you offer (e.g., hot tub, dedicated workspace, EV charger) in your listing description and photos.
- Regularly check competitor amenities in Husum to stay competitive.
Husum Airbnb Guest Demographics & Profile Analysis (2026)
Guest Profile Summary for Husum
- The typical guest profile for Airbnb in Husum consists of primarily domestic travelers (74%), often arriving from nearby Berlin, typically belonging to the Post-2000s (Gen Z/Alpha) group (50%), primarily speaking English or German.
- Domestic travelers account for 73.9% of guests.
- Key international markets include Germany (73.9%) and Switzerland (5.7%).
- Top languages spoken are English (37.2%) followed by German (34.1%).
- A significant demographic segment is the Post-2000s (Gen Z/Alpha) group, representing 50% of guests.
Recommendations for Hosts
- Target domestic marketing efforts towards travelers from Berlin and Hamburg.
- Tailor amenities and listing descriptions to appeal to the dominant Post-2000s (Gen Z/Alpha) demographic (e.g., highlight fast WiFi, smart home features, local guides).
- Highlight unique local experiences or amenities relevant to the primary guest profile.
- Consider seasonal promotions aligned with peak travel times for key origin markets.
Nearby Short-Term Rental Market Comparison
How does the Husum Airbnb market stack up against its neighbors? Compare key performance metrics like average monthly revenue, ADR, and occupancy rates in surrounding areas to understand the broader regional STR landscape.
| Market | Active Properties | Monthly Revenue | Daily Rate | Avg. Occupancy |
|---|---|---|---|---|
| Husum-Ballum | 13 | $4,837 | $499.93 | 44% |
| Lohals | 20 | $2,866 | $331.99 | 40% |
| Blåvand | 16 | $2,374 | $318.93 | 40% |
| Bissee | 13 | $2,338 | $180.13 | 48% |
| Rude Strand | 27 | $2,198 | $254.15 | 41% |
| Korshavn | 14 | $2,192 | $244.24 | 41% |
| Tørresø Strand | 26 | $2,145 | $235.54 | 42% |
| Harmsdorf | 10 | $2,076 | $326.10 | 36% |
| Billund | 105 | $2,027 | $194.14 | 46% |
| Ærøskøbing | 33 | $1,996 | $177.48 | 46% |