Heringsdorf Airbnb Market Analysis 2026: Short Term Rental Data & Vacation Rental Statistics in Schleswig-Holstein, Germany
Is Airbnb profitable in Heringsdorf in 2026? Explore comprehensive Airbnb analytics for Heringsdorf, Schleswig-Holstein, Germany to uncover income potential. This 2026 STR market report for Heringsdorf, based on AirROI data from February 2025 to January 2026, reveals key trends in the niche market of 73 active listings.
Whether you're considering an Airbnb investment in Heringsdorf, optimizing your existing vacation rental, or exploring rental arbitrage opportunities, understanding the Heringsdorf Airbnb data is crucial. Leveraging the low regulation environment is key to maximizing your short term rental income potential. Let's dive into the specifics.
Key Heringsdorf Airbnb Performance Metrics Overview
Monthly Airbnb Revenue Variations & Income Potential in Heringsdorf (2026)
Understanding the monthly revenue variations for Airbnb listings in Heringsdorf is key to maximizing your short term rental income potential. Seasonality significantly impacts earnings. Our analysis, based on data from the past 12 months, shows that the peak revenue month for STRs in Heringsdorf is typically August, while November often presents the lowest earnings, highlighting opportunities for strategic pricing adjustments during shoulder and low seasons. Explore the typical Airbnb income in Heringsdorf across different performance tiers:
- Best-in-class properties (Top 10%) achieve $2,854+ monthly, often utilizing dynamic pricing and superior guest experiences.
- Strong performing properties (Top 25%) earn $1,962 or more, indicating effective management and desirable locations/amenities.
- Typical properties (Median) generate around $1,012 per month, representing the average market performance.
- Entry-level properties (Bottom 25%) see earnings around $489, often with potential for optimization.
Average Monthly Airbnb Earnings Trend in Heringsdorf
Heringsdorf Airbnb Occupancy Rate Trends (2026)
Maximize your bookings by understanding the Heringsdorf STR occupancy trends. Seasonal demand shifts significantly influence how often properties are booked. Typically, Augustsees the highest demand (peak season occupancy), while January experiences the lowest (low season). Effective strategies, like adjusting minimum stays or offering promotions, can boost occupancy during slower periods. Here's how different property tiers perform in Heringsdorf:
- Best-in-class properties (Top 10%) achieve 59%+ occupancy, indicating high desirability and potentially optimized availability.
- Strong performing properties (Top 25%) maintain 43% or higher occupancy, suggesting good market fit and guest satisfaction.
- Typical properties (Median) have an occupancy rate around 27%.
- Entry-level properties (Bottom 25%) average 13% occupancy, potentially facing higher vacancy.
Average Monthly Occupancy Rate Trend in Heringsdorf
Average Daily Rate (ADR) Airbnb Trends in Heringsdorf (2026)
Effective short term rental pricing strategy in Heringsdorf involves understanding monthly ADR fluctuations. The Average Daily Rate (ADR) for Airbnb in Heringsdorf typically peaks in December and dips lowest during February. Leveraging Airbnb dynamic pricing tools or strategies based on this seasonality can significantly boost revenue. Here's a look at the typical nightly rates achieved:
- Best-in-class properties (Top 10%) command rates of $323+ per night, often due to premium features or locations.
- Strong performing properties (Top 25%) achieve nightly rates of $222 or more.
- Typical properties (Median) charge around $142 per night.
- Entry-level properties (Bottom 25%) earn around $95 per night.
Average Daily Rate (ADR) Trend by Month in Heringsdorf
Get Live Heringsdorf Market Intelligence 👇

Explore Real-time Analytics
Airbnb Seasonality Analysis & Trends in Heringsdorf (2026)
Peak Season (August, July, September)
- Revenue averages $2,151 per month
- Occupancy rates average 48.9%
- Daily rates average $183
Shoulder Season
- Revenue averages $1,284 per month
- Occupancy maintains around 28.8%
- Daily rates hold near $174
Low Season (January, February, November)
- Revenue drops to average $636 per month
- Occupancy decreases to average 15.8%
- Daily rates adjust to average $171
Seasonality Insights for Heringsdorf
- The Airbnb seasonality in Heringsdorf shows highly seasonal trends requiring careful strategy. While the sections above show seasonal averages, it's also insightful to look at the extremes:
- During the high season, the absolute peak month showcases Heringsdorf's highest earning potential, with monthly revenues capable of climbing to $2,499, occupancy reaching a high of 60.4%, and ADRs peaking at $194.
- Conversely, the slowest single month of the year, typically falling within the low season, marks the market's lowest point. In this month, revenue might dip to $454, occupancy could drop to 7.9%, and ADRs may adjust down to $154.
- Understanding both the seasonal averages and these monthly peaks and troughs in revenue, occupancy, and ADR is crucial for maximizing your Airbnb profit potential in Heringsdorf.
Seasonal Strategies for Maximizing Profit
- Peak Season: Maximize revenue through premium pricing and potentially longer minimum stays. Ensure high availability.
- Low Season: Offer competitive pricing, special promotions (e.g., extended stay discounts), and flexible cancellation policies. Target off-season travelers like remote workers or budget-conscious guests.
- Shoulder Seasons: Implement dynamic pricing that balances peak and low rates. Target weekend travelers or specific events. Offer slightly more flexible terms than peak season.
- Regularly analyze your own performance against these Heringsdorf seasonality benchmarks and adjust your pricing and availability strategy accordingly.
Best Areas for Airbnb Investment in Heringsdorf (2026)
Exploring the top neighborhoods for short-term rentals in Heringsdorf? This section highlights key areas, outlining why they are attractive for hosts and guests, along with notable local attractions. Consider these locations based on your target guest profile and investment strategy.
| Neighborhood / Area | Why Host Here? (Target Guests & Appeal) | Key Attractions & Landmarks |
|---|---|---|
| Seebad Heringsdorf | A picturesque beach resort known for its stunning sandy beaches and historic architecture. Great for tourists looking for a relaxing seaside experience with access to various amenities and activities. | Heringsdorf Pier, Beach promenade, Bansin Beach, Fine dining restaurants, Local markets |
| Ahlbeck | Famous for its traditional charm and beautiful beachfront properties, Ahlbeck attracts visitors who want a quaint and cozy atmosphere, along with beach access and cultural experiences. | Ahlbeck Pier, Historical villas, Ahlbeck beach, Local cafes and restaurants, Spa facilities |
| Bansin | An idyllic coastal village that offers tranquility and natural beauty, perfect for families and those seeking a peaceful getaway close to the Baltic Sea. | Bansin Beach, Heringsdorf State Park, Local art galleries, Water sports activities, Walking trails |
| Usedom Island | A larger area known for its diverse landscapes, Usedom offers a variety of outdoor activities and attractions, appealing to families, couples, and nature lovers. | Usedom Nature Park, Historical sites, Beach resorts, Cycling paths, Bird watching areas |
| Koserow | A smaller seaside resort that provides a quieter alternative to busier locations, ideal for visitors looking for a peaceful beach experience with charming surroundings. | Koserow Beach, Koserow Lighthouse, Local seafood restaurants, Nature walks, Water sports |
| Zinnowitz | Renowned for its beautiful cliff landscapes and vibrant promenade filled with shops and restaurants, Zinnowitz attracts a diverse range of tourists. | Zinnowitz Beach, Simple Beach Promenade, Local theater, Surfing and water sports, Natural scenery |
| Swinoujscie (Poland) | Just across the border, Swinoujscie is popular among tourists for its spa resorts and vibrant pier. A great option for guests looking for a combined cultural and beach experience. | Swinoujscie Promenade, Spa centers, Historical architecture, Local markets, Beach activities |
| Peenemuende | Known for its historical significance and beautiful landscapes, Peenemuende is less touristy and offers a unique experience for history enthusiasts and nature lovers wishing to explore the Baltic Sea. | Historical museum, Peenemuende beach, Memorial sites, Nature trails, Local fishing experiences |
Understanding Airbnb License Requirements & STR Laws in Heringsdorf (2026)
While Heringsdorf, Schleswig-Holstein, Germany currently shows low STR regulations, specific Airbnb license requirements might still exist or change. Always verify the latest short term rental regulations and Airbnb license requirements directly with local government authorities for Heringsdorf to ensure full compliance before hosting.
(Source: AirROI data, 2026, finding no licensed listings among those analyzed)
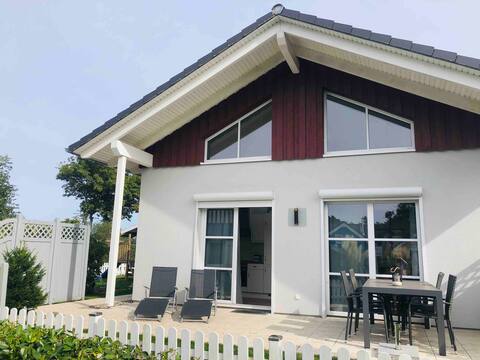
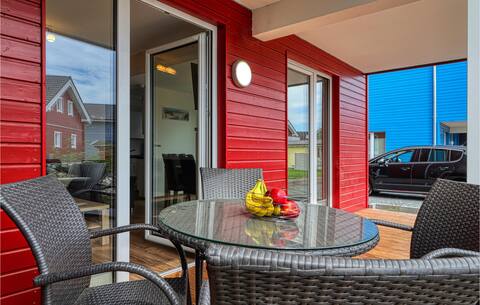
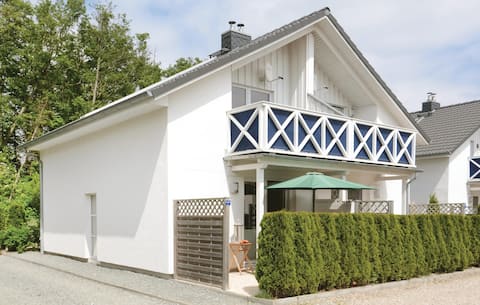
Top Performing Airbnb Properties in Heringsdorf (2026)
Benchmark your potential! Explore examples of top-performing Airbnb properties in Heringsdorfbased on Trailing Twelve Month (TTM) revenue. Analyze their characteristics, revenue, occupancy rate, and ADR to understand what drives success in this market.
meinstrandhaus with sea view
Entire Place • 2 bedrooms

Seerose
Entire Place • 3 bedrooms

Anton: Tiny House sleeps four with sleeping loft
Entire Place • 1 bedroom

Mia: Tiny house for the whole family
Entire Place • 1 bedroom
Seewolke 6
Entire Place • 4 bedrooms
House Seeadler 1
Entire Place • 2 bedrooms
Note: Performance varies based on location, size, amenities, seasonality, and management quality. Data reflects the past 12 months.
Top Performing Airbnb Hosts in Heringsdorf (2026)
Learn from the best! This table showcases top-performing Airbnb hosts in Heringsdorf based on the number of properties managed and estimated total revenue over the past year. Analyze their scale and performance metrics.
| Host Name | Properties | Grossing Revenue | Stay Reviews | Avg Rating |
|---|---|---|---|---|
| Novasol | 22 | $161,496 | 62 | 4.06/5.0 |
| Annika | 8 | $80,405 | 227 | 4.70/5.0 |
| Novasol | 6 | $58,770 | 17 | 4.38/5.0 |
| Novasol | 3 | $48,357 | 8 | 4.25/5.0 |
| Novasol | 3 | $43,902 | 5 | 3.33/5.0 |
| Julia | 1 | $39,726 | 100 | 4.95/5.0 |
| Novasol | 3 | $28,346 | 11 | 4.11/5.0 |
| Meike Und Wiebke | 1 | $19,719 | 6 | 5.00/5.0 |
| Christiane Gerrit | 1 | $14,771 | 58 | 4.90/5.0 |
| Britta | 2 | $13,464 | 69 | 4.80/5.0 |
Analyzing the strategies of top hosts, such as their property selection, pricing, and guest communication, can offer valuable lessons for optimizing your own Airbnb operations in Heringsdorf.
Dive Deeper: Advanced Heringsdorf STR Market Data (2026)
Ready to unlock more insights? AirROI provides access to advanced metrics and comprehensive Airbnb data for Heringsdorf. Explore detailed analytics beyond this report to refine your investment strategy, optimize pricing, and maximize your vacation rental profits.
Explore Advanced MetricsHeringsdorf Short-Term Rental Market Composition (2026): Property & Room Types
Room Type Distribution
Property Type Distribution
Market Composition Insights for Heringsdorf
- The Heringsdorf Airbnb market composition is heavily skewed towards Entire Home/Apt listings, which make up 100% of the 73 active rentals. This indicates strong guest preference for privacy and space.
- Looking at the property type distribution in Heringsdorf, House properties are the most common (72.6%), reflecting the local real estate landscape.
- Houses represent a significant 72.6% portion, catering likely to families or larger groups.
Heringsdorf Airbnb Room Capacity Analysis (2026): Bedroom Distribution
Distribution of Listings by Number of Bedrooms
Room Capacity Insights for Heringsdorf
- The dominant room capacity in Heringsdorf is 2 bedrooms listings, making up 46.6% of the market. This suggests a strong demand for properties suitable for couples or solo travelers.
- Together, 2 bedrooms and 1 bedroom properties represent 68.5% of the active Airbnb listings in Heringsdorf, indicating a high concentration in these sizes.
- A significant 24.7% of listings offer 3+ bedrooms, catering to larger groups and families seeking more space in Heringsdorf.
Heringsdorf Vacation Rental Guest Capacity Trends (2026)
Distribution of Listings by Guest Capacity
Guest Capacity Insights for Heringsdorf
- The most common guest capacity trend in Heringsdorf vacation rentals is listings accommodating 4 guests (46.6%). This suggests the primary traveler segment is likely small families or groups.
- Properties designed for 4 guests and 6 guests dominate the Heringsdorf STR market, accounting for 69.9% of listings.
- 32.9% of properties accommodate 6+ guests, serving the market segment for larger families or group travel in Heringsdorf.
- On average, properties in Heringsdorf are equipped to host 4.5 guests.
Heringsdorf Airbnb Booking Patterns (2026): Available vs. Booked Days
Available Days Distribution
Booked Days Distribution
Booking Pattern Insights for Heringsdorf
- The most common availability pattern in Heringsdorf falls within the 271-366 days range, representing 79.5% of listings. This suggests many properties have significant open periods on their calendars.
- Approximately 95.9% of listings show high availability (181+ days open annually), indicating potential for increased bookings or specific owner usage patterns.
- For booked days, the 31-90 days range is most frequent in Heringsdorf (41.1%), reflecting common guest stay durations or potential owner blocking patterns.
- A notable 4.1% of properties secure long booking periods (181+ days booked per year), highlighting successful long-term rental strategies or significant owner usage.
Heringsdorf Airbnb Minimum Stay Requirements Analysis
Distribution of Listings by Minimum Night Requirement
1 Night
3 listings
4.1% of total
2 Nights
4 listings
5.5% of total
3 Nights
4 listings
5.5% of total
4-6 Nights
12 listings
16.4% of total
30+ Nights
50 listings
68.5% of total
Key Insights
- The most prevalent minimum stay requirement in Heringsdorf is 30+ Nights, adopted by 68.5% of listings. This highlights the market's preference for longer commitments.
- Very short stays (1-2 nights) are less common (9.6%), suggesting hosts prefer slightly longer bookings to optimize turnover.
- A significant segment (68.5%) caters to monthly stays (30+ nights) in Heringsdorf, pointing to opportunities in the extended-stay market.
Recommendations
- Align with the market by considering a 30+ Nights minimum stay, as 68.5% of Heringsdorf hosts use this setting.
- If feasible, allowing 1-night stays, especially midweek or during low season, could capture last-minute bookings, as only 4.1% currently do.
- Explore offering discounts for stays of 30+ nights to attract the 68.5% of the market seeking extended stays.
- Adjust minimum nights based on seasonality – potentially shorter during low season and longer during peak demand periods in Heringsdorf.
Heringsdorf Airbnb Cancellation Policy Trends Analysis (2026)
Super Strict 60 Days
42 listings
57.5% of total
Flexible
4 listings
5.5% of total
Moderate
9 listings
12.3% of total
Firm
10 listings
13.7% of total
Strict
8 listings
11% of total
Cancellation Policy Insights for Heringsdorf
- The prevailing Airbnb cancellation policy trend in Heringsdorf is Super Strict 60 Days, used by 57.5% of listings.
- There's a relatively balanced mix between guest-friendly (17.8%) and stricter (24.7%) policies, offering choices for different guest needs.
Recommendations for Hosts
- Consider adopting a Super Strict 60 Days policy to align with the 57.5% market standard in Heringsdorf.
- Using a Strict policy might deter some guests, as only 11% of listings use it. Evaluate if potential revenue protection outweighs possible lower booking rates.
- Regularly review your cancellation policy against competitors and market demand shifts in Heringsdorf.
Heringsdorf STR Booking Lead Time Analysis (2026)
Average Booking Lead Time by Month
Booking Lead Time Insights for Heringsdorf
- The overall average booking lead time for vacation rentals in Heringsdorf is 85 days.
- Guests book furthest in advance for stays during December (average 155 days), likely coinciding with peak travel demand or local events.
- The shortest booking windows occur for stays in February (average 11 days), indicating more last-minute travel plans during this time.
- Seasonally, Winter (89 days avg.) sees the longest lead times, while Spring (45 days avg.) has the shortest, reflecting typical travel planning cycles.
Recommendations for Hosts
- Use the overall average lead time (85 days) as a baseline for your pricing and availability strategy in Heringsdorf.
- For December stays, consider implementing length-of-stay discounts or slightly higher rates for bookings made less than 155 days out to capitalize on advance planning.
- During February, focus on last-minute booking availability and promotions, as guests book with very short notice (11 days avg.).
- Target marketing efforts for the Winter season well in advance (at least 89 days) to capture early planners.
- Monitor your own booking lead times against these Heringsdorf averages to identify opportunities for dynamic pricing adjustments.
Popular & Essential Airbnb Amenities in Heringsdorf (2026)
Amenity Prevalence
Amenity Insights for Heringsdorf
- Essential amenities in Heringsdorf that guests expect include: Kitchen. Lacking these (this) could significantly impact bookings.
- Popular amenities like Dishes and silverware, Refrigerator, Stove are common but not universal. Offering these can provide a competitive edge.
Recommendations for Hosts
- Ensure your listing includes all essential amenities for Heringsdorf: Kitchen.
- Consider adding popular differentiators like Dishes and silverware or Refrigerator to increase appeal.
- Highlight unique or less common amenities you offer (e.g., hot tub, dedicated workspace, EV charger) in your listing description and photos.
- Regularly check competitor amenities in Heringsdorf to stay competitive.
Heringsdorf Airbnb Guest Demographics & Profile Analysis (2026)
Guest Profile Summary for Heringsdorf
- The typical guest profile for Airbnb in Heringsdorf consists of primarily domestic travelers (94%), often arriving from nearby Hamburg, typically belonging to the Post-2000s (Gen Z/Alpha) group (50%), primarily speaking German or English.
- Domestic travelers account for 94.3% of guests.
- Key international markets include Germany (94.3%) and Netherlands (2.3%).
- Top languages spoken are German (42.3%) followed by English (40.2%).
- A significant demographic segment is the Post-2000s (Gen Z/Alpha) group, representing 50% of guests.
Recommendations for Hosts
- Target domestic marketing efforts towards travelers from Hamburg and Berlin.
- Tailor amenities and listing descriptions to appeal to the dominant Post-2000s (Gen Z/Alpha) demographic (e.g., highlight fast WiFi, smart home features, local guides).
- Highlight unique local experiences or amenities relevant to the primary guest profile.
- Consider seasonal promotions aligned with peak travel times for key origin markets.
Nearby Short-Term Rental Market Comparison
How does the Heringsdorf Airbnb market stack up against its neighbors? Compare key performance metrics like average monthly revenue, ADR, and occupancy rates in surrounding areas to understand the broader regional STR landscape.
| Market | Active Properties | Monthly Revenue | Daily Rate | Avg. Occupancy |
|---|---|---|---|---|
| Gallin-Kuppentin | 14 | $2,958 | $358.55 | 30% |
| Wittenbeck | 14 | $2,937 | $224.34 | 43% |
| Lohals | 20 | $2,866 | $331.99 | 40% |
| Heiligengrabe | 12 | $2,400 | $226.39 | 39% |
| Copenhagen | 9,111 | $2,347 | $222.94 | 52% |
| Bissee | 13 | $2,338 | $180.13 | 48% |
| Råbylille Strand | 31 | $2,254 | $190.70 | 45% |
| Rude Strand | 27 | $2,198 | $254.15 | 41% |
| Korshavn | 14 | $2,192 | $244.24 | 41% |
| Alt Sührkow | 10 | $2,175 | $426.32 | 28% |