Damp Airbnb Market Analysis 2026: Short Term Rental Data & Vacation Rental Statistics in Schleswig-Holstein, Germany
Is Airbnb profitable in Damp in 2026? Explore comprehensive Airbnb analytics for Damp, Schleswig-Holstein, Germany to uncover income potential. This 2026 STR market report for Damp, based on AirROI data from February 2025 to January 2026, reveals key trends in the niche market of 61 active listings.
Whether you're considering an Airbnb investment in Damp, optimizing your existing vacation rental, or exploring rental arbitrage opportunities, understanding the Damp Airbnb data is crucial. Leveraging the low regulation environment is key to maximizing your short term rental income potential. Let's dive into the specifics.
Key Damp Airbnb Performance Metrics Overview
Monthly Airbnb Revenue Variations & Income Potential in Damp (2026)
Understanding the monthly revenue variations for Airbnb listings in Damp is key to maximizing your short term rental income potential. Seasonality significantly impacts earnings. Our analysis, based on data from the past 12 months, shows that the peak revenue month for STRs in Damp is typically July, while May often presents the lowest earnings, highlighting opportunities for strategic pricing adjustments during shoulder and low seasons. Explore the typical Airbnb income in Damp across different performance tiers:
- Best-in-class properties (Top 10%) achieve $1,448+ monthly, often utilizing dynamic pricing and superior guest experiences.
- Strong performing properties (Top 25%) earn $890 or more, indicating effective management and desirable locations/amenities.
- Typical properties (Median) generate around $408 per month, representing the average market performance.
- Entry-level properties (Bottom 25%) see earnings around $165, often with potential for optimization.
Average Monthly Airbnb Earnings Trend in Damp
Damp Airbnb Occupancy Rate Trends (2026)
Maximize your bookings by understanding the Damp STR occupancy trends. Seasonal demand shifts significantly influence how often properties are booked. Typically, Aprilsees the highest demand (peak season occupancy), while May experiences the lowest (low season). Effective strategies, like adjusting minimum stays or offering promotions, can boost occupancy during slower periods. Here's how different property tiers perform in Damp:
- Best-in-class properties (Top 10%) achieve 36%+ occupancy, indicating high desirability and potentially optimized availability.
- Strong performing properties (Top 25%) maintain 21% or higher occupancy, suggesting good market fit and guest satisfaction.
- Typical properties (Median) have an occupancy rate around 13%.
- Entry-level properties (Bottom 25%) average 5% occupancy, potentially facing higher vacancy.
Average Monthly Occupancy Rate Trend in Damp
Average Daily Rate (ADR) Airbnb Trends in Damp (2026)
Effective short term rental pricing strategy in Damp involves understanding monthly ADR fluctuations. The Average Daily Rate (ADR) for Airbnb in Damp typically peaks in July and dips lowest during February. Leveraging Airbnb dynamic pricing tools or strategies based on this seasonality can significantly boost revenue. Here's a look at the typical nightly rates achieved:
- Best-in-class properties (Top 10%) command rates of $252+ per night, often due to premium features or locations.
- Strong performing properties (Top 25%) achieve nightly rates of $164 or more.
- Typical properties (Median) charge around $125 per night.
- Entry-level properties (Bottom 25%) earn around $102 per night.
Average Daily Rate (ADR) Trend by Month in Damp
Get Live Damp Market Intelligence 👇

Explore Real-time Analytics
Airbnb Seasonality Analysis & Trends in Damp (2026)
Peak Season (July, August, April)
- Revenue averages $974 per month
- Occupancy rates average 23.5%
- Daily rates average $159
Shoulder Season
- Revenue averages $590 per month
- Occupancy maintains around 16.9%
- Daily rates hold near $148
Low Season (January, May, December)
- Revenue drops to average $409 per month
- Occupancy decreases to average 9.9%
- Daily rates adjust to average $148
Seasonality Insights for Damp
- The Airbnb seasonality in Damp shows highly seasonal trends requiring careful strategy. While the sections above show seasonal averages, it's also insightful to look at the extremes:
- During the high season, the absolute peak month showcases Damp's highest earning potential, with monthly revenues capable of climbing to $1,141, occupancy reaching a high of 25.2%, and ADRs peaking at $166.
- Conversely, the slowest single month of the year, typically falling within the low season, marks the market's lowest point. In this month, revenue might dip to $352, occupancy could drop to 9.2%, and ADRs may adjust down to $139.
- Understanding both the seasonal averages and these monthly peaks and troughs in revenue, occupancy, and ADR is crucial for maximizing your Airbnb profit potential in Damp.
Seasonal Strategies for Maximizing Profit
- Peak Season: Maximize revenue through premium pricing and potentially longer minimum stays. Ensure high availability.
- Low Season: Offer competitive pricing, special promotions (e.g., extended stay discounts), and flexible cancellation policies. Target off-season travelers like remote workers or budget-conscious guests.
- Shoulder Seasons: Implement dynamic pricing that balances peak and low rates. Target weekend travelers or specific events. Offer slightly more flexible terms than peak season.
- Regularly analyze your own performance against these Damp seasonality benchmarks and adjust your pricing and availability strategy accordingly.
Best Areas for Airbnb Investment in Damp (2026)
Exploring the top neighborhoods for short-term rentals in Damp? This section highlights key areas, outlining why they are attractive for hosts and guests, along with notable local attractions. Consider these locations based on your target guest profile and investment strategy.
| Neighborhood / Area | Why Host Here? (Target Guests & Appeal) | Key Attractions & Landmarks |
|---|---|---|
| Historic Damp | A charming area featuring traditional architecture and close proximity to the Baltic Sea. Great for visitors looking for a cultural and scenic experience with local restaurants and shops. | Damp Beach, Baltic Sea Promenade, Local seafood restaurants, Nearby nature reserves, Water sports activities |
| Damp Marina | A picturesque marina offering beautiful views and various water activities. Perfect for tourists who enjoy sailing, fishing, and relaxing by the sea. | Damp Marina, Boat rentals, Fishing charters, Coastal walks, Cafés and bars by the marina |
| Schleswig-Holstein Wadden Sea National Park | A UNESCO World Heritage site renowned for its unique landscapes and biodiversity. Attracts nature lovers and families looking for outdoor activities. | Wadden Sea beaches, Mudflat hiking, Birdwatching, Visitor centers, Scenic cycling routes |
| Damp Wellness Spa | A wellness destination with extensive spa facilities, drawing visitors seeking relaxation and rejuvenation. Ideal for weekend getaways and health-conscious tourists. | Spa and wellness centers, Thermal baths, Yoga sessions, Relaxation areas, Beauty treatments |
| Damp Old Town | An area rich in history, providing visitors with insight into local culture and heritage. Great for tourists who appreciate a quaint atmosphere with local artisans. | Local artisan shops, Cultural events, Historical buildings, Festivals, Guided city tours |
| Kieler Förde | A stunning fjord area providing a mix of natural beauty and urban attractions. Popular amongst travelers looking for a balance of beach and city life. | Kiel City, Yachting and sailing opportunities, Scenic viewpoints, Beaches, Local restaurants |
| Damp Nature Trails | A network of trails perfect for hiking and biking, attracting outdoor enthusiasts and families looking to explore the local nature. | Hiking and biking trails, Nature reserves, Picnic spots, Animal watching, Guided nature tours |
| Damp Events Center | A central location for various events and gatherings, attracting visitors looking for entertainment and social activities throughout the year. | Concerts and festivals, Exhibitions, Community events, Sporting events, Workshops and classes |
Understanding Airbnb License Requirements & STR Laws in Damp (2026)
While Damp, Schleswig-Holstein, Germany currently shows low STR regulations, specific Airbnb license requirements might still exist or change. Always verify the latest short term rental regulations and Airbnb license requirements directly with local government authorities for Damp to ensure full compliance before hosting.
(Source: AirROI data, 2026, based on 2% licensed listings)
Top Performing Airbnb Properties in Damp (2026)
Benchmark your potential! Explore examples of top-performing Airbnb properties in Dampbased on Trailing Twelve Month (TTM) revenue. Analyze their characteristics, revenue, occupancy rate, and ADR to understand what drives success in this market.

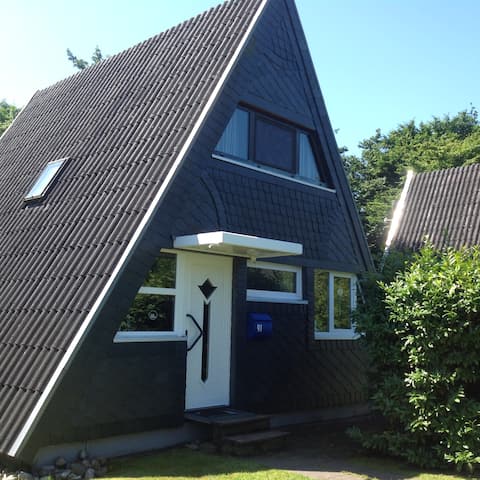
Baltic Sea vacation home in Damp
Entire Place • 2 bedrooms
Raabe Vacation Home Straße der Träume "Wi-Fi"
Entire Place • 2 bedrooms

Ostsee-Residenz (DMP154) by Interhome
Entire Place • 1 bedroom
Vacation home getaway 24/7
Entire Place • 2 bedrooms

Time out by Interhome
Entire Place • 1 bedroom
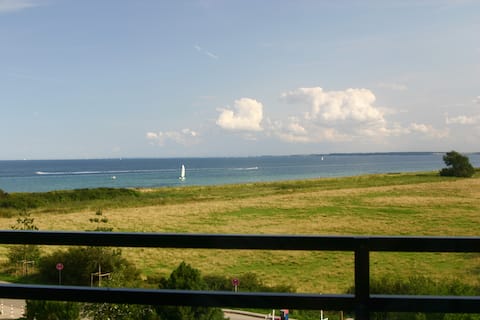
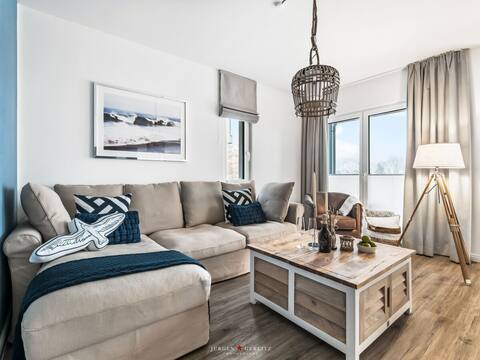
Apartment with a view of the Baltic Sea
Entire Place • 1 bedroom
Note: Performance varies based on location, size, amenities, seasonality, and management quality. Data reflects the past 12 months.
Top Performing Airbnb Hosts in Damp (2026)
Learn from the best! This table showcases top-performing Airbnb hosts in Damp based on the number of properties managed and estimated total revenue over the past year. Analyze their scale and performance metrics.
| Host Name | Properties | Grossing Revenue | Stay Reviews | Avg Rating |
|---|---|---|---|---|
| Caroline | 31 | $103,150 | 105 | 4.45/5.0 |
| Martina - Interhome | 8 | $31,373 | 44 | 4.14/5.0 |
| Andreas | 1 | $20,181 | 69 | 4.91/5.0 |
| Favorent | 2 | $13,845 | 8 | 5.00/5.0 |
| Thorsten | 1 | $13,782 | 5 | 5.00/5.0 |
| Ritesh | 3 | $11,525 | 6 | 4.67/5.0 |
| Uta - Interhome | 1 | $11,079 | 2 | Not Rated |
| Jan Olaf | 1 | $9,507 | 2 | Not Rated |
| Nikolai | 1 | $7,607 | 7 | 5.00/5.0 |
| Alexander | 1 | $7,167 | 1 | Not Rated |
Analyzing the strategies of top hosts, such as their property selection, pricing, and guest communication, can offer valuable lessons for optimizing your own Airbnb operations in Damp.
Dive Deeper: Advanced Damp STR Market Data (2026)
Ready to unlock more insights? AirROI provides access to advanced metrics and comprehensive Airbnb data for Damp. Explore detailed analytics beyond this report to refine your investment strategy, optimize pricing, and maximize your vacation rental profits.
Explore Advanced MetricsDamp Short-Term Rental Market Composition (2026): Property & Room Types
Room Type Distribution
Property Type Distribution
Market Composition Insights for Damp
- The Damp Airbnb market composition is heavily skewed towards Entire Home/Apt listings, which make up 100% of the 61 active rentals. This indicates strong guest preference for privacy and space.
- Looking at the property type distribution in Damp, Apartment/Condo properties are the most common (57.4%), reflecting the local real estate landscape.
- Houses represent a significant 41% portion, catering likely to families or larger groups.
- Smaller segments like hotel/boutique (combined 1.6%) offer potential for unique stay experiences.
Damp Airbnb Room Capacity Analysis (2026): Bedroom Distribution
Distribution of Listings by Number of Bedrooms
Room Capacity Insights for Damp
- The dominant room capacity in Damp is 2 bedrooms listings, making up 37.7% of the market. This suggests a strong demand for properties suitable for couples or solo travelers.
- Together, 2 bedrooms and 1 bedroom properties represent 67.2% of the active Airbnb listings in Damp, indicating a high concentration in these sizes.
- Listings with 3+ bedrooms (1.6%) represent a smaller niche, potentially indicating an underserved market for larger group accommodations in Damp.
Damp Vacation Rental Guest Capacity Trends (2026)
Distribution of Listings by Guest Capacity
Guest Capacity Insights for Damp
- The most common guest capacity trend in Damp vacation rentals is listings accommodating 4 guests (42.6%). This suggests the primary traveler segment is likely small families or groups.
- Properties designed for 4 guests and 2 guests dominate the Damp STR market, accounting for 63.9% of listings.
- 19.6% of properties accommodate 6+ guests, serving the market segment for larger families or group travel in Damp.
- On average, properties in Damp are equipped to host 4.1 guests.
Damp Airbnb Booking Patterns (2026): Available vs. Booked Days
Available Days Distribution
Booked Days Distribution
Booking Pattern Insights for Damp
- The most common availability pattern in Damp falls within the 271-366 days range, representing 91.8% of listings. This suggests many properties have significant open periods on their calendars.
- Approximately 100.0% of listings show high availability (181+ days open annually), indicating potential for increased bookings or specific owner usage patterns.
- For booked days, the 1-30 days range is most frequent in Damp (49.2%), reflecting common guest stay durations or potential owner blocking patterns.
Damp Airbnb Minimum Stay Requirements Analysis
Distribution of Listings by Minimum Night Requirement
1 Night
1 listings
1.6% of total
2 Nights
6 listings
9.8% of total
3 Nights
3 listings
4.9% of total
4-6 Nights
3 listings
4.9% of total
30+ Nights
48 listings
78.7% of total
Key Insights
- The most prevalent minimum stay requirement in Damp is 30+ Nights, adopted by 78.7% of listings. This highlights the market's preference for longer commitments.
- Very short stays (1-2 nights) are less common (11.4%), suggesting hosts prefer slightly longer bookings to optimize turnover.
- A significant segment (78.7%) caters to monthly stays (30+ nights) in Damp, pointing to opportunities in the extended-stay market.
Recommendations
- Align with the market by considering a 30+ Nights minimum stay, as 78.7% of Damp hosts use this setting.
- If feasible, allowing 1-night stays, especially midweek or during low season, could capture last-minute bookings, as only 1.6% currently do.
- Explore offering discounts for stays of 30+ nights to attract the 78.7% of the market seeking extended stays.
- Adjust minimum nights based on seasonality – potentially shorter during low season and longer during peak demand periods in Damp.
Damp Airbnb Cancellation Policy Trends Analysis (2026)
Limited
1 listings
1.6% of total
Super Strict 30 Days
2 listings
3.3% of total
Moderate
2 listings
3.3% of total
Firm
46 listings
75.4% of total
Strict
10 listings
16.4% of total
Cancellation Policy Insights for Damp
- The prevailing Airbnb cancellation policy trend in Damp is Firm, used by 75.4% of listings.
- A majority (91.8%) of hosts in Damp utilize Firm or Strict policies, indicating a market where hosts prioritize booking security.
Recommendations for Hosts
- Consider adopting a Firm policy to align with the 75.4% market standard in Damp.
- Regularly review your cancellation policy against competitors and market demand shifts in Damp.
Damp STR Booking Lead Time Analysis (2026)
Average Booking Lead Time by Month
Booking Lead Time Insights for Damp
- The overall average booking lead time for vacation rentals in Damp is 39 days.
- Guests book furthest in advance for stays during May (average 64 days), likely coinciding with peak travel demand or local events.
- The shortest booking windows occur for stays in March (average 6 days), indicating more last-minute travel plans during this time.
- Seasonally, Fall (38 days avg.) sees the longest lead times, while Winter (22 days avg.) has the shortest, reflecting typical travel planning cycles.
Recommendations for Hosts
- Use the overall average lead time (39 days) as a baseline for your pricing and availability strategy in Damp.
- For May stays, consider implementing length-of-stay discounts or slightly higher rates for bookings made less than 64 days out to capitalize on advance planning.
- During March, focus on last-minute booking availability and promotions, as guests book with very short notice (6 days avg.).
- Target marketing efforts for the Fall season well in advance (at least 38 days) to capture early planners.
- Monitor your own booking lead times against these Damp averages to identify opportunities for dynamic pricing adjustments.
Popular & Essential Airbnb Amenities in Damp (2026)
Amenity Prevalence
Amenity Insights for Damp
- Essential amenities in Damp that guests expect include: Kitchen, Coffee maker, TV, Heating. Lacking these (any) could significantly impact bookings.
- Popular amenities like Refrigerator, Dishes and silverware, Toaster are common but not universal. Offering these can provide a competitive edge.
- Warning: Wifi is not universally provided but is considered essential globally. Ensure reliable Wifi is offered.
Recommendations for Hosts
- Ensure your listing includes all essential amenities for Damp: Kitchen, Coffee maker, TV, Heating.
- Prioritize adding missing essentials: Kitchen, Coffee maker, TV, Heating.
- Consider adding popular differentiators like Refrigerator or Dishes and silverware to increase appeal.
- Highlight unique or less common amenities you offer (e.g., hot tub, dedicated workspace, EV charger) in your listing description and photos.
- Regularly check competitor amenities in Damp to stay competitive.
Damp Airbnb Guest Demographics & Profile Analysis (2026)
Guest Profile Summary for Damp
- The typical guest profile for Airbnb in Damp consists of primarily domestic travelers (82%), often arriving from nearby Hamburg, typically belonging to the Post-2000s (Gen Z/Alpha) group (50%), primarily speaking English or German.
- Domestic travelers account for 82.1% of guests.
- Key international markets include Germany (82.1%) and Denmark (7.1%).
- Top languages spoken are English (46.7%) followed by German (43.3%).
- A significant demographic segment is the Post-2000s (Gen Z/Alpha) group, representing 50% of guests.
Recommendations for Hosts
- Target domestic marketing efforts towards travelers from Hamburg and Potsdam.
- Tailor amenities and listing descriptions to appeal to the dominant Post-2000s (Gen Z/Alpha) demographic (e.g., highlight fast WiFi, smart home features, local guides).
- Highlight unique local experiences or amenities relevant to the primary guest profile.
- Consider seasonal promotions aligned with peak travel times for key origin markets.
Nearby Short-Term Rental Market Comparison
How does the Damp Airbnb market stack up against its neighbors? Compare key performance metrics like average monthly revenue, ADR, and occupancy rates in surrounding areas to understand the broader regional STR landscape.
| Market | Active Properties | Monthly Revenue | Daily Rate | Avg. Occupancy |
|---|---|---|---|---|
| Wittenbeck | 14 | $2,937 | $224.34 | 43% |
| Lohals | 20 | $2,866 | $331.99 | 40% |
| Bissee | 13 | $2,338 | $180.13 | 48% |
| Rude Strand | 27 | $2,198 | $254.15 | 41% |
| Korshavn | 14 | $2,192 | $244.24 | 41% |
| Tørresø Strand | 26 | $2,145 | $235.54 | 42% |
| Harmsdorf | 10 | $2,076 | $326.10 | 36% |
| Billund | 105 | $2,027 | $194.14 | 46% |
| Ærøskøbing | 33 | $1,996 | $177.48 | 46% |
| Oberndorf | 10 | $1,872 | $186.86 | 28% |