Belau Airbnb Market Analysis 2025: Short Term Rental Data & Vacation Rental Statistics in Schleswig-Holstein, Germany
Is Airbnb profitable in Belau in 2025? Explore comprehensive Airbnb analytics for Belau, Schleswig-Holstein, Germany to uncover income potential. This 2025 STR market report for Belau, based on AirROI data from November 2024 to October 2025, reveals key trends in the niche market of 26 active listings.
Whether you're considering an Airbnb investment in Belau, optimizing your existing vacation rental, or exploring rental arbitrage opportunities, understanding the Belau Airbnb data is crucial. Leveraging the low regulation environment is key to maximizing your short term rental income potential. Let's dive into the specifics.
Key Belau Airbnb Performance Metrics Overview
Monthly Airbnb Revenue Variations & Income Potential in Belau (2025)
Understanding the monthly revenue variations for Airbnb listings in Belau is key to maximizing your short term rental income potential. Seasonality significantly impacts earnings. Our analysis, based on data from the past 12 months, shows that the peak revenue month for STRs in Belau is typically November, while September often presents the lowest earnings, highlighting opportunities for strategic pricing adjustments during shoulder and low seasons. Explore the typical Airbnb income in Belau across different performance tiers:
- Best-in-class properties (Top 10%) achieve $934+ monthly, often utilizing dynamic pricing and superior guest experiences.
- Strong performing properties (Top 25%) earn $720 or more, indicating effective management and desirable locations/amenities.
- Typical properties (Median) generate around $431 per month, representing the average market performance.
- Entry-level properties (Bottom 25%) see earnings around $202, often with potential for optimization.
Average Monthly Airbnb Earnings Trend in Belau
Belau Airbnb Occupancy Rate Trends (2025)
Maximize your bookings by understanding the Belau STR occupancy trends. Seasonal demand shifts significantly influence how often properties are booked. Typically, Novembersees the highest demand (peak season occupancy), while September experiences the lowest (low season). Effective strategies, like adjusting minimum stays or offering promotions, can boost occupancy during slower periods. Here's how different property tiers perform in Belau:
- Best-in-class properties (Top 10%) achieve 21%+ occupancy, indicating high desirability and potentially optimized availability.
- Strong performing properties (Top 25%) maintain 17% or higher occupancy, suggesting good market fit and guest satisfaction.
- Typical properties (Median) have an occupancy rate around 14%.
- Entry-level properties (Bottom 25%) average 5% occupancy, potentially facing higher vacancy.
Average Monthly Occupancy Rate Trend in Belau
Average Daily Rate (ADR) Airbnb Trends in Belau (2025)
Effective short term rental pricing strategy in Belau involves understanding monthly ADR fluctuations. The Average Daily Rate (ADR) for Airbnb in Belau typically peaks in November and dips lowest during October. Leveraging Airbnb dynamic pricing tools or strategies based on this seasonality can significantly boost revenue. Here's a look at the typical nightly rates achieved:
- Best-in-class properties (Top 10%) command rates of $167+ per night, often due to premium features or locations.
- Strong performing properties (Top 25%) achieve nightly rates of $151 or more.
- Typical properties (Median) charge around $136 per night.
- Entry-level properties (Bottom 25%) earn around $126 per night.
Average Daily Rate (ADR) Trend by Month in Belau
Get Live Belau Market Intelligence 👇

Explore Real-time Analytics
Airbnb Seasonality Analysis & Trends in Belau (2025)
Peak Season (November, March, February)
- Revenue averages $833 per month
- Occupancy rates average 22.3%
- Daily rates average $138
Shoulder Season
- Revenue averages $543 per month
- Occupancy maintains around 12.6%
- Daily rates hold near $137
Low Season (May, June, September)
- Revenue drops to average $211 per month
- Occupancy decreases to average 4.9%
- Daily rates adjust to average $138
Seasonality Insights for Belau
- The Airbnb seasonality in Belau shows highly seasonal trends requiring careful strategy. While the sections above show seasonal averages, it's also insightful to look at the extremes:
- During the high season, the absolute peak month showcases Belau's highest earning potential, with monthly revenues capable of climbing to $948, occupancy reaching a high of 23.3%, and ADRs peaking at $142.
- Conversely, the slowest single month of the year, typically falling within the low season, marks the market's lowest point. In this month, revenue might dip to $128, occupancy could drop to 3.3%, and ADRs may adjust down to $128.
- Understanding both the seasonal averages and these monthly peaks and troughs in revenue, occupancy, and ADR is crucial for maximizing your Airbnb profit potential in Belau.
Seasonal Strategies for Maximizing Profit
- Peak Season: Maximize revenue through premium pricing and potentially longer minimum stays. Ensure high availability.
- Low Season: Offer competitive pricing, special promotions (e.g., extended stay discounts), and flexible cancellation policies. Target off-season travelers like remote workers or budget-conscious guests.
- Shoulder Seasons: Implement dynamic pricing that balances peak and low rates. Target weekend travelers or specific events. Offer slightly more flexible terms than peak season.
- Regularly analyze your own performance against these Belau seasonality benchmarks and adjust your pricing and availability strategy accordingly.
Best Areas for Airbnb Investment in Belau (2025)
Exploring the top neighborhoods for short-term rentals in Belau? This section highlights key areas, outlining why they are attractive for hosts and guests, along with notable local attractions. Consider these locations based on your target guest profile and investment strategy.
| Neighborhood / Area | Why Host Here? (Target Guests & Appeal) | Key Attractions & Landmarks |
|---|---|---|
| Koror | The largest city in Palau, offering rich cultural experiences and access to stunning natural wonders. A must for tourists interested in eco-tourism and diving. | Jellyfish Lake, Rock Islands, Palau National Marine Sanctuary, Palau Aquarium, Ngardmau Waterfall |
| Melekeok | The capital of Palau, known for its historical government buildings and beautiful surroundings. An emerging spot for those wanting to experience local governance and culture. | Palau's Capitol, Bai of Palau, Ngardmau Waterfall, Beautiful beaches |
| Ngerulmud | Located in the heart of Palau, it attracts visitors interested in both government and natural beauty. A quieter area with a unique blend of culture. | National Congress Building, Cultural exhibits, Nearby beaches |
| Aimeliik | A serene area with beautiful landscapes and rich biodiversity, perfect for nature lovers seeking tranquility and outdoor adventures. | Aimeliik Sports Complex, Scenic hiking trails, Natural parks |
| Ngaraard | Home to some of Palau's most pristine natural scenery and ideal for eco-tourism. A perfect area for hiking and exploring traditional life. | Ngaraard's waterfalls, Eco tours, Traditional villages |
| Peleliu | A historical island with significant World War II sites, attracting history buffs and those interested in both culture and nature. | Peleliu WWII Museum, Battlefield tours, Sandy beaches |
| Babeldaob | The largest island in Palau, known for its stunning landscapes and cultural sites. An off-the-beaten-path location for adventurous travelers. | Chadol Hill, Babeldaob's waterfalls, Megaliths, Cultural sites |
| Kayangel | An untouched paradise known for its pristine beaches and coral reefs. Ideal for a tranquil getaway and snorkeling. | Kayangel Island Beach, Snorkeling spots, Coral reefs |
Understanding Airbnb License Requirements & STR Laws in Belau (2025)
While Belau, Schleswig-Holstein, Germany currently shows low STR regulations, specific Airbnb license requirements might still exist or change. Always verify the latest short term rental regulations and Airbnb license requirements directly with local government authorities for Belau to ensure full compliance before hosting.
(Source: AirROI data, 2025, finding no licensed listings among those analyzed)
Top Performing Airbnb Properties in Belau (2025)
Benchmark your potential! Explore examples of top-performing Airbnb properties in Belaubased on Trailing Twelve Month (TTM) revenue. Analyze their characteristics, revenue, occupancy rate, and ADR to understand what drives success in this market.

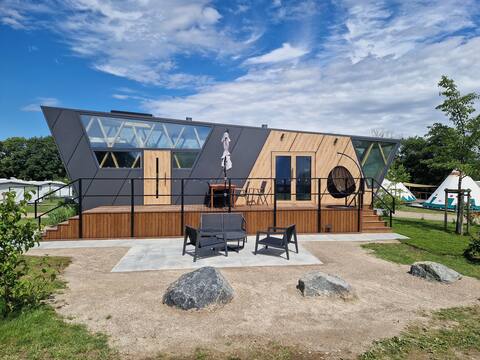
Home on Lake Belau
Entire Place • 2 bedrooms
Tinyhouse ContiHome next Level
Entire Place • 2 bedrooms
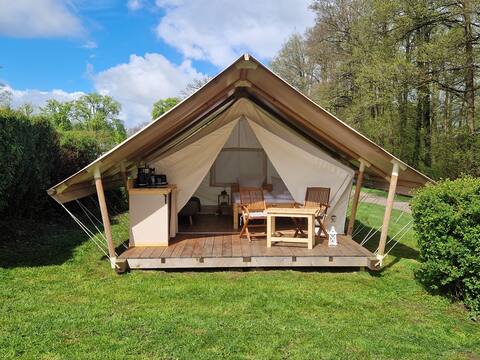
Safarizelt Planica
Entire Place • 1 bedroom
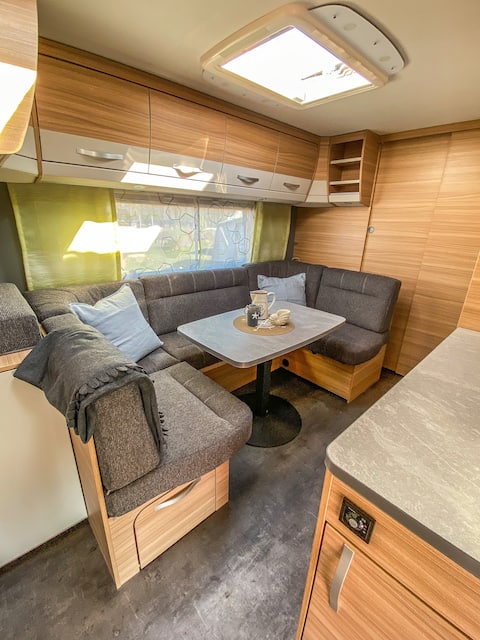
George Glamper Camper Northern Lights
Private Room • N/A
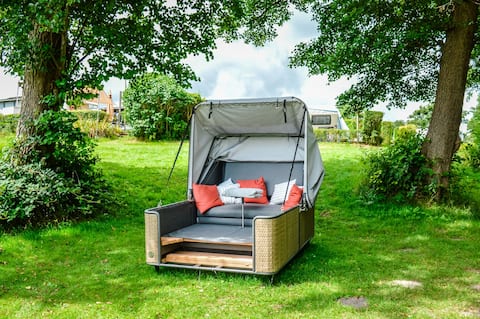
Sleeping beach chair outdoor lounge (3)
Private Room • N/A
Vacation home Nordic Thor
Entire Place • 2 bedrooms
Note: Performance varies based on location, size, amenities, seasonality, and management quality. Data reflects the past 12 months.
Top Performing Airbnb Hosts in Belau (2025)
Learn from the best! This table showcases top-performing Airbnb hosts in Belau based on the number of properties managed and estimated total revenue over the past year. Analyze their scale and performance metrics.
| Host Name | Properties | Grossing Revenue | Stay Reviews | Avg Rating |
|---|---|---|---|---|
| George | 25 | $43,249 | 257 | 4.80/5.0 |
| Simone | 1 | $16,851 | 23 | 5.00/5.0 |
Analyzing the strategies of top hosts, such as their property selection, pricing, and guest communication, can offer valuable lessons for optimizing your own Airbnb operations in Belau.
Dive Deeper: Advanced Belau STR Market Data (2025)
Ready to unlock more insights? AirROI provides access to advanced metrics and comprehensive Airbnb data for Belau. Explore detailed analytics beyond this report to refine your investment strategy, optimize pricing, and maximize your vacation rental profits.
Explore Advanced MetricsBelau Short-Term Rental Market Composition (2025): Property & Room Types
Room Type Distribution
Property Type Distribution
Market Composition Insights for Belau
- The Belau Airbnb market composition is heavily skewed towards Entire Home/Apt listings, which make up 92.3% of the 26 active rentals. This indicates strong guest preference for privacy and space.
- Looking at the property type distribution in Belau, Outdoor/Unique properties are the most common (30.8%), reflecting the local real estate landscape.
- Houses represent a significant 15.4% portion, catering likely to families or larger groups.
Belau Airbnb Room Capacity Analysis (2025): Bedroom Distribution
Distribution of Listings by Number of Bedrooms
Room Capacity Insights for Belau
- The dominant room capacity in Belau is 1 bedroom listings, making up 50% of the market. This suggests a strong demand for properties suitable for couples or solo travelers.
- Together, 1 bedroom and 2 bedrooms properties represent 69.2% of the active Airbnb listings in Belau, indicating a high concentration in these sizes.
Belau Vacation Rental Guest Capacity Trends (2025)
Distribution of Listings by Guest Capacity
Guest Capacity Insights for Belau
- The most common guest capacity trend in Belau vacation rentals is listings accommodating 4 guests (42.3%). This suggests the primary traveler segment is likely small families or groups.
- Properties designed for 4 guests and 2 guests dominate the Belau STR market, accounting for 61.5% of listings.
- On average, properties in Belau are equipped to host 2.6 guests.
Belau Airbnb Booking Patterns (2025): Available vs. Booked Days
Available Days Distribution
Booked Days Distribution
Booking Pattern Insights for Belau
- The most common availability pattern in Belau falls within the 271-366 days range, representing 96.2% of listings. This suggests many properties have significant open periods on their calendars.
- Approximately 100.0% of listings show high availability (181+ days open annually), indicating potential for increased bookings or specific owner usage patterns.
- For booked days, the 1-30 days range is most frequent in Belau (80.8%), reflecting common guest stay durations or potential owner blocking patterns.
Belau Airbnb Minimum Stay Requirements Analysis
Distribution of Listings by Minimum Night Requirement
1 Night
4 listings
15.4% of total
30+ Nights
22 listings
84.6% of total
Key Insights
- The most prevalent minimum stay requirement in Belau is 30+ Nights, adopted by 84.6% of listings. This highlights the market's preference for longer commitments.
- Very short stays (1-2 nights) are less common (15.4%), suggesting hosts prefer slightly longer bookings to optimize turnover.
- A significant segment (84.6%) caters to monthly stays (30+ nights) in Belau, pointing to opportunities in the extended-stay market.
Recommendations
- Align with the market by considering a 30+ Nights minimum stay, as 84.6% of Belau hosts use this setting.
- If feasible, allowing 1-night stays, especially midweek or during low season, could capture last-minute bookings, as only 15.4% currently do.
- Explore offering discounts for stays of 30+ nights to attract the 84.6% of the market seeking extended stays.
- Adjust minimum nights based on seasonality – potentially shorter during low season and longer during peak demand periods in Belau.
Belau Airbnb Cancellation Policy Trends Analysis (2025)
Firm
1 listings
3.8% of total
Strict
25 listings
96.2% of total
Cancellation Policy Insights for Belau
- The prevailing Airbnb cancellation policy trend in Belau is Strict, used by 96.2% of listings.
- A majority (100.0%) of hosts in Belau utilize Firm or Strict policies, indicating a market where hosts prioritize booking security.
Recommendations for Hosts
- Consider adopting a Strict policy to align with the 96.2% market standard in Belau.
- With 96.2% using Strict terms, this is a viable option in Belau, particularly for high-value properties or during peak demand periods.
- Regularly review your cancellation policy against competitors and market demand shifts in Belau.
Belau STR Booking Lead Time Analysis (2025)
Average Booking Lead Time by Month
Booking Lead Time Insights for Belau
- The overall average booking lead time for vacation rentals in Belau is 7 days.
- Guests book furthest in advance for stays during May (average 38 days), likely coinciding with peak travel demand or local events.
- The shortest booking windows occur for stays in September (average 1 days), indicating more last-minute travel plans during this time.
- Seasonally, Summer (22 days avg.) sees the longest lead times, while Winter (2 days avg.) has the shortest, reflecting typical travel planning cycles.
Recommendations for Hosts
- Use the overall average lead time (7 days) as a baseline for your pricing and availability strategy in Belau.
- For May stays, consider implementing length-of-stay discounts or slightly higher rates for bookings made less than 38 days out to capitalize on advance planning.
- Target marketing efforts for the Summer season well in advance (at least 22 days) to capture early planners.
- Monitor your own booking lead times against these Belau averages to identify opportunities for dynamic pricing adjustments.
Popular & Essential Airbnb Amenities in Belau (2025)
Amenity Prevalence
Amenity Insights for Belau
- Essential amenities in Belau that guests expect include: BBQ grill, Hot water, Free parking on premises, Sauna. Lacking these (any) could significantly impact bookings.
- Popular amenities like Dryer, Smoke alarm, Washer are common but not universal. Offering these can provide a competitive edge.
Recommendations for Hosts
- Ensure your listing includes all essential amenities for Belau: BBQ grill, Hot water, Free parking on premises, Sauna.
- Prioritize adding missing essentials: Hot water, Free parking on premises, Sauna.
- Consider adding popular differentiators like Dryer or Smoke alarm to increase appeal.
- Highlight unique or less common amenities you offer (e.g., hot tub, dedicated workspace, EV charger) in your listing description and photos.
- Regularly check competitor amenities in Belau to stay competitive.
Belau Airbnb Guest Demographics & Profile Analysis (2025)
Guest Profile Summary for Belau
- The typical guest profile for Airbnb in Belau consists of primarily domestic travelers (100%), often arriving from nearby Seelze.
- Domestic travelers account for 100.0% of guests.
Recommendations for Hosts
- Target domestic marketing efforts towards travelers from Seelze and Nordfriesland.
- Highlight unique local experiences or amenities relevant to the primary guest profile.
- Consider seasonal promotions aligned with peak travel times for key origin markets.
Nearby Short-Term Rental Market Comparison
How does the Belau Airbnb market stack up against its neighbors? Compare key performance metrics like average monthly revenue, ADR, and occupancy rates in surrounding areas to understand the broader regional STR landscape.
| Market | Active Properties | Monthly Revenue | Daily Rate | Avg. Occupancy |
|---|---|---|---|---|
| Lohals | 20 | $3,098 | $343.22 | 38% |
| Wittenbeck | 14 | $2,515 | $214.51 | 40% |
| Tørresø Strand | 26 | $2,293 | $241.38 | 43% |
| Rude Strand | 28 | $2,229 | $256.20 | 38% |
| Korshavn | 15 | $2,227 | $262.44 | 41% |
| Ærøskøbing | 30 | $2,226 | $185.51 | 47% |
| Billund | 96 | $2,165 | $192.49 | 48% |
| Stapel | 10 | $2,149 | $291.45 | 33% |
| Stillinge Strand | 22 | $2,054 | $236.97 | 37% |
| Hamburg | 2,480 | $1,880 | $158.54 | 48% |