Wernigerode Airbnb Market Analysis 2026: Short Term Rental Data & Vacation Rental Statistics in Saxony-Anhalt, Germany
Is Airbnb profitable in Wernigerode in 2026? Explore comprehensive Airbnb analytics for Wernigerode, Saxony-Anhalt, Germany to uncover income potential. This 2026 STR market report for Wernigerode, based on AirROI data from February 2025 to January 2026, reveals key trends in the market of 283 active listings.
Whether you're considering an Airbnb investment in Wernigerode, optimizing your existing vacation rental, or exploring rental arbitrage opportunities, understanding the Wernigerode Airbnb data is crucial. Leveraging the low regulation environment is key to maximizing your short term rental income potential. Let's dive into the specifics.
Key Wernigerode Airbnb Performance Metrics Overview
Monthly Airbnb Revenue Variations & Income Potential in Wernigerode (2026)
Understanding the monthly revenue variations for Airbnb listings in Wernigerode is key to maximizing your short term rental income potential. Seasonality significantly impacts earnings. Our analysis, based on data from the past 12 months, shows that the peak revenue month for STRs in Wernigerode is typically October, while January often presents the lowest earnings, highlighting opportunities for strategic pricing adjustments during shoulder and low seasons. Explore the typical Airbnb income in Wernigerode across different performance tiers:
- Best-in-class properties (Top 10%) achieve $3,060+ monthly, often utilizing dynamic pricing and superior guest experiences.
- Strong performing properties (Top 25%) earn $2,063 or more, indicating effective management and desirable locations/amenities.
- Typical properties (Median) generate around $1,226 per month, representing the average market performance.
- Entry-level properties (Bottom 25%) see earnings around $593, often with potential for optimization.
Average Monthly Airbnb Earnings Trend in Wernigerode
Wernigerode Airbnb Occupancy Rate Trends (2026)
Maximize your bookings by understanding the Wernigerode STR occupancy trends. Seasonal demand shifts significantly influence how often properties are booked. Typically, Aprilsees the highest demand (peak season occupancy), while January experiences the lowest (low season). Effective strategies, like adjusting minimum stays or offering promotions, can boost occupancy during slower periods. Here's how different property tiers perform in Wernigerode:
- Best-in-class properties (Top 10%) achieve 77%+ occupancy, indicating high desirability and potentially optimized availability.
- Strong performing properties (Top 25%) maintain 58% or higher occupancy, suggesting good market fit and guest satisfaction.
- Typical properties (Median) have an occupancy rate around 34%.
- Entry-level properties (Bottom 25%) average 16% occupancy, potentially facing higher vacancy.
Average Monthly Occupancy Rate Trend in Wernigerode
Average Daily Rate (ADR) Airbnb Trends in Wernigerode (2026)
Effective short term rental pricing strategy in Wernigerode involves understanding monthly ADR fluctuations. The Average Daily Rate (ADR) for Airbnb in Wernigerode typically peaks in December and dips lowest during March. Leveraging Airbnb dynamic pricing tools or strategies based on this seasonality can significantly boost revenue. Here's a look at the typical nightly rates achieved:
- Best-in-class properties (Top 10%) command rates of $244+ per night, often due to premium features or locations.
- Strong performing properties (Top 25%) achieve nightly rates of $165 or more.
- Typical properties (Median) charge around $122 per night.
- Entry-level properties (Bottom 25%) earn around $94 per night.
Average Daily Rate (ADR) Trend by Month in Wernigerode
Get Live Wernigerode Market Intelligence 👇

Explore Real-time Analytics
Airbnb Seasonality Analysis & Trends in Wernigerode (2026)
Peak Season (October, July, August)
- Revenue averages $1,981 per month
- Occupancy rates average 46.8%
- Daily rates average $149
Shoulder Season
- Revenue averages $1,566 per month
- Occupancy maintains around 39.4%
- Daily rates hold near $144
Low Season (January, March, November)
- Revenue drops to average $1,157 per month
- Occupancy decreases to average 28.5%
- Daily rates adjust to average $141
Seasonality Insights for Wernigerode
- The Airbnb seasonality in Wernigerode shows moderate seasonality with distinct peak and low periods. While the sections above show seasonal averages, it's also insightful to look at the extremes:
- During the high season, the absolute peak month showcases Wernigerode's highest earning potential, with monthly revenues capable of climbing to $2,055, occupancy reaching a high of 47.5%, and ADRs peaking at $149.
- Conversely, the slowest single month of the year, typically falling within the low season, marks the market's lowest point. In this month, revenue might dip to $995, occupancy could drop to 23.0%, and ADRs may adjust down to $135.
- Understanding both the seasonal averages and these monthly peaks and troughs in revenue, occupancy, and ADR is crucial for maximizing your Airbnb profit potential in Wernigerode.
Seasonal Strategies for Maximizing Profit
- Peak Season: Maximize revenue through premium pricing and potentially longer minimum stays. Ensure high availability.
- Low Season: Offer competitive pricing, special promotions (e.g., extended stay discounts), and flexible cancellation policies. Target off-season travelers like remote workers or budget-conscious guests.
- Shoulder Seasons: Implement dynamic pricing that balances peak and low rates. Target weekend travelers or specific events. Offer slightly more flexible terms than peak season.
- Regularly analyze your own performance against these Wernigerode seasonality benchmarks and adjust your pricing and availability strategy accordingly.
Best Areas for Airbnb Investment in Wernigerode (2026)
Exploring the top neighborhoods for short-term rentals in Wernigerode? This section highlights key areas, outlining why they are attractive for hosts and guests, along with notable local attractions. Consider these locations based on your target guest profile and investment strategy.
| Neighborhood / Area | Why Host Here? (Target Guests & Appeal) | Key Attractions & Landmarks |
|---|---|---|
| Historic Town Center | The heart of Wernigerode, featuring charming timber-framed houses and a lively atmosphere. Ideal for tourists wanting to experience the local culture and history. | Wernigerode Castle, Town Hall, Market Square, Museum of Aviation and Technology, St. Sylvester Church |
| Schlosspark | A picturesque park surrounding Wernigerode Castle, perfect for family outings and nature lovers. Offers beautiful walking paths and views of the castle. | Wernigerode Castle, Botanical Garden, Nature trails, Playground, Picnic areas |
| Western Neighborhoods | A quieter area with residential charm, appealing for families and longer stays. Offers a more local experience while being close to key attractions. | Local markets, Parks, Family-friendly cafes, Community events, Walking paths |
| Höhenluft | Known for its scenic views and hiking opportunities, perfect for nature enthusiasts and those seeking outdoor activities. | Hiking trails, Harz National Park, Panoramic viewpoints, Bicycle routes, Local wildlife |
| Klüste | A quaint residential area with a friendly atmosphere, suitable for travelers looking for a peaceful retreat while being near the town center. | Community parks, Quiet walking paths, Cafes and bakeries, Local shops, Cultural events |
| East Wernigerode | An up-and-coming area with new developments, attracting younger crowds and offering a mix of local life and tourist access. | Modern cafes, Shopping options, Art galleries, Fitness centers, Local nightlife |
| Train Station Area | Conveniently located for travelers arriving by train, this area provides easy access to public transport and local services. | Wernigerode Railway Station, Public transport links, Shopping facilities, Local eateries, Cultural sites |
| Harz Mountains | Just outside Wernigerode, this area is ideal for outdoor adventures and attracting tourists year-round to enjoy skiing and hiking. | Skiing spots, Hiking trails, Natural parks, Scenic drives, Local accommodations |
Understanding Airbnb License Requirements & STR Laws in Wernigerode (2026)
While Wernigerode, Saxony-Anhalt, Germany currently shows low STR regulations, specific Airbnb license requirements might still exist or change. Always verify the latest short term rental regulations and Airbnb license requirements directly with local government authorities for Wernigerode to ensure full compliance before hosting.
(Source: AirROI data, 2026, based on 1% licensed listings)
Top Performing Airbnb Properties in Wernigerode (2026)
Benchmark your potential! Explore examples of top-performing Airbnb properties in Wernigerodebased on Trailing Twelve Month (TTM) revenue. Analyze their characteristics, revenue, occupancy rate, and ADR to understand what drives success in this market.
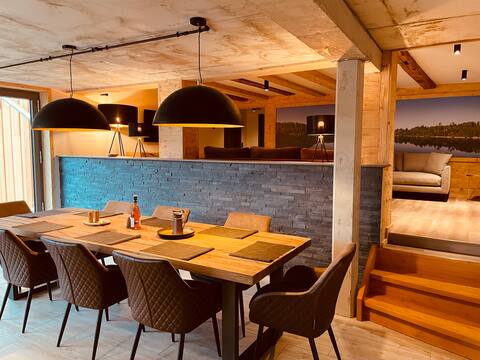
FourElements apartment with sauna and balcony
Entire Place • 4 bedrooms
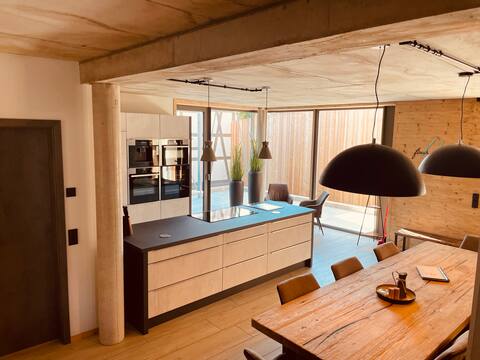
FourElements apartment with sauna and terrace
Entire Place • 4 bedrooms

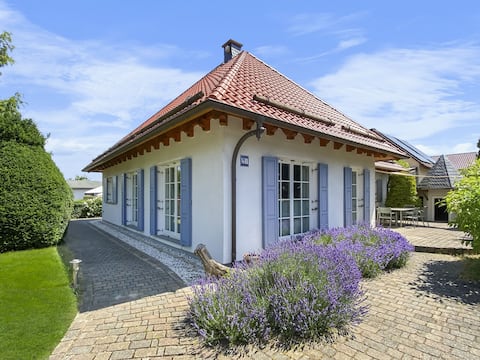
Brockenpfad vacation home for groups
Entire Place • 8 bedrooms
Kupferschmiede | Fireplace | Swing | Fire basket
Entire Place • 3 bedrooms

FourElements apartment with rooftop terrace and sauna
Entire Place • 3 bedrooms

Cozy residence with sauna
Entire Place • 2 bedrooms
Note: Performance varies based on location, size, amenities, seasonality, and management quality. Data reflects the past 12 months.
Top Performing Airbnb Hosts in Wernigerode (2026)
Learn from the best! This table showcases top-performing Airbnb hosts in Wernigerode based on the number of properties managed and estimated total revenue over the past year. Analyze their scale and performance metrics.
| Host Name | Properties | Grossing Revenue | Stay Reviews | Avg Rating |
|---|---|---|---|---|
| Sebastian | 4 | $281,379 | 133 | 4.93/5.0 |
| Robert | 27 | $228,551 | 118 | 4.69/5.0 |
| Julia | 7 | $191,904 | 76 | 4.86/5.0 |
| Robert | 5 | $152,037 | 249 | 4.76/5.0 |
| Maria | 5 | $147,443 | 72 | 4.92/5.0 |
| Gerrit | 5 | $123,532 | 65 | 4.91/5.0 |
| Renate | 9 | $122,678 | 2103 | 4.76/5.0 |
| Andrea | 6 | $119,169 | 242 | 4.67/5.0 |
| Elma - Belvilla | 5 | $109,505 | 26 | 4.48/5.0 |
| Jörg N. | 4 | $80,161 | 104 | 4.92/5.0 |
Analyzing the strategies of top hosts, such as their property selection, pricing, and guest communication, can offer valuable lessons for optimizing your own Airbnb operations in Wernigerode.
Dive Deeper: Advanced Wernigerode STR Market Data (2026)
Ready to unlock more insights? AirROI provides access to advanced metrics and comprehensive Airbnb data for Wernigerode. Explore detailed analytics beyond this report to refine your investment strategy, optimize pricing, and maximize your vacation rental profits.
Explore Advanced MetricsWernigerode Short-Term Rental Market Composition (2026): Property & Room Types
Room Type Distribution
Property Type Distribution
Market Composition Insights for Wernigerode
- The Wernigerode Airbnb market composition is heavily skewed towards Entire Home/Apt listings, which make up 92.6% of the 283 active rentals. This indicates strong guest preference for privacy and space.
- Looking at the property type distribution in Wernigerode, Apartment/Condo properties are the most common (68.6%), reflecting the local real estate landscape.
- Houses represent a significant 22.3% portion, catering likely to families or larger groups.
- The presence of 6.7% Hotel/Boutique listings indicates integration with traditional hospitality.
- Smaller segments like outdoor/unique, others (combined 2.5%) offer potential for unique stay experiences.
Wernigerode Airbnb Room Capacity Analysis (2026): Bedroom Distribution
Distribution of Listings by Number of Bedrooms
Room Capacity Insights for Wernigerode
- The dominant room capacity in Wernigerode is 1 bedroom listings, making up 48.1% of the market. This suggests a strong demand for properties suitable for couples or solo travelers.
- Together, 1 bedroom and 2 bedrooms properties represent 78.5% of the active Airbnb listings in Wernigerode, indicating a high concentration in these sizes.
Wernigerode Vacation Rental Guest Capacity Trends (2026)
Distribution of Listings by Guest Capacity
Guest Capacity Insights for Wernigerode
- The most common guest capacity trend in Wernigerode vacation rentals is listings accommodating 4 guests (31.8%). This suggests the primary traveler segment is likely small families or groups.
- Properties designed for 4 guests and 2 guests dominate the Wernigerode STR market, accounting for 57.9% of listings.
- 24.3% of properties accommodate 6+ guests, serving the market segment for larger families or group travel in Wernigerode.
- On average, properties in Wernigerode are equipped to host 4.0 guests.
Wernigerode Airbnb Booking Patterns (2026): Available vs. Booked Days
Available Days Distribution
Booked Days Distribution
Booking Pattern Insights for Wernigerode
- The most common availability pattern in Wernigerode falls within the 271-366 days range, representing 54.4% of listings. This suggests many properties have significant open periods on their calendars.
- Approximately 77.0% of listings show high availability (181+ days open annually), indicating potential for increased bookings or specific owner usage patterns.
- For booked days, the 31-90 days range is most frequent in Wernigerode (42%), reflecting common guest stay durations or potential owner blocking patterns.
- A notable 24.4% of properties secure long booking periods (181+ days booked per year), highlighting successful long-term rental strategies or significant owner usage.
Wernigerode Airbnb Minimum Stay Requirements Analysis
Distribution of Listings by Minimum Night Requirement
1 Night
41 listings
14.5% of total
2 Nights
58 listings
20.5% of total
3 Nights
50 listings
17.7% of total
4-6 Nights
7 listings
2.5% of total
30+ Nights
127 listings
44.9% of total
Key Insights
- The most prevalent minimum stay requirement in Wernigerode is 30+ Nights, adopted by 44.9% of listings. This highlights the market's preference for longer commitments.
- A significant segment (44.9%) caters to monthly stays (30+ nights) in Wernigerode, pointing to opportunities in the extended-stay market.
Recommendations
- Align with the market by considering a 30+ Nights minimum stay, as 44.9% of Wernigerode hosts use this setting.
- If feasible, allowing 1-night stays, especially midweek or during low season, could capture last-minute bookings, as only 14.5% currently do.
- Explore offering discounts for stays of 30+ nights to attract the 44.9% of the market seeking extended stays.
- Adjust minimum nights based on seasonality – potentially shorter during low season and longer during peak demand periods in Wernigerode.
Wernigerode Airbnb Cancellation Policy Trends Analysis (2026)
Super Strict 30 Days
14 listings
5% of total
Super Strict 60 Days
7 listings
2.5% of total
Flexible
64 listings
22.8% of total
Moderate
48 listings
17.1% of total
Firm
143 listings
50.9% of total
Strict
5 listings
1.8% of total
Cancellation Policy Insights for Wernigerode
- The prevailing Airbnb cancellation policy trend in Wernigerode is Firm, used by 50.9% of listings.
- A majority (52.7%) of hosts in Wernigerode utilize Firm or Strict policies, indicating a market where hosts prioritize booking security.
- Strict cancellation policies are quite rare (1.8%), potentially making listings with this policy less competitive unless justified by high demand or property type.
Recommendations for Hosts
- Consider adopting a Firm policy to align with the 50.9% market standard in Wernigerode.
- Using a Strict policy might deter some guests, as only 1.8% of listings use it. Evaluate if potential revenue protection outweighs possible lower booking rates.
- Regularly review your cancellation policy against competitors and market demand shifts in Wernigerode.
Wernigerode STR Booking Lead Time Analysis (2026)
Average Booking Lead Time by Month
Booking Lead Time Insights for Wernigerode
- The overall average booking lead time for vacation rentals in Wernigerode is 65 days.
- Guests book furthest in advance for stays during December (average 98 days), likely coinciding with peak travel demand or local events.
- The shortest booking windows occur for stays in March (average 27 days), indicating more last-minute travel plans during this time.
- Seasonally, Fall (75 days avg.) sees the longest lead times, while Spring (52 days avg.) has the shortest, reflecting typical travel planning cycles.
Recommendations for Hosts
- Use the overall average lead time (65 days) as a baseline for your pricing and availability strategy in Wernigerode.
- For December stays, consider implementing length-of-stay discounts or slightly higher rates for bookings made less than 98 days out to capitalize on advance planning.
- Target marketing efforts for the Fall season well in advance (at least 75 days) to capture early planners.
- Monitor your own booking lead times against these Wernigerode averages to identify opportunities for dynamic pricing adjustments.
Popular & Essential Airbnb Amenities in Wernigerode (2026)
Amenity Prevalence
Amenity Insights for Wernigerode
- Essential amenities in Wernigerode that guests expect include: Wifi, Heating, TV. Lacking these (any) could significantly impact bookings.
- Popular amenities like Kitchen, Refrigerator, Hot water are common but not universal. Offering these can provide a competitive edge.
Recommendations for Hosts
- Ensure your listing includes all essential amenities for Wernigerode: Wifi, Heating, TV.
- Prioritize adding missing essentials: Wifi, Heating, TV.
- Consider adding popular differentiators like Kitchen or Refrigerator to increase appeal.
- Highlight unique or less common amenities you offer (e.g., hot tub, dedicated workspace, EV charger) in your listing description and photos.
- Regularly check competitor amenities in Wernigerode to stay competitive.
Wernigerode Airbnb Guest Demographics & Profile Analysis (2026)
Guest Profile Summary for Wernigerode
- The typical guest profile for Airbnb in Wernigerode consists of primarily domestic travelers (85%), often arriving from nearby Berlin, typically belonging to the Post-2000s (Gen Z/Alpha) group (50%), primarily speaking English or German.
- Domestic travelers account for 85.1% of guests.
- Key international markets include Germany (85.1%) and Denmark (3.9%).
- Top languages spoken are English (40.4%) followed by German (37.5%).
- A significant demographic segment is the Post-2000s (Gen Z/Alpha) group, representing 50% of guests.
Recommendations for Hosts
- Target domestic marketing efforts towards travelers from Berlin and Hamburg.
- Tailor amenities and listing descriptions to appeal to the dominant Post-2000s (Gen Z/Alpha) demographic (e.g., highlight fast WiFi, smart home features, local guides).
- Highlight unique local experiences or amenities relevant to the primary guest profile.
- Consider seasonal promotions aligned with peak travel times for key origin markets.
Nearby Short-Term Rental Market Comparison
How does the Wernigerode Airbnb market stack up against its neighbors? Compare key performance metrics like average monthly revenue, ADR, and occupancy rates in surrounding areas to understand the broader regional STR landscape.
| Market | Active Properties | Monthly Revenue | Daily Rate | Avg. Occupancy |
|---|---|---|---|---|
| Herzberg | 18 | $1,879 | $193.86 | 38% |
| Sehnde | 16 | $1,820 | $148.37 | 41% |
| Bad Fallingbostel | 21 | $1,746 | $178.72 | 40% |
| Am Ettersberg | 16 | $1,712 | $167.99 | 43% |
| Elgershausen | 12 | $1,683 | $103.45 | 49% |
| Suderburg | 11 | $1,611 | $109.22 | 39% |
| Zella-Mehlis | 18 | $1,508 | $148.90 | 37% |
| Schlitz | 16 | $1,506 | $131.92 | 37% |
| Ruhla | 12 | $1,469 | $260.90 | 28% |
| Lüchow | 17 | $1,465 | $123.41 | 41% |