Mayen Airbnb Market Analysis 2026: Short Term Rental Data & Vacation Rental Statistics in Rhineland-Palatinate, Germany
Is Airbnb profitable in Mayen in 2026? Explore comprehensive Airbnb analytics for Mayen, Rhineland-Palatinate, Germany to uncover income potential. This 2026 STR market report for Mayen, based on AirROI data from February 2025 to January 2026, reveals key trends in the niche market of 47 active listings.
Whether you're considering an Airbnb investment in Mayen, optimizing your existing vacation rental, or exploring rental arbitrage opportunities, understanding the Mayen Airbnb data is crucial. Leveraging the low regulation environment is key to maximizing your short term rental income potential. Let's dive into the specifics.
Key Mayen Airbnb Performance Metrics Overview
Monthly Airbnb Revenue Variations & Income Potential in Mayen (2026)
Understanding the monthly revenue variations for Airbnb listings in Mayen is key to maximizing your short term rental income potential. Seasonality significantly impacts earnings. Our analysis, based on data from the past 12 months, shows that the peak revenue month for STRs in Mayen is typically August, while January often presents the lowest earnings, highlighting opportunities for strategic pricing adjustments during shoulder and low seasons. Explore the typical Airbnb income in Mayen across different performance tiers:
- Best-in-class properties (Top 10%) achieve $3,022+ monthly, often utilizing dynamic pricing and superior guest experiences.
- Strong performing properties (Top 25%) earn $2,043 or more, indicating effective management and desirable locations/amenities.
- Typical properties (Median) generate around $1,161 per month, representing the average market performance.
- Entry-level properties (Bottom 25%) see earnings around $614, often with potential for optimization.
Average Monthly Airbnb Earnings Trend in Mayen
Mayen Airbnb Occupancy Rate Trends (2026)
Maximize your bookings by understanding the Mayen STR occupancy trends. Seasonal demand shifts significantly influence how often properties are booked. Typically, Augustsees the highest demand (peak season occupancy), while January experiences the lowest (low season). Effective strategies, like adjusting minimum stays or offering promotions, can boost occupancy during slower periods. Here's how different property tiers perform in Mayen:
- Best-in-class properties (Top 10%) achieve 80%+ occupancy, indicating high desirability and potentially optimized availability.
- Strong performing properties (Top 25%) maintain 67% or higher occupancy, suggesting good market fit and guest satisfaction.
- Typical properties (Median) have an occupancy rate around 48%.
- Entry-level properties (Bottom 25%) average 29% occupancy, potentially facing higher vacancy.
Average Monthly Occupancy Rate Trend in Mayen
Average Daily Rate (ADR) Airbnb Trends in Mayen (2026)
Effective short term rental pricing strategy in Mayen involves understanding monthly ADR fluctuations. The Average Daily Rate (ADR) for Airbnb in Mayen typically peaks in December and dips lowest during March. Leveraging Airbnb dynamic pricing tools or strategies based on this seasonality can significantly boost revenue. Here's a look at the typical nightly rates achieved:
- Best-in-class properties (Top 10%) command rates of $187+ per night, often due to premium features or locations.
- Strong performing properties (Top 25%) achieve nightly rates of $105 or more.
- Typical properties (Median) charge around $82 per night.
- Entry-level properties (Bottom 25%) earn around $48 per night.
Average Daily Rate (ADR) Trend by Month in Mayen
Get Live Mayen Market Intelligence 👇

Explore Real-time Analytics
Airbnb Seasonality Analysis & Trends in Mayen (2026)
Peak Season (August, October, April)
- Revenue averages $2,089 per month
- Occupancy rates average 56.6%
- Daily rates average $99
Shoulder Season
- Revenue averages $1,675 per month
- Occupancy maintains around 48.6%
- Daily rates hold near $98
Low Season (January, February, November)
- Revenue drops to average $1,037 per month
- Occupancy decreases to average 34.9%
- Daily rates adjust to average $103
Seasonality Insights for Mayen
- The Airbnb seasonality in Mayen shows highly seasonal trends requiring careful strategy. While the sections above show seasonal averages, it's also insightful to look at the extremes:
- During the high season, the absolute peak month showcases Mayen's highest earning potential, with monthly revenues capable of climbing to $2,313, occupancy reaching a high of 64.9%, and ADRs peaking at $112.
- Conversely, the slowest single month of the year, typically falling within the low season, marks the market's lowest point. In this month, revenue might dip to $884, occupancy could drop to 24.2%, and ADRs may adjust down to $87.
- Understanding both the seasonal averages and these monthly peaks and troughs in revenue, occupancy, and ADR is crucial for maximizing your Airbnb profit potential in Mayen.
Seasonal Strategies for Maximizing Profit
- Peak Season: Maximize revenue through premium pricing and potentially longer minimum stays. Ensure high availability.
- Low Season: Offer competitive pricing, special promotions (e.g., extended stay discounts), and flexible cancellation policies. Target off-season travelers like remote workers or budget-conscious guests.
- Shoulder Seasons: Implement dynamic pricing that balances peak and low rates. Target weekend travelers or specific events. Offer slightly more flexible terms than peak season.
- Regularly analyze your own performance against these Mayen seasonality benchmarks and adjust your pricing and availability strategy accordingly.
Best Areas for Airbnb Investment in Mayen (2026)
Exploring the top neighborhoods for short-term rentals in Mayen? This section highlights key areas, outlining why they are attractive for hosts and guests, along with notable local attractions. Consider these locations based on your target guest profile and investment strategy.
| Neighborhood / Area | Why Host Here? (Target Guests & Appeal) | Key Attractions & Landmarks |
|---|---|---|
| Mayen Old Town | Charming historic area with medieval buildings, attracting visitors who appreciate history and culture. It offers a unique atmosphere with cobblestone streets and local shops. | Mayen Castle, St. Clemens Church, Museum der Stadt Mayen, Historic town square, Local artisan shops |
| Eifel National Park | Beautiful natural area attracting nature lovers and outdoor enthusiasts. Ideal for guests seeking hiking, biking, and breathtaking landscapes. | Eifel National Park, Wildlife watching, Hiking trails, Lake Rursee, Kelmis Geological Museum |
| Genoveva Castle | A popular landmark near Mayen, offering historical tours and beautiful views. It attracts tourists interested in local history and architecture. | Genoveva Castle, Historical tours, Scenic views of Mayen, Cultural events, Local guided tours |
| Mayen Market Square | Vibrant market area filled with local vendors, especially lively during the weekends. Great for guests looking for local experiences and fresh produce. | Weekly farmers' market, Local food stalls, Shopping options, Cafes and restaurants, Cultural events |
| Mäuseturm | Famous landmark across the Rhine, appealing to tourists interested in photography and scenic views. Perfect for day trips. | Mäuseturm, Rhine River views, Hiking paths, Nearby vineyards, Historical significance |
| Berg Eltz | One of Germany's most beautiful castles, set in a picturesque location, attracting tourists who enjoy history and photography. | Berg Eltz Castle, Guided tours, Hiking trails, Scenic surroundings, Photography opportunities |
| Trier | Historic city with Roman architecture and vibrant culture, appealing to tourists interested in history, dining, and shopping. | Porta Nigra, Trier Cathedral, Roman Amphitheater, Beautiful old town, Wine tasting tours |
| Cochem | Charming town on the Moselle River, known for its castle and picturesque scenery, attracting both local and international tourists. | Cochem Castle, Moselle River cruises, Scenic viewpoints, Local wine cellars, Charming old town |
Understanding Airbnb License Requirements & STR Laws in Mayen (2026)
While Mayen, Rhineland-Palatinate, Germany currently shows low STR regulations, specific Airbnb license requirements might still exist or change. Always verify the latest short term rental regulations and Airbnb license requirements directly with local government authorities for Mayen to ensure full compliance before hosting.
(Source: AirROI data, 2026, finding no licensed listings among those analyzed)
Top Performing Airbnb Properties in Mayen (2026)
Benchmark your potential! Explore examples of top-performing Airbnb properties in Mayenbased on Trailing Twelve Month (TTM) revenue. Analyze their characteristics, revenue, occupancy rate, and ADR to understand what drives success in this market.
Holiday home for 1-12 people with 4 bedrooms
Entire Place • 4 bedrooms
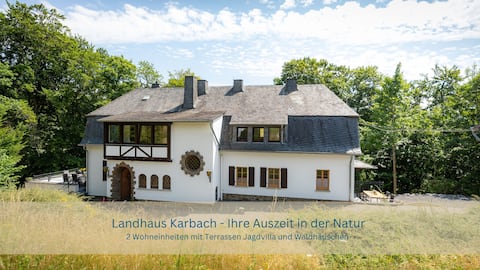
Hunting Villa Landhaus Karbach
Entire Place • 3 bedrooms

House on the dream path near Nürburgring
Entire Place • 5 bedrooms
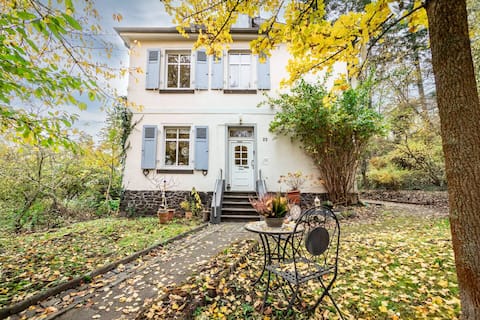
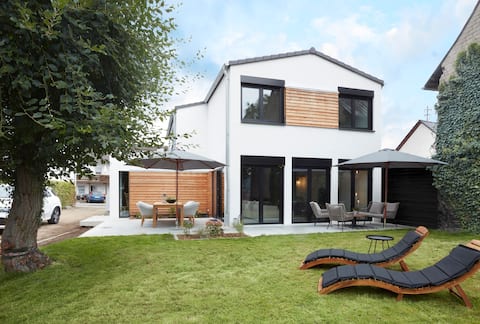
City & Nature – Historic Charm in Mayen
Entire Place • 2 bedrooms

Apartment close to nature in a climatic health resort
Entire Place • 2 bedrooms

Peaceful oasis in a natural health resort
Entire Place • 2 bedrooms
Note: Performance varies based on location, size, amenities, seasonality, and management quality. Data reflects the past 12 months.
Top Performing Airbnb Hosts in Mayen (2026)
Learn from the best! This table showcases top-performing Airbnb hosts in Mayen based on the number of properties managed and estimated total revenue over the past year. Analyze their scale and performance metrics.
| Host Name | Properties | Grossing Revenue | Stay Reviews | Avg Rating |
|---|---|---|---|---|
| Annabelle Désirée | 4 | $99,271 | 324 | 4.67/5.0 |
| Johanna Und Hubert | 1 | $89,877 | 33 | 5.00/5.0 |
| Jochen | 2 | $74,403 | 42 | 4.80/5.0 |
| Christina | 9 | $63,136 | 384 | 4.79/5.0 |
| Eleonore | 1 | $45,592 | 51 | 4.90/5.0 |
| Myriam | 3 | $35,858 | 871 | 4.79/5.0 |
| Bahar | 5 | $34,330 | 21 | 4.95/5.0 |
| Matthias | 1 | $22,565 | 30 | 5.00/5.0 |
| Esther | 1 | $22,417 | 16 | 4.94/5.0 |
| Gabriele | 1 | $20,257 | 23 | 4.96/5.0 |
Analyzing the strategies of top hosts, such as their property selection, pricing, and guest communication, can offer valuable lessons for optimizing your own Airbnb operations in Mayen.
Dive Deeper: Advanced Mayen STR Market Data (2026)
Ready to unlock more insights? AirROI provides access to advanced metrics and comprehensive Airbnb data for Mayen. Explore detailed analytics beyond this report to refine your investment strategy, optimize pricing, and maximize your vacation rental profits.
Explore Advanced MetricsMayen Short-Term Rental Market Composition (2026): Property & Room Types
Room Type Distribution
Property Type Distribution
Market Composition Insights for Mayen
- The Mayen Airbnb market composition is heavily skewed towards Entire Home/Apt listings, which make up 72.3% of the 47 active rentals. This indicates strong guest preference for privacy and space.
- Looking at the property type distribution in Mayen, Apartment/Condo properties are the most common (68.1%), reflecting the local real estate landscape.
- Houses represent a significant 31.9% portion, catering likely to families or larger groups.
Mayen Airbnb Room Capacity Analysis (2026): Bedroom Distribution
Distribution of Listings by Number of Bedrooms
Room Capacity Insights for Mayen
- The dominant room capacity in Mayen is 1 bedroom listings, making up 31.9% of the market. This suggests a strong demand for properties suitable for couples or solo travelers.
- Together, 1 bedroom and 2 bedrooms properties represent 59.6% of the active Airbnb listings in Mayen, indicating a high concentration in these sizes.
Mayen Vacation Rental Guest Capacity Trends (2026)
Distribution of Listings by Guest Capacity
Guest Capacity Insights for Mayen
- The most common guest capacity trend in Mayen vacation rentals is listings accommodating 2 guests (27.7%). This suggests the primary traveler segment is likely couples or solo travelers.
- Properties designed for 2 guests and 4 guests dominate the Mayen STR market, accounting for 44.7% of listings.
- 21.3% of properties accommodate 6+ guests, serving the market segment for larger families or group travel in Mayen.
- On average, properties in Mayen are equipped to host 3.1 guests.
Mayen Airbnb Booking Patterns (2026): Available vs. Booked Days
Available Days Distribution
Booked Days Distribution
Booking Pattern Insights for Mayen
- The most common availability pattern in Mayen falls within the 271-366 days range, representing 42.6% of listings. This suggests many properties have significant open periods on their calendars.
- Approximately 74.5% of listings show high availability (181+ days open annually), indicating potential for increased bookings or specific owner usage patterns.
- For booked days, the 91-180 days range is most frequent in Mayen (36.2%), reflecting common guest stay durations or potential owner blocking patterns.
- A notable 25.5% of properties secure long booking periods (181+ days booked per year), highlighting successful long-term rental strategies or significant owner usage.
Mayen Airbnb Minimum Stay Requirements Analysis
Distribution of Listings by Minimum Night Requirement
1 Night
15 listings
31.9% of total
2 Nights
9 listings
19.1% of total
3 Nights
5 listings
10.6% of total
4-6 Nights
1 listings
2.1% of total
7-29 Nights
2 listings
4.3% of total
30+ Nights
15 listings
31.9% of total
Key Insights
- The most prevalent minimum stay requirement in Mayen is 1 Night, adopted by 31.9% of listings. This highlights the market's preference for shorter, flexible bookings.
- A significant segment (31.9%) caters to monthly stays (30+ nights) in Mayen, pointing to opportunities in the extended-stay market.
Recommendations
- Align with the market by considering a 1 Night minimum stay, as 31.9% of Mayen hosts use this setting.
- Explore offering discounts for stays of 30+ nights to attract the 31.9% of the market seeking extended stays.
- Adjust minimum nights based on seasonality – potentially shorter during low season and longer during peak demand periods in Mayen.
Mayen Airbnb Cancellation Policy Trends Analysis (2026)
Flexible
12 listings
25.5% of total
Moderate
16 listings
34% of total
Firm
7 listings
14.9% of total
Strict
12 listings
25.5% of total
Cancellation Policy Insights for Mayen
- The prevailing Airbnb cancellation policy trend in Mayen is Moderate, used by 34% of listings.
- There's a relatively balanced mix between guest-friendly (59.5%) and stricter (40.4%) policies, offering choices for different guest needs.
Recommendations for Hosts
- Consider adopting a Moderate policy to align with the 34% market standard in Mayen.
- Regularly review your cancellation policy against competitors and market demand shifts in Mayen.
Mayen STR Booking Lead Time Analysis (2026)
Average Booking Lead Time by Month
Booking Lead Time Insights for Mayen
- The overall average booking lead time for vacation rentals in Mayen is 69 days.
- Guests book furthest in advance for stays during June (average 103 days), likely coinciding with peak travel demand or local events.
- The shortest booking windows occur for stays in November (average 30 days), indicating more last-minute travel plans during this time.
- Seasonally, Summer (88 days avg.) sees the longest lead times, while Winter (40 days avg.) has the shortest, reflecting typical travel planning cycles.
Recommendations for Hosts
- Use the overall average lead time (69 days) as a baseline for your pricing and availability strategy in Mayen.
- For June stays, consider implementing length-of-stay discounts or slightly higher rates for bookings made less than 103 days out to capitalize on advance planning.
- Target marketing efforts for the Summer season well in advance (at least 88 days) to capture early planners.
- Monitor your own booking lead times against these Mayen averages to identify opportunities for dynamic pricing adjustments.
Popular & Essential Airbnb Amenities in Mayen (2026)
Amenity Prevalence
Amenity Insights for Mayen
- Essential amenities in Mayen that guests expect include: Smoke alarm, Wifi. Lacking these (any) could significantly impact bookings.
- Popular amenities like Kitchen, Refrigerator, Heating are common but not universal. Offering these can provide a competitive edge.
Recommendations for Hosts
- Ensure your listing includes all essential amenities for Mayen: Smoke alarm, Wifi.
- Prioritize adding missing essentials: Smoke alarm, Wifi.
- Consider adding popular differentiators like Kitchen or Refrigerator to increase appeal.
- Highlight unique or less common amenities you offer (e.g., hot tub, dedicated workspace, EV charger) in your listing description and photos.
- Regularly check competitor amenities in Mayen to stay competitive.
Mayen Airbnb Guest Demographics & Profile Analysis (2026)
Guest Profile Summary for Mayen
- The typical guest profile for Airbnb in Mayen consists of a mix of domestic (61%) and international guests, often arriving from nearby Cologne, typically belonging to the Post-2000s (Gen Z/Alpha) group (50%), primarily speaking English or German.
- Domestic travelers account for 61.1% of guests.
- Key international markets include Germany (61.1%) and Netherlands (18.6%).
- Top languages spoken are English (37.9%) followed by German (29.7%).
- A significant demographic segment is the Post-2000s (Gen Z/Alpha) group, representing 50% of guests.
Recommendations for Hosts
- Target domestic marketing efforts towards travelers from Cologne and Frankfurt.
- Tailor amenities and listing descriptions to appeal to the dominant Post-2000s (Gen Z/Alpha) demographic (e.g., highlight fast WiFi, smart home features, local guides).
- Highlight unique local experiences or amenities relevant to the primary guest profile.
- Consider seasonal promotions aligned with peak travel times for key origin markets.
Nearby Short-Term Rental Market Comparison
How does the Mayen Airbnb market stack up against its neighbors? Compare key performance metrics like average monthly revenue, ADR, and occupancy rates in surrounding areas to understand the broader regional STR landscape.
| Market | Active Properties | Monthly Revenue | Daily Rate | Avg. Occupancy |
|---|---|---|---|---|
| Baarlo | 20 | $5,442 | $332.61 | 51% |
| Kruft | 13 | $3,022 | $258.41 | 37% |
| Waimes | 28 | $2,758 | $386.84 | 31% |
| Unkel | 21 | $2,746 | $212.11 | 38% |
| Büllingen | 27 | $2,744 | $302.32 | 36% |
| Malmedy | 216 | $2,726 | $308.37 | 36% |
| Ondenval | 12 | $2,708 | $221.09 | 41% |
| Raeren | 17 | $2,666 | $186.97 | 47% |
| Bütgenbach | 33 | $2,590 | $309.20 | 36% |
| Antweiler | 10 | $2,567 | $232.59 | 40% |