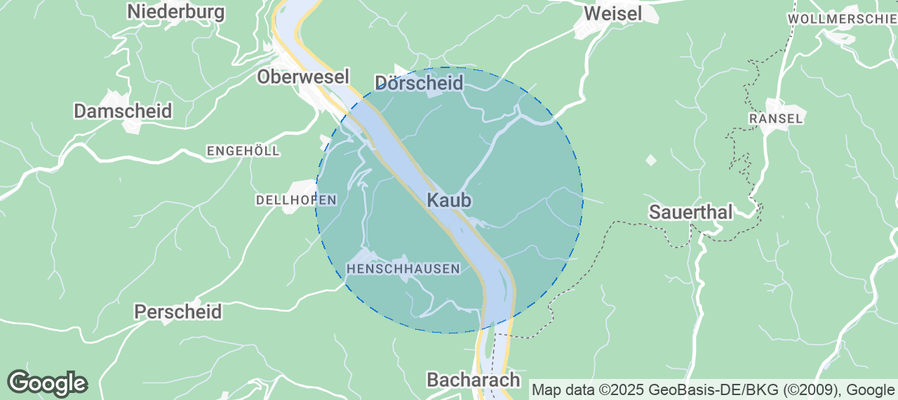
Kaub Airbnb Market Analysis 2026: Short Term Rental Data & Vacation Rental Statistics in Rhineland-Palatinate, Germany
Is Airbnb profitable in Kaub in 2026? Explore comprehensive Airbnb analytics for Kaub, Rhineland-Palatinate, Germany to uncover income potential. This 2026 STR market report for Kaub, based on AirROI data from February 2025 to January 2026, reveals key trends in the niche market of 19 active listings.
Whether you're considering an Airbnb investment in Kaub, optimizing your existing vacation rental, or exploring rental arbitrage opportunities, understanding the Kaub Airbnb data is crucial. Leveraging the low regulation environment is key to maximizing your short term rental income potential. Let's dive into the specifics.
Key Kaub Airbnb Performance Metrics Overview
Monthly Airbnb Revenue Variations & Income Potential in Kaub (2026)
Understanding the monthly revenue variations for Airbnb listings in Kaub is key to maximizing your short term rental income potential. Seasonality significantly impacts earnings. Our analysis, based on data from the past 12 months, shows that the peak revenue month for STRs in Kaub is typically August, while January often presents the lowest earnings, highlighting opportunities for strategic pricing adjustments during shoulder and low seasons. Explore the typical Airbnb income in Kaub across different performance tiers:
- Best-in-class properties (Top 10%) achieve $1,839+ monthly, often utilizing dynamic pricing and superior guest experiences.
- Strong performing properties (Top 25%) earn $1,210 or more, indicating effective management and desirable locations/amenities.
- Typical properties (Median) generate around $745 per month, representing the average market performance.
- Entry-level properties (Bottom 25%) see earnings around $372, often with potential for optimization.
Average Monthly Airbnb Earnings Trend in Kaub
Kaub Airbnb Occupancy Rate Trends (2026)
Maximize your bookings by understanding the Kaub STR occupancy trends. Seasonal demand shifts significantly influence how often properties are booked. Typically, Augustsees the highest demand (peak season occupancy), while January experiences the lowest (low season). Effective strategies, like adjusting minimum stays or offering promotions, can boost occupancy during slower periods. Here's how different property tiers perform in Kaub:
- Best-in-class properties (Top 10%) achieve 57%+ occupancy, indicating high desirability and potentially optimized availability.
- Strong performing properties (Top 25%) maintain 39% or higher occupancy, suggesting good market fit and guest satisfaction.
- Typical properties (Median) have an occupancy rate around 22%.
- Entry-level properties (Bottom 25%) average 13% occupancy, potentially facing higher vacancy.
Average Monthly Occupancy Rate Trend in Kaub
Average Daily Rate (ADR) Airbnb Trends in Kaub (2026)
Effective short term rental pricing strategy in Kaub involves understanding monthly ADR fluctuations. The Average Daily Rate (ADR) for Airbnb in Kaub typically peaks in July and dips lowest during March. Leveraging Airbnb dynamic pricing tools or strategies based on this seasonality can significantly boost revenue. Here's a look at the typical nightly rates achieved:
- Best-in-class properties (Top 10%) command rates of $147+ per night, often due to premium features or locations.
- Strong performing properties (Top 25%) achieve nightly rates of $127 or more.
- Typical properties (Median) charge around $101 per night.
- Entry-level properties (Bottom 25%) earn around $89 per night.
Average Daily Rate (ADR) Trend by Month in Kaub
Get Live Kaub Market Intelligence 👇
Explore Real-time Analytics
Airbnb Seasonality Analysis & Trends in Kaub (2026)
Peak Season (August, July, June)
- Revenue averages $1,262 per month
- Occupancy rates average 35.8%
- Daily rates average $114
Shoulder Season
- Revenue averages $919 per month
- Occupancy maintains around 30.6%
- Daily rates hold near $107
Low Season (January, February, November)
- Revenue drops to average $506 per month
- Occupancy decreases to average 17.1%
- Daily rates adjust to average $109
Seasonality Insights for Kaub
- The Airbnb seasonality in Kaub shows highly seasonal trends requiring careful strategy. While the sections above show seasonal averages, it's also insightful to look at the extremes:
- During the high season, the absolute peak month showcases Kaub's highest earning potential, with monthly revenues capable of climbing to $1,430, occupancy reaching a high of 37.6%, and ADRs peaking at $117.
- Conversely, the slowest single month of the year, typically falling within the low season, marks the market's lowest point. In this month, revenue might dip to $442, occupancy could drop to 10.0%, and ADRs may adjust down to $96.
- Understanding both the seasonal averages and these monthly peaks and troughs in revenue, occupancy, and ADR is crucial for maximizing your Airbnb profit potential in Kaub.
Seasonal Strategies for Maximizing Profit
- Peak Season: Maximize revenue through premium pricing and potentially longer minimum stays. Ensure high availability.
- Low Season: Offer competitive pricing, special promotions (e.g., extended stay discounts), and flexible cancellation policies. Target off-season travelers like remote workers or budget-conscious guests.
- Shoulder Seasons: Implement dynamic pricing that balances peak and low rates. Target weekend travelers or specific events. Offer slightly more flexible terms than peak season.
- Regularly analyze your own performance against these Kaub seasonality benchmarks and adjust your pricing and availability strategy accordingly.
Best Areas for Airbnb Investment in Kaub (2026)
Exploring the top neighborhoods for short-term rentals in Kaub? This section highlights key areas, outlining why they are attractive for hosts and guests, along with notable local attractions. Consider these locations based on your target guest profile and investment strategy.
| Neighborhood / Area | Why Host Here? (Target Guests & Appeal) | Key Attractions & Landmarks |
|---|---|---|
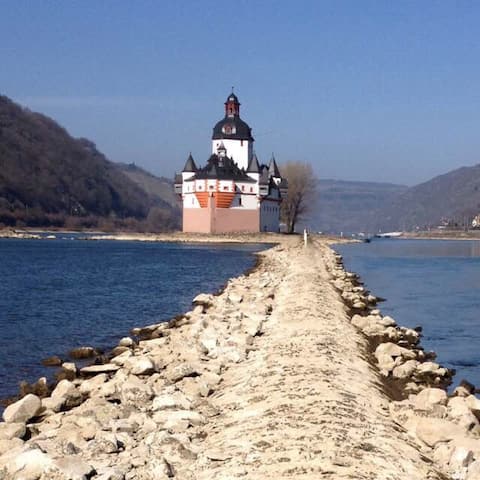
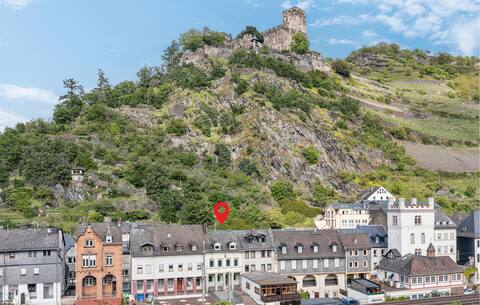
| Kaub Old Town | Charming historical area along the Rhine River, famous for its medieval architecture and proximity to local wineries. Perfect for tourists looking for a cultural and scenic getaway. | Katz Castle, Rhine Valley wineries, Local festivals, Scenic river walks, Cruises on the Rhine |
| Rheinstein Castle | A stunning castle located just outside Kaub offering picturesque views of the Rhine. Appeals to history enthusiasts and tourists interested in castle tours. | Rheinstein Castle, Hiking trails, Romantic views of the Rhine, Historical exhibitions, Local gastronomy |
| Lorelei Rock | A famous rock along the Rhine known for its legends and stunning views, attracting many tourists each year. A great spot for nature lovers and photography. | Lorelei viewpoint, Boat tours, Hiking paths, Legend of Lorelei, Nearby villages |
| Bacharach | A quaint town nearby known for its well-preserved medieval buildings and vineyards. Attracts those interested in wine tourism and historical tours. | Bacharach old town, Some of the best Riesling, Historical wine cellars, Scenic walking paths, Wine festivals |
| Sankt Goar | Another beautiful town on the Rhine River, known for its regional wines and historical sites like the Burg Rheinfels castle. Great for tourists looking for an authentic experience. | Burg Rheinfels, Sankt Goar old town, Wine tasting experiences, Rhine River cruises, Nature trails |
| Rüdesheim am Rhein | A popular tourist destination known for its bustling Drosselgasse with cafes and shops. Offers a vibrant atmosphere and proximity to Rhine River attractions. | Drosselgasse, Niederwald Monument, Wine cellars, Rhine River cruises, Festivals |
| Assmannshausen | A small village famous for its red wines and beautiful views, ideal for visitors seeking a quieter experience away from the busier towns along the Rhine. | Winery tours, Scenic views of the Rhine, Hiking trails, Local dining experiences |
| Dornach | A scenic village known for its picturesque landscape and wineries, great for those who want to explore the vineyards and enjoy peaceful surroundings. | Vineyard tours, River views, Local markets, Hiking opportunities, Cultural events |
Understanding Airbnb License Requirements & STR Laws in Kaub (2026)
While Kaub, Rhineland-Palatinate, Germany currently shows low STR regulations, specific Airbnb license requirements might still exist or change. Always verify the latest short term rental regulations and Airbnb license requirements directly with local government authorities for Kaub to ensure full compliance before hosting.
(Source: AirROI data, 2026, finding no licensed listings among those analyzed)
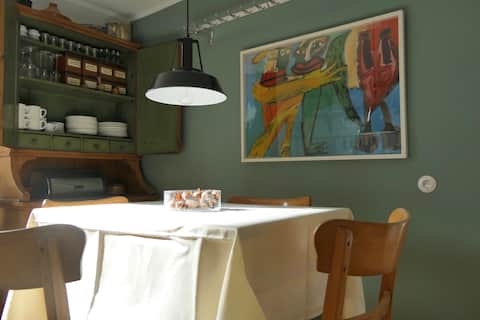
Top Performing Airbnb Properties in Kaub (2026)
Benchmark your potential! Explore examples of top-performing Airbnb properties in Kaubbased on Trailing Twelve Month (TTM) revenue. Analyze their characteristics, revenue, occupancy rate, and ADR to understand what drives success in this market.
Guest house in historic Kaub
Entire Place • 4 bedrooms
Swallow's nest directly on the Rheinsteig hiking trail
Entire Place • 1 bedroom

Former slate mine with gorgeous river view
Entire Place • 3 bedrooms

Historic Skipper House in Old Town
Entire Place • 2 bedrooms
Burgblick
Entire Place • 1 bedroom
Palatinate Forest
Entire Place • 1 bedroom
Note: Performance varies based on location, size, amenities, seasonality, and management quality. Data reflects the past 12 months.
Top Performing Airbnb Hosts in Kaub (2026)
Learn from the best! This table showcases top-performing Airbnb hosts in Kaub based on the number of properties managed and estimated total revenue over the past year. Analyze their scale and performance metrics.
| Host Name | Properties | Grossing Revenue | Stay Reviews | Avg Rating |
|---|---|---|---|---|
| Dirk | 3 | $34,886 | 551 | 4.97/5.0 |
| Novasol | 3 | $26,093 | 10 | 3.85/5.0 |
| Oliver | 4 | $14,099 | 14 | 5.00/5.0 |
| Marion | 1 | $13,913 | 389 | 4.92/5.0 |
| Kirsten | 2 | $12,990 | 327 | 4.75/5.0 |
| Ying | 2 | $10,253 | 257 | 4.78/5.0 |
| Stefan | 1 | $8,144 | 4 | 4.50/5.0 |
| Heidrun | 1 | $8,107 | 57 | 4.79/5.0 |
| Hilde | 1 | $3,353 | 13 | 5.00/5.0 |
| Giedre | 1 | $1,263 | 3 | 4.33/5.0 |
Analyzing the strategies of top hosts, such as their property selection, pricing, and guest communication, can offer valuable lessons for optimizing your own Airbnb operations in Kaub.
Dive Deeper: Advanced Kaub STR Market Data (2026)
Ready to unlock more insights? AirROI provides access to advanced metrics and comprehensive Airbnb data for Kaub. Explore detailed analytics beyond this report to refine your investment strategy, optimize pricing, and maximize your vacation rental profits.
Explore Advanced MetricsKaub Short-Term Rental Market Composition (2026): Property & Room Types
Room Type Distribution
Property Type Distribution
Market Composition Insights for Kaub
- The Kaub Airbnb market composition is heavily skewed towards Entire Home/Apt listings, which make up 94.7% of the 19 active rentals. This indicates strong guest preference for privacy and space.
- Looking at the property type distribution in Kaub, Apartment/Condo properties are the most common (63.2%), reflecting the local real estate landscape.
- Houses represent a significant 36.8% portion, catering likely to families or larger groups.
Kaub Airbnb Room Capacity Analysis (2026): Bedroom Distribution
Distribution of Listings by Number of Bedrooms
Room Capacity Insights for Kaub
- The dominant room capacity in Kaub is 1 bedroom listings, making up 73.7% of the market. This suggests a strong demand for properties suitable for couples or solo travelers.
- Together, 1 bedroom and 2 bedrooms properties represent 89.5% of the active Airbnb listings in Kaub, indicating a high concentration in these sizes.
- With over half the market (73.7%) consisting of studios or 1-bedroom units, Kaub is particularly well-suited for individuals or couples.
Kaub Vacation Rental Guest Capacity Trends (2026)
Distribution of Listings by Guest Capacity
Guest Capacity Insights for Kaub
- The most common guest capacity trend in Kaub vacation rentals is listings accommodating 4 guests (52.6%). This suggests the primary traveler segment is likely small families or groups.
- Properties designed for 4 guests and 2 guests dominate the Kaub STR market, accounting for 78.9% of listings.
- 10.6% of properties accommodate 6+ guests, serving the market segment for larger families or group travel in Kaub.
- On average, properties in Kaub are equipped to host 3.8 guests.
Kaub Airbnb Booking Patterns (2026): Available vs. Booked Days
Available Days Distribution
Booked Days Distribution
Booking Pattern Insights for Kaub
- The most common availability pattern in Kaub falls within the 271-366 days range, representing 78.9% of listings. This suggests many properties have significant open periods on their calendars.
- Approximately 100.0% of listings show high availability (181+ days open annually), indicating potential for increased bookings or specific owner usage patterns.
- For booked days, the 31-90 days range is most frequent in Kaub (52.6%), reflecting common guest stay durations or potential owner blocking patterns.
Kaub Airbnb Minimum Stay Requirements Analysis
Distribution of Listings by Minimum Night Requirement
1 Night
5 listings
26.3% of total
2 Nights
9 listings
47.4% of total
30+ Nights
5 listings
26.3% of total
Key Insights
- The most prevalent minimum stay requirement in Kaub is 2 Nights, adopted by 47.4% of listings. This highlights the market's preference for shorter, flexible bookings.
- A strong majority (73.7%) of the Kaub Airbnb data shows acceptance of very short stays (1-2 nights), indicating a dynamic, high-turnover market.
- A significant segment (26.3%) caters to monthly stays (30+ nights) in Kaub, pointing to opportunities in the extended-stay market.
Recommendations
- Align with the market by considering a 2 Nights minimum stay, as 47.4% of Kaub hosts use this setting.
- If feasible, allowing 1-night stays, especially midweek or during low season, could capture last-minute bookings, as only 26.3% currently do.
- Explore offering discounts for stays of 30+ nights to attract the 26.3% of the market seeking extended stays.
- Adjust minimum nights based on seasonality – potentially shorter during low season and longer during peak demand periods in Kaub.
Kaub Airbnb Cancellation Policy Trends Analysis (2026)
Super Strict 60 Days
3 listings
15.8% of total
Flexible
3 listings
15.8% of total
Moderate
3 listings
15.8% of total
Firm
7 listings
36.8% of total
Strict
3 listings
15.8% of total
Cancellation Policy Insights for Kaub
- The prevailing Airbnb cancellation policy trend in Kaub is Firm, used by 36.8% of listings.
- A majority (52.6%) of hosts in Kaub utilize Firm or Strict policies, indicating a market where hosts prioritize booking security.
Recommendations for Hosts
- Consider adopting a Firm policy to align with the 36.8% market standard in Kaub.
- Regularly review your cancellation policy against competitors and market demand shifts in Kaub.
Kaub STR Booking Lead Time Analysis (2026)
Average Booking Lead Time by Month
Booking Lead Time Insights for Kaub
- The overall average booking lead time for vacation rentals in Kaub is 98 days.
- Guests book furthest in advance for stays during September (average 172 days), likely coinciding with peak travel demand or local events.
- The shortest booking windows occur for stays in January (average 17 days), indicating more last-minute travel plans during this time.
- Seasonally, Summer (97 days avg.) sees the longest lead times, while Winter (56 days avg.) has the shortest, reflecting typical travel planning cycles.
Recommendations for Hosts
- Use the overall average lead time (98 days) as a baseline for your pricing and availability strategy in Kaub.
- For September stays, consider implementing length-of-stay discounts or slightly higher rates for bookings made less than 172 days out to capitalize on advance planning.
- Target marketing efforts for the Summer season well in advance (at least 97 days) to capture early planners.
- Monitor your own booking lead times against these Kaub averages to identify opportunities for dynamic pricing adjustments.
Popular & Essential Airbnb Amenities in Kaub (2026)
Amenity Prevalence
Amenity Insights for Kaub
- Essential amenities in Kaub that guests expect include: Smoke alarm, Wifi. Lacking these (any) could significantly impact bookings.
- Popular amenities like Kitchen, Cooking basics, Heating are common but not universal. Offering these can provide a competitive edge.
Recommendations for Hosts
- Ensure your listing includes all essential amenities for Kaub: Smoke alarm, Wifi.
- Consider adding popular differentiators like Kitchen or Cooking basics to increase appeal.
- Highlight unique or less common amenities you offer (e.g., hot tub, dedicated workspace, EV charger) in your listing description and photos.
- Regularly check competitor amenities in Kaub to stay competitive.
Kaub Airbnb Guest Demographics & Profile Analysis (2026)
Guest Profile Summary for Kaub
- The typical guest profile for Airbnb in Kaub consists of a mix of domestic (60%) and international guests, often arriving from nearby Bremen, typically belonging to the Post-2000s (Gen Z/Alpha) group (50%), primarily speaking English or German.
- Domestic travelers account for 59.6% of guests.
- Key international markets include Germany (59.6%) and United Kingdom (10.5%).
- Top languages spoken are English (36.5%) followed by German (29.7%).
- A significant demographic segment is the Post-2000s (Gen Z/Alpha) group, representing 50% of guests.
Recommendations for Hosts
- Balance marketing efforts between domestic and international channels based on the guest mix.
- Tailor amenities and listing descriptions to appeal to the dominant Post-2000s (Gen Z/Alpha) demographic (e.g., highlight fast WiFi, smart home features, local guides).
- Highlight unique local experiences or amenities relevant to the primary guest profile.
- Consider seasonal promotions aligned with peak travel times for key origin markets.
Nearby Short-Term Rental Market Comparison
How does the Kaub Airbnb market stack up against its neighbors? Compare key performance metrics like average monthly revenue, ADR, and occupancy rates in surrounding areas to understand the broader regional STR landscape.
| Market | Active Properties | Monthly Revenue | Daily Rate | Avg. Occupancy |
|---|---|---|---|---|
| Baarlo | 20 | $5,442 | $332.61 | 51% |
| Kruft | 13 | $3,022 | $258.41 | 37% |
| Waimes | 28 | $2,758 | $386.84 | 31% |
| Unkel | 21 | $2,746 | $212.11 | 38% |
| Büllingen | 27 | $2,744 | $302.32 | 36% |
| Malmedy | 216 | $2,726 | $308.37 | 36% |
| Ondenval | 12 | $2,708 | $221.09 | 41% |
| Raeren | 17 | $2,666 | $186.97 | 47% |
| Bütgenbach | 33 | $2,590 | $309.20 | 36% |
| Antweiler | 10 | $2,567 | $232.59 | 40% |