Wuppertal Airbnb Market Analysis 2026: Short Term Rental Data & Vacation Rental Statistics in North Rhine-Westphalia, Germany
Is Airbnb profitable in Wuppertal in 2026? Explore comprehensive Airbnb analytics for Wuppertal, North Rhine-Westphalia, Germany to uncover income potential. This 2026 STR market report for Wuppertal, based on AirROI data from February 2025 to January 2026, reveals key trends in the market of 374 active listings.
Whether you're considering an Airbnb investment in Wuppertal, optimizing your existing vacation rental, or exploring rental arbitrage opportunities, understanding the Wuppertal Airbnb data is crucial. Leveraging the low regulation environment is key to maximizing your short term rental income potential. Let's dive into the specifics.
Key Wuppertal Airbnb Performance Metrics Overview
Monthly Airbnb Revenue Variations & Income Potential in Wuppertal (2026)
Understanding the monthly revenue variations for Airbnb listings in Wuppertal is key to maximizing your short term rental income potential. Seasonality significantly impacts earnings. Our analysis, based on data from the past 12 months, shows that the peak revenue month for STRs in Wuppertal is typically October, while January often presents the lowest earnings, highlighting opportunities for strategic pricing adjustments during shoulder and low seasons. Explore the typical Airbnb income in Wuppertal across different performance tiers:
- Best-in-class properties (Top 10%) achieve $2,304+ monthly, often utilizing dynamic pricing and superior guest experiences.
- Strong performing properties (Top 25%) earn $1,627 or more, indicating effective management and desirable locations/amenities.
- Typical properties (Median) generate around $1,000 per month, representing the average market performance.
- Entry-level properties (Bottom 25%) see earnings around $497, often with potential for optimization.
Average Monthly Airbnb Earnings Trend in Wuppertal
Wuppertal Airbnb Occupancy Rate Trends (2026)
Maximize your bookings by understanding the Wuppertal STR occupancy trends. Seasonal demand shifts significantly influence how often properties are booked. Typically, Octobersees the highest demand (peak season occupancy), while January experiences the lowest (low season). Effective strategies, like adjusting minimum stays or offering promotions, can boost occupancy during slower periods. Here's how different property tiers perform in Wuppertal:
- Best-in-class properties (Top 10%) achieve 77%+ occupancy, indicating high desirability and potentially optimized availability.
- Strong performing properties (Top 25%) maintain 58% or higher occupancy, suggesting good market fit and guest satisfaction.
- Typical properties (Median) have an occupancy rate around 35%.
- Entry-level properties (Bottom 25%) average 18% occupancy, potentially facing higher vacancy.
Average Monthly Occupancy Rate Trend in Wuppertal
Average Daily Rate (ADR) Airbnb Trends in Wuppertal (2026)
Effective short term rental pricing strategy in Wuppertal involves understanding monthly ADR fluctuations. The Average Daily Rate (ADR) for Airbnb in Wuppertal typically peaks in October and dips lowest during February. Leveraging Airbnb dynamic pricing tools or strategies based on this seasonality can significantly boost revenue. Here's a look at the typical nightly rates achieved:
- Best-in-class properties (Top 10%) command rates of $172+ per night, often due to premium features or locations.
- Strong performing properties (Top 25%) achieve nightly rates of $121 or more.
- Typical properties (Median) charge around $87 per night.
- Entry-level properties (Bottom 25%) earn around $64 per night.
Average Daily Rate (ADR) Trend by Month in Wuppertal
Get Live Wuppertal Market Intelligence 👇

Explore Real-time Analytics
Airbnb Seasonality Analysis & Trends in Wuppertal (2026)
Peak Season (October, August, July)
- Revenue averages $1,468 per month
- Occupancy rates average 43.9%
- Daily rates average $118
Shoulder Season
- Revenue averages $1,217 per month
- Occupancy maintains around 39.6%
- Daily rates hold near $116
Low Season (January, February, May)
- Revenue drops to average $956 per month
- Occupancy decreases to average 34.0%
- Daily rates adjust to average $108
Seasonality Insights for Wuppertal
- The Airbnb seasonality in Wuppertal shows highly seasonal trends requiring careful strategy. While the sections above show seasonal averages, it's also insightful to look at the extremes:
- During the high season, the absolute peak month showcases Wuppertal's highest earning potential, with monthly revenues capable of climbing to $1,748, occupancy reaching a high of 49.7%, and ADRs peaking at $128.
- Conversely, the slowest single month of the year, typically falling within the low season, marks the market's lowest point. In this month, revenue might dip to $805, occupancy could drop to 27.7%, and ADRs may adjust down to $92.
- Understanding both the seasonal averages and these monthly peaks and troughs in revenue, occupancy, and ADR is crucial for maximizing your Airbnb profit potential in Wuppertal.
Seasonal Strategies for Maximizing Profit
- Peak Season: Maximize revenue through premium pricing and potentially longer minimum stays. Ensure high availability.
- Low Season: Offer competitive pricing, special promotions (e.g., extended stay discounts), and flexible cancellation policies. Target off-season travelers like remote workers or budget-conscious guests.
- Shoulder Seasons: Implement dynamic pricing that balances peak and low rates. Target weekend travelers or specific events. Offer slightly more flexible terms than peak season.
- Regularly analyze your own performance against these Wuppertal seasonality benchmarks and adjust your pricing and availability strategy accordingly.
Best Areas for Airbnb Investment in Wuppertal (2026)
Exploring the top neighborhoods for short-term rentals in Wuppertal? This section highlights key areas, outlining why they are attractive for hosts and guests, along with notable local attractions. Consider these locations based on your target guest profile and investment strategy.
| Neighborhood / Area | Why Host Here? (Target Guests & Appeal) | Key Attractions & Landmarks |
|---|---|---|
| Elberfeld | This is the main center of Wuppertal, featuring a lively atmosphere, shopping streets, and restaurants. It's a hub for culture and commerce, making it a prime spot for short-term rentals. | Wuppertal Suspension Railway, Wuppertal City Hall, Kardinal- von-Galen-Platz, Elberfeld shopping district, Cultural institutions like the Wuppertal Opera |
| Barmen | An important district with historical architecture and a variety of local attractions. It offers a mix of residential areas and commercial facilities, appealing to both tourists and business travelers. | Barmen Botanical Garden, Historic Town Hall Barmen, Wuppertal Theater, Museum von Von der Heydt, Wuppertal Main Station |
| Vohwinkel | Known for its scenic parks and residential charm, Vohwinkel is appealing for families and nature lovers. The combination of tranquility and accessibility attracts visitors looking for a peaceful retreat. | Vohwinkel City Park, Local shops and cafés, Nearby hiking trails, Wuppertal Zoo, Schwelm River |
| Cronenberg | A quiet and picturesque area, perfect for guests seeking a serene environment close to nature. This suburb is popular for outdoor activities and has a friendly community vibe. | Cronenberg Village, Surrounding green spaces, Hiking trails in the forests, Local historical sites, Cafés with local delicacies |
| Ronsdorf | This district offers a blend of natural beauty and rich local history. It's well-suited for visitors who want to escape the city while still having convenient access to Wuppertal's attractions. | Ronsdorf Town Square, Local hiking routes, Historic Ronsdorf Beer Brewery, Hiking paths in the surrounding hills, Natural beauty reserves |
| Nordstadt | A vibrant area known for its diverse community and cultural diversity. It's a great choice for guests looking for a local experience and a lively urban atmosphere. | Nordstadt Park, Local markets, Street fairs, Various international restaurants, Art galleries and studios |
| Beyenburg | A quaint historic village known for its picturesque streets and traditional architecture. It's ideal for visitors interested in local culture and a laid-back atmosphere. | Beyenburg Castle, Old town charm, Scenic river views, Local crafts shops, Art events and festivals |
| Kohlfurth | A small, tranquil district surrounded by nature, popular for hiking and outdoor activities. It's ideal for nature lovers looking for a peaceful getaway close to Wuppertal's attractions. | Kohlfurth Waterfall, Hiking paths, Local wildlife parks, Nature reserves, Scenic viewpoints |
Understanding Airbnb License Requirements & STR Laws in Wuppertal (2026)
While Wuppertal, North Rhine-Westphalia, Germany currently shows low STR regulations, specific Airbnb license requirements might still exist or change. Always verify the latest short term rental regulations and Airbnb license requirements directly with local government authorities for Wuppertal to ensure full compliance before hosting.
(Source: AirROI data, 2026, based on 1% licensed listings)
Top Performing Airbnb Properties in Wuppertal (2026)
Benchmark your potential! Explore examples of top-performing Airbnb properties in Wuppertalbased on Trailing Twelve Month (TTM) revenue. Analyze their characteristics, revenue, occupancy rate, and ADR to understand what drives success in this market.
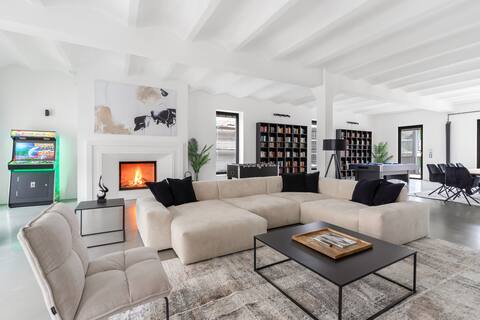
Beyond Living® 300 m² Loft Messe
Entire Place • 3 bedrooms
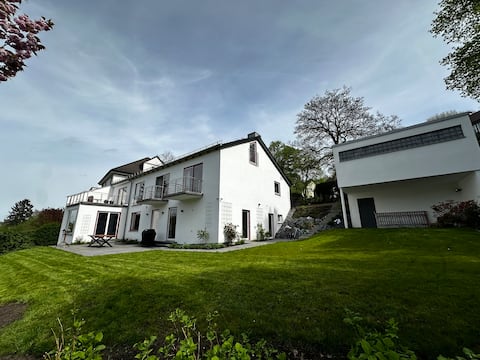
Luxury villa - near Messe Düsseldorf, Cologne, Essen
Entire Place • 5 bedrooms
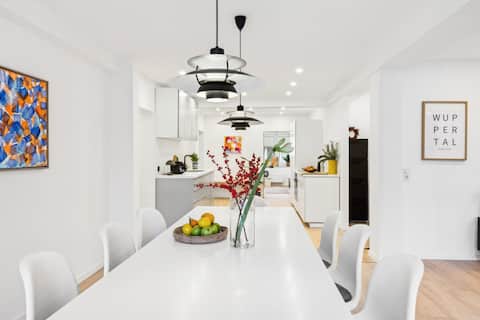
Penthouse apartment on 2 floors
Entire Place • 5 bedrooms
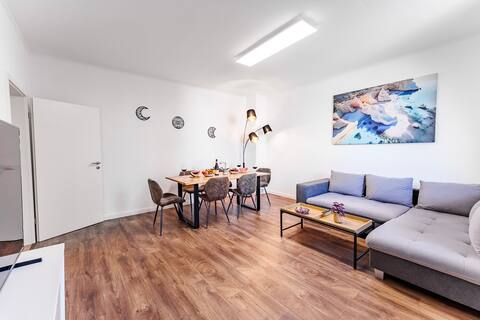
Chic living dream* 9 pers*city/ lift+ parking*
Entire Place • 3 bedrooms

cozy house close to Düsseldorf and Cologne,WiFi
Entire Place • 2 bedrooms
Spacious House with Sauna & Garden, Near Expo
Entire Place • 3 bedrooms
Note: Performance varies based on location, size, amenities, seasonality, and management quality. Data reflects the past 12 months.
Top Performing Airbnb Hosts in Wuppertal (2026)
Learn from the best! This table showcases top-performing Airbnb hosts in Wuppertal based on the number of properties managed and estimated total revenue over the past year. Analyze their scale and performance metrics.
| Host Name | Properties | Grossing Revenue | Stay Reviews | Avg Rating |
|---|---|---|---|---|
| Barbara | 23 | $319,886 | 263 | 4.83/5.0 |
| Engin | 14 | $196,811 | 634 | 4.91/5.0 |
| Manfred Und Markus | 7 | $134,547 | 123 | 4.78/5.0 |
| Harald | 5 | $101,626 | 168 | 4.27/5.0 |
| Viktoria | 1 | $96,983 | 64 | 4.80/5.0 |
| Rifat | 5 | $79,795 | 546 | 4.94/5.0 |
| Jens | 3 | $72,062 | 62 | 5.00/5.0 |
| Gulnara | 6 | $48,737 | 12 | 4.67/5.0 |
| Jelo Stay | 5 | $47,052 | 50 | 4.76/5.0 |
| Denys | 4 | $46,764 | 98 | 4.73/5.0 |
Analyzing the strategies of top hosts, such as their property selection, pricing, and guest communication, can offer valuable lessons for optimizing your own Airbnb operations in Wuppertal.
Dive Deeper: Advanced Wuppertal STR Market Data (2026)
Ready to unlock more insights? AirROI provides access to advanced metrics and comprehensive Airbnb data for Wuppertal. Explore detailed analytics beyond this report to refine your investment strategy, optimize pricing, and maximize your vacation rental profits.
Explore Advanced MetricsWuppertal Short-Term Rental Market Composition (2026): Property & Room Types
Room Type Distribution
Property Type Distribution
Market Composition Insights for Wuppertal
- The Wuppertal Airbnb market composition is heavily skewed towards Entire Home/Apt listings, which make up 89.6% of the 374 active rentals. This indicates strong guest preference for privacy and space.
- Looking at the property type distribution in Wuppertal, Apartment/Condo properties are the most common (89.8%), reflecting the local real estate landscape.
- Smaller segments like hotel/boutique, others, unique stays, outdoor/unique (combined 4.0%) offer potential for unique stay experiences.
Wuppertal Airbnb Room Capacity Analysis (2026): Bedroom Distribution
Distribution of Listings by Number of Bedrooms
Room Capacity Insights for Wuppertal
- The dominant room capacity in Wuppertal is 1 bedroom listings, making up 56.7% of the market. This suggests a strong demand for properties suitable for couples or solo travelers.
- Together, 1 bedroom and 2 bedrooms properties represent 78.6% of the active Airbnb listings in Wuppertal, indicating a high concentration in these sizes.
- With over half the market (56.7%) consisting of studios or 1-bedroom units, Wuppertal is particularly well-suited for individuals or couples.
- Listings with 3+ bedrooms (8.3%) represent a smaller niche, potentially indicating an underserved market for larger group accommodations in Wuppertal.
Wuppertal Vacation Rental Guest Capacity Trends (2026)
Distribution of Listings by Guest Capacity
Guest Capacity Insights for Wuppertal
- The most common guest capacity trend in Wuppertal vacation rentals is listings accommodating 2 guests (31.8%). This suggests the primary traveler segment is likely couples or solo travelers.
- Properties designed for 2 guests and 4 guests dominate the Wuppertal STR market, accounting for 57.2% of listings.
- 13.3% of properties accommodate 6+ guests, serving the market segment for larger families or group travel in Wuppertal.
- On average, properties in Wuppertal are equipped to host 3.3 guests.
Wuppertal Airbnb Booking Patterns (2026): Available vs. Booked Days
Available Days Distribution
Booked Days Distribution
Booking Pattern Insights for Wuppertal
- The most common availability pattern in Wuppertal falls within the 271-366 days range, representing 51.6% of listings. This suggests many properties have significant open periods on their calendars.
- Approximately 85.8% of listings show high availability (181+ days open annually), indicating potential for increased bookings or specific owner usage patterns.
- For booked days, the 91-180 days range is most frequent in Wuppertal (34.2%), reflecting common guest stay durations or potential owner blocking patterns.
- A notable 15.5% of properties secure long booking periods (181+ days booked per year), highlighting successful long-term rental strategies or significant owner usage.
Wuppertal Airbnb Minimum Stay Requirements Analysis
Distribution of Listings by Minimum Night Requirement
1 Night
91 listings
24.3% of total
2 Nights
76 listings
20.3% of total
3 Nights
30 listings
8% of total
4-6 Nights
30 listings
8% of total
7-29 Nights
22 listings
5.9% of total
30+ Nights
125 listings
33.4% of total
Key Insights
- The most prevalent minimum stay requirement in Wuppertal is 30+ Nights, adopted by 33.4% of listings. This highlights the market's preference for longer commitments.
- A significant segment (33.4%) caters to monthly stays (30+ nights) in Wuppertal, pointing to opportunities in the extended-stay market.
Recommendations
- Align with the market by considering a 30+ Nights minimum stay, as 33.4% of Wuppertal hosts use this setting.
- If feasible, allowing 1-night stays, especially midweek or during low season, could capture last-minute bookings, as only 24.3% currently do.
- Explore offering discounts for stays of 30+ nights to attract the 33.4% of the market seeking extended stays.
- Adjust minimum nights based on seasonality – potentially shorter during low season and longer during peak demand periods in Wuppertal.
Wuppertal Airbnb Cancellation Policy Trends Analysis (2026)
Super Strict 60 Days
11 listings
3% of total
Super Strict 30 Days
1 listings
0.3% of total
Limited
2 listings
0.5% of total
Non-refundable
1 listings
0.3% of total
Flexible
132 listings
35.6% of total
Moderate
110 listings
29.6% of total
Firm
84 listings
22.6% of total
Strict
30 listings
8.1% of total
Cancellation Policy Insights for Wuppertal
- The prevailing Airbnb cancellation policy trend in Wuppertal is Flexible, used by 35.6% of listings.
- There's a relatively balanced mix between guest-friendly (65.2%) and stricter (30.7%) policies, offering choices for different guest needs.
- Strict cancellation policies are quite rare (8.1%), potentially making listings with this policy less competitive unless justified by high demand or property type.
Recommendations for Hosts
- Consider adopting a Flexible policy to align with the 35.6% market standard in Wuppertal.
- Using a Strict policy might deter some guests, as only 8.1% of listings use it. Evaluate if potential revenue protection outweighs possible lower booking rates.
- Regularly review your cancellation policy against competitors and market demand shifts in Wuppertal.
Wuppertal STR Booking Lead Time Analysis (2026)
Average Booking Lead Time by Month
Booking Lead Time Insights for Wuppertal
- The overall average booking lead time for vacation rentals in Wuppertal is 32 days.
- Guests book furthest in advance for stays during October (average 45 days), likely coinciding with peak travel demand or local events.
- The shortest booking windows occur for stays in February (average 22 days), indicating more last-minute travel plans during this time.
- Seasonally, Summer (38 days avg.) sees the longest lead times, while Winter (26 days avg.) has the shortest, reflecting typical travel planning cycles.
Recommendations for Hosts
- Use the overall average lead time (32 days) as a baseline for your pricing and availability strategy in Wuppertal.
- For October stays, consider implementing length-of-stay discounts or slightly higher rates for bookings made less than 45 days out to capitalize on advance planning.
- Target marketing efforts for the Summer season well in advance (at least 38 days) to capture early planners.
- Monitor your own booking lead times against these Wuppertal averages to identify opportunities for dynamic pricing adjustments.
Popular & Essential Airbnb Amenities in Wuppertal (2026)
Amenity Prevalence
Amenity Insights for Wuppertal
- Essential amenities in Wuppertal that guests expect include: Wifi, Smoke alarm. Lacking these (any) could significantly impact bookings.
- Popular amenities like Kitchen, TV, Heating are common but not universal. Offering these can provide a competitive edge.
Recommendations for Hosts
- Ensure your listing includes all essential amenities for Wuppertal: Wifi, Smoke alarm.
- Prioritize adding missing essentials: Wifi, Smoke alarm.
- Consider adding popular differentiators like Kitchen or TV to increase appeal.
- Highlight unique or less common amenities you offer (e.g., hot tub, dedicated workspace, EV charger) in your listing description and photos.
- Regularly check competitor amenities in Wuppertal to stay competitive.
Wuppertal Airbnb Guest Demographics & Profile Analysis (2026)
Guest Profile Summary for Wuppertal
- The typical guest profile for Airbnb in Wuppertal consists of a mix of domestic (57%) and international guests, often arriving from nearby Berlin, typically belonging to the Post-2000s (Gen Z/Alpha) group (50%), primarily speaking English or German.
- Domestic travelers account for 57.3% of guests.
- Key international markets include Germany (57.3%) and Netherlands (8%).
- Top languages spoken are English (36.5%) followed by German (27.1%).
- A significant demographic segment is the Post-2000s (Gen Z/Alpha) group, representing 50% of guests.
Recommendations for Hosts
- Balance marketing efforts between domestic and international channels based on the guest mix.
- Tailor amenities and listing descriptions to appeal to the dominant Post-2000s (Gen Z/Alpha) demographic (e.g., highlight fast WiFi, smart home features, local guides).
- Highlight unique local experiences or amenities relevant to the primary guest profile.
- Consider seasonal promotions aligned with peak travel times for key origin markets.
Nearby Short-Term Rental Market Comparison
How does the Wuppertal Airbnb market stack up against its neighbors? Compare key performance metrics like average monthly revenue, ADR, and occupancy rates in surrounding areas to understand the broader regional STR landscape.
| Market | Active Properties | Monthly Revenue | Daily Rate | Avg. Occupancy |
|---|---|---|---|---|
| Losser | 10 | $7,954 | $1060.34 | 27% |
| Baarlo | 20 | $5,442 | $332.61 | 51% |
| Ruinen | 13 | $3,044 | $227.08 | 48% |
| Terwolde | 11 | $3,030 | $208.36 | 59% |
| Kruft | 13 | $3,022 | $258.41 | 37% |
| Neede | 10 | $2,882 | $410.06 | 30% |
| Lievelde | 23 | $2,862 | $271.13 | 40% |
| Waimes | 28 | $2,758 | $386.84 | 31% |
| Unkel | 21 | $2,746 | $212.11 | 38% |
| Büllingen | 27 | $2,744 | $302.32 | 36% |