Oberhausen Airbnb Market Analysis 2026: Short Term Rental Data & Vacation Rental Statistics in North Rhine-Westphalia, Germany
Is Airbnb profitable in Oberhausen in 2026? Explore comprehensive Airbnb analytics for Oberhausen, North Rhine-Westphalia, Germany to uncover income potential. This 2026 STR market report for Oberhausen, based on AirROI data from February 2025 to January 2026, reveals key trends in the niche market of 190 active listings.
Whether you're considering an Airbnb investment in Oberhausen, optimizing your existing vacation rental, or exploring rental arbitrage opportunities, understanding the Oberhausen Airbnb data is crucial. Leveraging the low regulation environment is key to maximizing your short term rental income potential. Let's dive into the specifics.
Key Oberhausen Airbnb Performance Metrics Overview
Monthly Airbnb Revenue Variations & Income Potential in Oberhausen (2026)
Understanding the monthly revenue variations for Airbnb listings in Oberhausen is key to maximizing your short term rental income potential. Seasonality significantly impacts earnings. Our analysis, based on data from the past 12 months, shows that the peak revenue month for STRs in Oberhausen is typically October, while January often presents the lowest earnings, highlighting opportunities for strategic pricing adjustments during shoulder and low seasons. Explore the typical Airbnb income in Oberhausen across different performance tiers:
- Best-in-class properties (Top 10%) achieve $2,205+ monthly, often utilizing dynamic pricing and superior guest experiences.
- Strong performing properties (Top 25%) earn $1,471 or more, indicating effective management and desirable locations/amenities.
- Typical properties (Median) generate around $881 per month, representing the average market performance.
- Entry-level properties (Bottom 25%) see earnings around $451, often with potential for optimization.
Average Monthly Airbnb Earnings Trend in Oberhausen
Oberhausen Airbnb Occupancy Rate Trends (2026)
Maximize your bookings by understanding the Oberhausen STR occupancy trends. Seasonal demand shifts significantly influence how often properties are booked. Typically, Octobersees the highest demand (peak season occupancy), while January experiences the lowest (low season). Effective strategies, like adjusting minimum stays or offering promotions, can boost occupancy during slower periods. Here's how different property tiers perform in Oberhausen:
- Best-in-class properties (Top 10%) achieve 75%+ occupancy, indicating high desirability and potentially optimized availability.
- Strong performing properties (Top 25%) maintain 54% or higher occupancy, suggesting good market fit and guest satisfaction.
- Typical properties (Median) have an occupancy rate around 31%.
- Entry-level properties (Bottom 25%) average 15% occupancy, potentially facing higher vacancy.
Average Monthly Occupancy Rate Trend in Oberhausen
Average Daily Rate (ADR) Airbnb Trends in Oberhausen (2026)
Effective short term rental pricing strategy in Oberhausen involves understanding monthly ADR fluctuations. The Average Daily Rate (ADR) for Airbnb in Oberhausen typically peaks in September and dips lowest during February. Leveraging Airbnb dynamic pricing tools or strategies based on this seasonality can significantly boost revenue. Here's a look at the typical nightly rates achieved:
- Best-in-class properties (Top 10%) command rates of $168+ per night, often due to premium features or locations.
- Strong performing properties (Top 25%) achieve nightly rates of $125 or more.
- Typical properties (Median) charge around $89 per night.
- Entry-level properties (Bottom 25%) earn around $64 per night.
Average Daily Rate (ADR) Trend by Month in Oberhausen
Get Live Oberhausen Market Intelligence 👇

Explore Real-time Analytics
Airbnb Seasonality Analysis & Trends in Oberhausen (2026)
Peak Season (October, November, September)
- Revenue averages $1,566 per month
- Occupancy rates average 39.1%
- Daily rates average $134
Shoulder Season
- Revenue averages $1,158 per month
- Occupancy maintains around 37.1%
- Daily rates hold near $122
Low Season (January, February, March)
- Revenue drops to average $899 per month
- Occupancy decreases to average 32.2%
- Daily rates adjust to average $116
Seasonality Insights for Oberhausen
- The Airbnb seasonality in Oberhausen shows highly seasonal trends requiring careful strategy. While the sections above show seasonal averages, it's also insightful to look at the extremes:
- During the high season, the absolute peak month showcases Oberhausen's highest earning potential, with monthly revenues capable of climbing to $1,986, occupancy reaching a high of 43.6%, and ADRs peaking at $141.
- Conversely, the slowest single month of the year, typically falling within the low season, marks the market's lowest point. In this month, revenue might dip to $822, occupancy could drop to 27.4%, and ADRs may adjust down to $103.
- Understanding both the seasonal averages and these monthly peaks and troughs in revenue, occupancy, and ADR is crucial for maximizing your Airbnb profit potential in Oberhausen.
Seasonal Strategies for Maximizing Profit
- Peak Season: Maximize revenue through premium pricing and potentially longer minimum stays. Ensure high availability.
- Low Season: Offer competitive pricing, special promotions (e.g., extended stay discounts), and flexible cancellation policies. Target off-season travelers like remote workers or budget-conscious guests.
- Shoulder Seasons: Implement dynamic pricing that balances peak and low rates. Target weekend travelers or specific events. Offer slightly more flexible terms than peak season.
- Regularly analyze your own performance against these Oberhausen seasonality benchmarks and adjust your pricing and availability strategy accordingly.
Best Areas for Airbnb Investment in Oberhausen (2026)
Exploring the top neighborhoods for short-term rentals in Oberhausen? This section highlights key areas, outlining why they are attractive for hosts and guests, along with notable local attractions. Consider these locations based on your target guest profile and investment strategy.
| Neighborhood / Area | Why Host Here? (Target Guests & Appeal) | Key Attractions & Landmarks |
|---|---|---|
| Centro Oberhausen | The heart of Oberhausen, known for shopping, dining, and entertainment. It attracts both local visitors and tourists due to its vibrant atmosphere and accessibility. | CentrO Shopping Mall, Oberhausen Gasometer, Theater Oberhausen, Aquapark Oberhausen, Oberhausen Botanical Garden |
| Oberhausen Alstaden | A quiet residential area with a mix of nature and urban vibe. Well-suited for families and visitors looking for a more relaxed stay with easy access to parks and trails. | Landschaftspark Duisburg-Nord, Oberhausen Forest, Local parks and recreation areas, Historic buildings |
| Oberhausen Sterkrade | A lively area with a rich history and cultural sites. Well-known for its local shops, restaurants, and a close-knit community feel, appealing to cultural tourists. | St. Antony's Church, Sterkrade Church, Local museums, Parks and local festivals |
| Oberhausen Neue Mitte | Transformed into a modern urban hub, it offers contemporary attractions and a central location which is ideal for both business and leisure travelers. | New Theatre Oberhausen, CentrO event center, Shopping and dining options, Cultural events and festivals |
| Oberhausen Kaisergarten | A beautiful green area with a large park and leisure facilities, conducive for visitors seeking outdoor activities and family-friendly accommodations. | Kaisergarten Park, Animal and Nature Park, Playgrounds, Cafes and picnic areas |
| Oberhausen Buschhausen | A peaceful residential area near the scenic Landschaftspark, offering tranquility and nature-oriented activities for guests looking for a retreat. | Landschaftspark Duisburg-Nord, Walking trails, Nature reserves |
| Oberhausen Holten | A historical area with charm and character, perfect for visitors wanting to explore Oberhausen's heritage and experience local living. | Historic sites, Local breweries, Nature trails, Sustainable restaurants |
| Oberhausen Osterfeld | Known for its community spirit and local eating spots, this area appeals to travelers who want an authentic experience away from the bustling tourist traps. | Local markets, Community events, Authentic dining experiences, Nearby parks |
Understanding Airbnb License Requirements & STR Laws in Oberhausen (2026)
While Oberhausen, North Rhine-Westphalia, Germany currently shows low STR regulations, specific Airbnb license requirements might still exist or change. Always verify the latest short term rental regulations and Airbnb license requirements directly with local government authorities for Oberhausen to ensure full compliance before hosting.
(Source: AirROI data, 2026, based on 1% licensed listings)
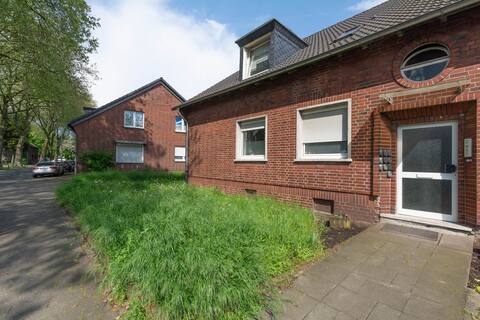
Top Performing Airbnb Properties in Oberhausen (2026)
Benchmark your potential! Explore examples of top-performing Airbnb properties in Oberhausenbased on Trailing Twelve Month (TTM) revenue. Analyze their characteristics, revenue, occupancy rate, and ADR to understand what drives success in this market.
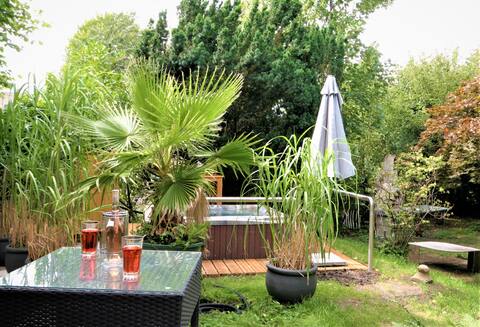
JGA Villa Hot Tub Sauna Lounge Bar OB Ruhr area
Entire Place • 3 bedrooms
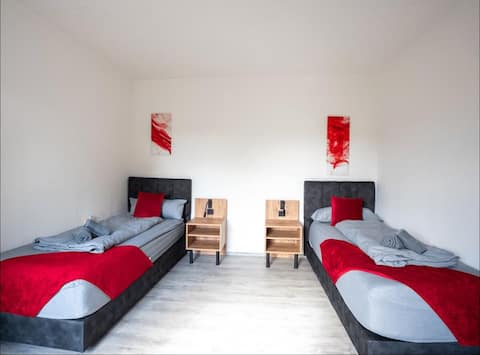
T&K Apartments-Oberhausen-2 Rooms-1OG Mitte
Entire Place • 2 bedrooms
Serviceroom24 - Space in Oberhausen SmartTv|WLAN
Entire Place • 12 bedrooms

In the heart ❤️ of the Ruhr area - Parking Free - Netflix
Entire Place • 3 bedrooms
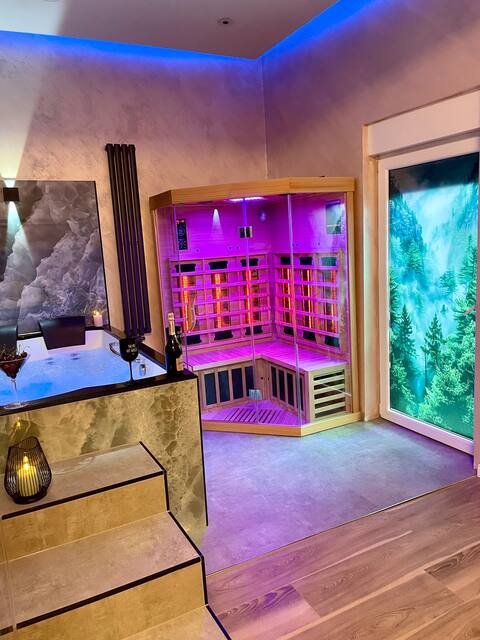
Aura Spa Oberhausen
Entire Place • 1 bedroom

JGA bachelor party hot tub house shaft 85
Entire Place • 3 bedrooms
Note: Performance varies based on location, size, amenities, seasonality, and management quality. Data reflects the past 12 months.
Top Performing Airbnb Hosts in Oberhausen (2026)
Learn from the best! This table showcases top-performing Airbnb hosts in Oberhausen based on the number of properties managed and estimated total revenue over the past year. Analyze their scale and performance metrics.
| Host Name | Properties | Grossing Revenue | Stay Reviews | Avg Rating |
|---|---|---|---|---|
| Schacht34 | 3 | $169,852 | 249 | 4.80/5.0 |
| Ivan | 6 | $120,477 | 31 | 4.47/5.0 |
| Julia | 7 | $120,343 | 93 | 4.76/5.0 |
| Sonja | 4 | $86,177 | 332 | 4.76/5.0 |
| Selcuk | 4 | $75,526 | 12 | 3.25/5.0 |
| Limehome | 4 | $58,941 | 291 | 4.62/5.0 |
| Jenny & Olli | 2 | $57,568 | 170 | 4.88/5.0 |
| Ken | 6 | $55,093 | 230 | 4.62/5.0 |
| Tino | 4 | $46,996 | 125 | 4.75/5.0 |
| Oliver Grote | 3 | $45,233 | 12 | 5.00/5.0 |
Analyzing the strategies of top hosts, such as their property selection, pricing, and guest communication, can offer valuable lessons for optimizing your own Airbnb operations in Oberhausen.
Dive Deeper: Advanced Oberhausen STR Market Data (2026)
Ready to unlock more insights? AirROI provides access to advanced metrics and comprehensive Airbnb data for Oberhausen. Explore detailed analytics beyond this report to refine your investment strategy, optimize pricing, and maximize your vacation rental profits.
Explore Advanced MetricsOberhausen Short-Term Rental Market Composition (2026): Property & Room Types
Room Type Distribution
Property Type Distribution
Market Composition Insights for Oberhausen
- The Oberhausen Airbnb market composition is heavily skewed towards Entire Home/Apt listings, which make up 89.5% of the 190 active rentals. This indicates strong guest preference for privacy and space.
- Looking at the property type distribution in Oberhausen, Apartment/Condo properties are the most common (88.4%), reflecting the local real estate landscape.
- Smaller segments like others, hotel/boutique (combined 3.2%) offer potential for unique stay experiences.
Oberhausen Airbnb Room Capacity Analysis (2026): Bedroom Distribution
Distribution of Listings by Number of Bedrooms
Room Capacity Insights for Oberhausen
- The dominant room capacity in Oberhausen is 1 bedroom listings, making up 41.1% of the market. This suggests a strong demand for properties suitable for couples or solo travelers.
- Together, 1 bedroom and 2 bedrooms properties represent 73.2% of the active Airbnb listings in Oberhausen, indicating a high concentration in these sizes.
Oberhausen Vacation Rental Guest Capacity Trends (2026)
Distribution of Listings by Guest Capacity
Guest Capacity Insights for Oberhausen
- The most common guest capacity trend in Oberhausen vacation rentals is listings accommodating 4 guests (28.4%). This suggests the primary traveler segment is likely small families or groups.
- Properties designed for 4 guests and 2 guests dominate the Oberhausen STR market, accounting for 49.5% of listings.
- 19.0% of properties accommodate 6+ guests, serving the market segment for larger families or group travel in Oberhausen.
- On average, properties in Oberhausen are equipped to host 3.7 guests.
Oberhausen Airbnb Booking Patterns (2026): Available vs. Booked Days
Available Days Distribution
Booked Days Distribution
Booking Pattern Insights for Oberhausen
- The most common availability pattern in Oberhausen falls within the 271-366 days range, representing 54.7% of listings. This suggests many properties have significant open periods on their calendars.
- Approximately 84.2% of listings show high availability (181+ days open annually), indicating potential for increased bookings or specific owner usage patterns.
- For booked days, the 31-90 days range is most frequent in Oberhausen (31.1%), reflecting common guest stay durations or potential owner blocking patterns.
- A notable 17.4% of properties secure long booking periods (181+ days booked per year), highlighting successful long-term rental strategies or significant owner usage.
Oberhausen Airbnb Minimum Stay Requirements Analysis
Distribution of Listings by Minimum Night Requirement
1 Night
61 listings
32.1% of total
2 Nights
44 listings
23.2% of total
3 Nights
12 listings
6.3% of total
4-6 Nights
15 listings
7.9% of total
7-29 Nights
8 listings
4.2% of total
30+ Nights
50 listings
26.3% of total
Key Insights
- The most prevalent minimum stay requirement in Oberhausen is 1 Night, adopted by 32.1% of listings. This highlights the market's preference for shorter, flexible bookings.
- A significant segment (26.3%) caters to monthly stays (30+ nights) in Oberhausen, pointing to opportunities in the extended-stay market.
Recommendations
- Align with the market by considering a 1 Night minimum stay, as 32.1% of Oberhausen hosts use this setting.
- Explore offering discounts for stays of 30+ nights to attract the 26.3% of the market seeking extended stays.
- Adjust minimum nights based on seasonality – potentially shorter during low season and longer during peak demand periods in Oberhausen.
Oberhausen Airbnb Cancellation Policy Trends Analysis (2026)
Limited
1 listings
0.5% of total
Super Strict 60 Days
7 listings
3.7% of total
Flexible
65 listings
34.2% of total
Moderate
54 listings
28.4% of total
Firm
44 listings
23.2% of total
Strict
19 listings
10% of total
Cancellation Policy Insights for Oberhausen
- The prevailing Airbnb cancellation policy trend in Oberhausen is Flexible, used by 34.2% of listings.
- There's a relatively balanced mix between guest-friendly (62.6%) and stricter (33.2%) policies, offering choices for different guest needs.
Recommendations for Hosts
- Consider adopting a Flexible policy to align with the 34.2% market standard in Oberhausen.
- Using a Strict policy might deter some guests, as only 10% of listings use it. Evaluate if potential revenue protection outweighs possible lower booking rates.
- Regularly review your cancellation policy against competitors and market demand shifts in Oberhausen.
Oberhausen STR Booking Lead Time Analysis (2026)
Average Booking Lead Time by Month
Booking Lead Time Insights for Oberhausen
- The overall average booking lead time for vacation rentals in Oberhausen is 50 days.
- Guests book furthest in advance for stays during October (average 87 days), likely coinciding with peak travel demand or local events.
- The shortest booking windows occur for stays in February (average 31 days), indicating more last-minute travel plans during this time.
- Seasonally, Fall (64 days avg.) sees the longest lead times, while Winter (41 days avg.) has the shortest, reflecting typical travel planning cycles.
Recommendations for Hosts
- Use the overall average lead time (50 days) as a baseline for your pricing and availability strategy in Oberhausen.
- For October stays, consider implementing length-of-stay discounts or slightly higher rates for bookings made less than 87 days out to capitalize on advance planning.
- Target marketing efforts for the Fall season well in advance (at least 64 days) to capture early planners.
- Monitor your own booking lead times against these Oberhausen averages to identify opportunities for dynamic pricing adjustments.
Popular & Essential Airbnb Amenities in Oberhausen (2026)
Amenity Prevalence
Amenity Insights for Oberhausen
- Essential amenities in Oberhausen that guests expect include: Wifi, TV. Lacking these (any) could significantly impact bookings.
- Popular amenities like Kitchen, Smoke alarm, Heating are common but not universal. Offering these can provide a competitive edge.
Recommendations for Hosts
- Ensure your listing includes all essential amenities for Oberhausen: Wifi, TV.
- Prioritize adding missing essentials: Wifi, TV.
- Consider adding popular differentiators like Kitchen or Smoke alarm to increase appeal.
- Highlight unique or less common amenities you offer (e.g., hot tub, dedicated workspace, EV charger) in your listing description and photos.
- Regularly check competitor amenities in Oberhausen to stay competitive.
Oberhausen Airbnb Guest Demographics & Profile Analysis (2026)
Guest Profile Summary for Oberhausen
- The typical guest profile for Airbnb in Oberhausen consists of a mix of domestic (63%) and international guests, often arriving from nearby Berlin, typically belonging to the Post-2000s (Gen Z/Alpha) group (50%), primarily speaking English or German.
- Domestic travelers account for 62.5% of guests.
- Key international markets include Germany (62.5%) and Netherlands (10.1%).
- Top languages spoken are English (39%) followed by German (30.4%).
- A significant demographic segment is the Post-2000s (Gen Z/Alpha) group, representing 50% of guests.
Recommendations for Hosts
- Target domestic marketing efforts towards travelers from Berlin and Hamburg.
- Tailor amenities and listing descriptions to appeal to the dominant Post-2000s (Gen Z/Alpha) demographic (e.g., highlight fast WiFi, smart home features, local guides).
- Highlight unique local experiences or amenities relevant to the primary guest profile.
- Consider seasonal promotions aligned with peak travel times for key origin markets.
Nearby Short-Term Rental Market Comparison
How does the Oberhausen Airbnb market stack up against its neighbors? Compare key performance metrics like average monthly revenue, ADR, and occupancy rates in surrounding areas to understand the broader regional STR landscape.
| Market | Active Properties | Monthly Revenue | Daily Rate | Avg. Occupancy |
|---|---|---|---|---|
| Losser | 10 | $7,954 | $1060.34 | 27% |
| Haghorst | 11 | $5,995 | $480.40 | 40% |
| Baarlo | 20 | $5,442 | $332.61 | 51% |
| Wellin | 12 | $4,365 | $446.64 | 42% |
| Aubel | 26 | $4,191 | $283.88 | 46% |
| Bertogne | 26 | $3,839 | $325.90 | 42% |
| Kortenhoef | 14 | $3,655 | $255.24 | 55% |
| Samrée | 18 | $3,497 | $375.75 | 31% |
| Zeewolde | 157 | $3,494 | $351.76 | 37% |
| Heers | 30 | $3,405 | $294.43 | 39% |