Lennestadt Airbnb Market Analysis 2026: Short Term Rental Data & Vacation Rental Statistics in North Rhine-Westphalia, Germany
Is Airbnb profitable in Lennestadt in 2026? Explore comprehensive Airbnb analytics for Lennestadt, North Rhine-Westphalia, Germany to uncover income potential. This 2026 STR market report for Lennestadt, based on AirROI data from February 2025 to January 2026, reveals key trends in the niche market of 31 active listings.
Whether you're considering an Airbnb investment in Lennestadt, optimizing your existing vacation rental, or exploring rental arbitrage opportunities, understanding the Lennestadt Airbnb data is crucial. Leveraging the low regulation environment is key to maximizing your short term rental income potential. Let's dive into the specifics.
Key Lennestadt Airbnb Performance Metrics Overview
Monthly Airbnb Revenue Variations & Income Potential in Lennestadt (2026)
Understanding the monthly revenue variations for Airbnb listings in Lennestadt is key to maximizing your short term rental income potential. Seasonality significantly impacts earnings. Our analysis, based on data from the past 12 months, shows that the peak revenue month for STRs in Lennestadt is typically August, while February often presents the lowest earnings, highlighting opportunities for strategic pricing adjustments during shoulder and low seasons. Explore the typical Airbnb income in Lennestadt across different performance tiers:
- Best-in-class properties (Top 10%) achieve $2,452+ monthly, often utilizing dynamic pricing and superior guest experiences.
- Strong performing properties (Top 25%) earn $1,416 or more, indicating effective management and desirable locations/amenities.
- Typical properties (Median) generate around $795 per month, representing the average market performance.
- Entry-level properties (Bottom 25%) see earnings around $412, often with potential for optimization.
Average Monthly Airbnb Earnings Trend in Lennestadt
Lennestadt Airbnb Occupancy Rate Trends (2026)
Maximize your bookings by understanding the Lennestadt STR occupancy trends. Seasonal demand shifts significantly influence how often properties are booked. Typically, Augustsees the highest demand (peak season occupancy), while January experiences the lowest (low season). Effective strategies, like adjusting minimum stays or offering promotions, can boost occupancy during slower periods. Here's how different property tiers perform in Lennestadt:
- Best-in-class properties (Top 10%) achieve 61%+ occupancy, indicating high desirability and potentially optimized availability.
- Strong performing properties (Top 25%) maintain 40% or higher occupancy, suggesting good market fit and guest satisfaction.
- Typical properties (Median) have an occupancy rate around 24%.
- Entry-level properties (Bottom 25%) average 12% occupancy, potentially facing higher vacancy.
Average Monthly Occupancy Rate Trend in Lennestadt
Average Daily Rate (ADR) Airbnb Trends in Lennestadt (2026)
Effective short term rental pricing strategy in Lennestadt involves understanding monthly ADR fluctuations. The Average Daily Rate (ADR) for Airbnb in Lennestadt typically peaks in December and dips lowest during April. Leveraging Airbnb dynamic pricing tools or strategies based on this seasonality can significantly boost revenue. Here's a look at the typical nightly rates achieved:
- Best-in-class properties (Top 10%) command rates of $274+ per night, often due to premium features or locations.
- Strong performing properties (Top 25%) achieve nightly rates of $141 or more.
- Typical properties (Median) charge around $105 per night.
- Entry-level properties (Bottom 25%) earn around $85 per night.
Average Daily Rate (ADR) Trend by Month in Lennestadt
Get Live Lennestadt Market Intelligence 👇

Explore Real-time Analytics
Airbnb Seasonality Analysis & Trends in Lennestadt (2026)
Peak Season (August, December, October)
- Revenue averages $1,419 per month
- Occupancy rates average 33.3%
- Daily rates average $147
Shoulder Season
- Revenue averages $1,089 per month
- Occupancy maintains around 29.6%
- Daily rates hold near $138
Low Season (February, September, November)
- Revenue drops to average $734 per month
- Occupancy decreases to average 22.5%
- Daily rates adjust to average $139
Seasonality Insights for Lennestadt
- The Airbnb seasonality in Lennestadt shows highly seasonal trends requiring careful strategy. While the sections above show seasonal averages, it's also insightful to look at the extremes:
- During the high season, the absolute peak month showcases Lennestadt's highest earning potential, with monthly revenues capable of climbing to $1,587, occupancy reaching a high of 43.4%, and ADRs peaking at $152.
- Conversely, the slowest single month of the year, typically falling within the low season, marks the market's lowest point. In this month, revenue might dip to $528, occupancy could drop to 18.1%, and ADRs may adjust down to $131.
- Understanding both the seasonal averages and these monthly peaks and troughs in revenue, occupancy, and ADR is crucial for maximizing your Airbnb profit potential in Lennestadt.
Seasonal Strategies for Maximizing Profit
- Peak Season: Maximize revenue through premium pricing and potentially longer minimum stays. Ensure high availability.
- Low Season: Offer competitive pricing, special promotions (e.g., extended stay discounts), and flexible cancellation policies. Target off-season travelers like remote workers or budget-conscious guests.
- Shoulder Seasons: Implement dynamic pricing that balances peak and low rates. Target weekend travelers or specific events. Offer slightly more flexible terms than peak season.
- Regularly analyze your own performance against these Lennestadt seasonality benchmarks and adjust your pricing and availability strategy accordingly.
Best Areas for Airbnb Investment in Lennestadt (2026)
Exploring the top neighborhoods for short-term rentals in Lennestadt? This section highlights key areas, outlining why they are attractive for hosts and guests, along with notable local attractions. Consider these locations based on your target guest profile and investment strategy.
| Neighborhood / Area | Why Host Here? (Target Guests & Appeal) | Key Attractions & Landmarks |
|---|---|---|
| Hochsauerland | Popular region for outdoor sports enthusiasts, ideal for year-round adventures such as hiking, skiing, and cycling. Attracts tourists seeking nature and tranquility. | Winterberg Ski Resort, Kahler Asten mountain, Sauerland-Therme, Bike Park Winterberg, Nature parks |
| Lennestadt City Center | The heart of Lennestadt, offering easy access to local shops, restaurants, and culture. Ideal for guests looking for urban amenities combined with a small-town feel. | St. Alexander Church, Local markets, Cafes and restaurants, Cultural events, Historical sites |
| Bigge Lake District | A scenic area known for water sports and relaxation. Perfect for families and travelers looking to enjoy the outdoors with breathtaking views. | Bigge Lake, Water sports activities, Walking and cycling paths, Picnic spots, Nature reserves |
| Elspe | Famous for its open-air theater, this area attracts visitors for performances and cultural events. A unique spot for those interested in the performing arts. | Elspe Festival, Open-air theater, Cultural events, Nature trails, Local dining options |
| Oberellen | A residential area that offers a quiet escape while being close to transport links. Suitable for those wanting a peaceful stay yet close to essential services. | Nearby hiking trails, Local parks, Community events, Access to main roads, Small local shops |
| Finnentrop | Adjacent to Lennestadt with great access to nature and outdoor activities. Attracts a diverse range of tourists, including adventure seekers and families. | Oberbecke Valley, Hiking routes, Cycling paths, Community events, Nature parks |
| Laer | A charming village atmosphere known for its picturesque landscapes and rural tourism. Offers a serene getaway for those seeking peace and quiet. | Laer Castle ruins, Walking trails, Scenic countryside, Local festivals, Traditional restaurants |
| Altenhundem | Known for its beautiful landscape, this area attracts visitors looking to explore the natural beauty of the Sauerland region. | Altenhundem village, Hiking opportunities, Local eateries, Cultural sites, Vadenscheid nature walks |
Understanding Airbnb License Requirements & STR Laws in Lennestadt (2026)
While Lennestadt, North Rhine-Westphalia, Germany currently shows low STR regulations, specific Airbnb license requirements might still exist or change. Always verify the latest short term rental regulations and Airbnb license requirements directly with local government authorities for Lennestadt to ensure full compliance before hosting.
(Source: AirROI data, 2026, finding no licensed listings among those analyzed)
Top Performing Airbnb Properties in Lennestadt (2026)
Benchmark your potential! Explore examples of top-performing Airbnb properties in Lennestadtbased on Trailing Twelve Month (TTM) revenue. Analyze their characteristics, revenue, occupancy rate, and ADR to understand what drives success in this market.

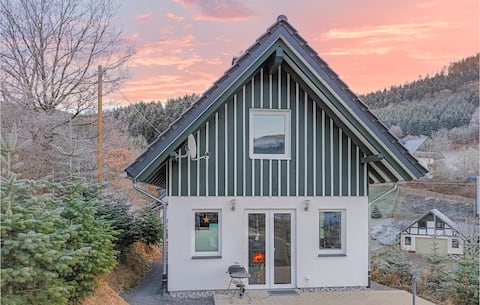
Falkenegg vacation home for up to 12 people
Entire Place • 4 bedrooms
Haus Panoramablick
Entire Place • 3 bedrooms

VACATION RENTAL RAUSZEIT Lennestadt Meggen Sauerland >8 people
Entire Place • 4 bedrooms

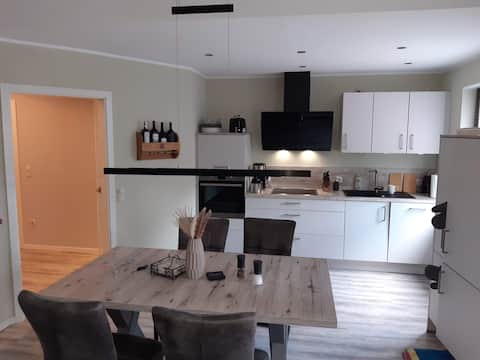
Modern apartment in Sauerland with balcony
Entire Place • 2 bedrooms
Ferienwohnung Happe
Entire Place • 1 bedroom
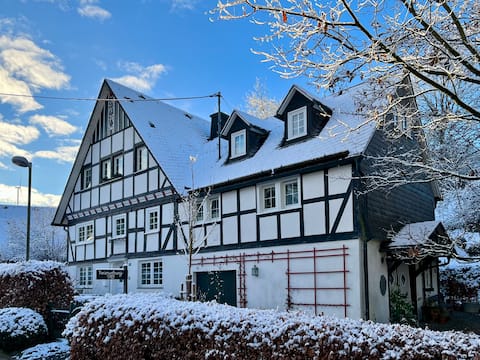
Apartment 1789 with garden in idyllic village
Entire Place • 3 bedrooms
Note: Performance varies based on location, size, amenities, seasonality, and management quality. Data reflects the past 12 months.
Top Performing Airbnb Hosts in Lennestadt (2026)
Learn from the best! This table showcases top-performing Airbnb hosts in Lennestadt based on the number of properties managed and estimated total revenue over the past year. Analyze their scale and performance metrics.
| Host Name | Properties | Grossing Revenue | Stay Reviews | Avg Rating |
|---|---|---|---|---|
| Falkenegg | 3 | $40,143 | 32 | 4.86/5.0 |
| Alexandra - Lohospo Service Te | 7 | $29,561 | 21 | 5.00/5.0 |
| Caroline | 2 | $26,813 | 365 | 4.96/5.0 |
| Novasol | 1 | $26,012 | 2 | Not Rated |
| Hardenacke GmbH | 1 | $24,779 | 113 | 4.55/5.0 |
| Ludwig | 1 | $18,638 | 85 | 4.96/5.0 |
| Alex | 1 | $13,302 | 36 | 4.97/5.0 |
| Tahir | 1 | $11,966 | 9 | 5.00/5.0 |
| Novasol | 1 | $10,901 | 1 | Not Rated |
| Marlies | 1 | $9,965 | 90 | 4.88/5.0 |
Analyzing the strategies of top hosts, such as their property selection, pricing, and guest communication, can offer valuable lessons for optimizing your own Airbnb operations in Lennestadt.
Dive Deeper: Advanced Lennestadt STR Market Data (2026)
Ready to unlock more insights? AirROI provides access to advanced metrics and comprehensive Airbnb data for Lennestadt. Explore detailed analytics beyond this report to refine your investment strategy, optimize pricing, and maximize your vacation rental profits.
Explore Advanced MetricsLennestadt Short-Term Rental Market Composition (2026): Property & Room Types
Room Type Distribution
Property Type Distribution
Market Composition Insights for Lennestadt
- The Lennestadt Airbnb market composition is heavily skewed towards Entire Home/Apt listings, which make up 87.1% of the 31 active rentals. This indicates strong guest preference for privacy and space.
- Looking at the property type distribution in Lennestadt, Apartment/Condo properties are the most common (58.1%), reflecting the local real estate landscape.
- Houses represent a significant 32.3% portion, catering likely to families or larger groups.
- The presence of 6.5% Hotel/Boutique listings indicates integration with traditional hospitality.
- Smaller segments like outdoor/unique (combined 3.2%) offer potential for unique stay experiences.
Lennestadt Airbnb Room Capacity Analysis (2026): Bedroom Distribution
Distribution of Listings by Number of Bedrooms
Room Capacity Insights for Lennestadt
- The dominant room capacity in Lennestadt is 1 bedroom listings, making up 38.7% of the market. This suggests a strong demand for properties suitable for couples or solo travelers.
- Together, 1 bedroom and 2 bedrooms properties represent 71.0% of the active Airbnb listings in Lennestadt, indicating a high concentration in these sizes.
- A significant 22.6% of listings offer 3+ bedrooms, catering to larger groups and families seeking more space in Lennestadt.
Lennestadt Vacation Rental Guest Capacity Trends (2026)
Distribution of Listings by Guest Capacity
Guest Capacity Insights for Lennestadt
- The most common guest capacity trend in Lennestadt vacation rentals is listings accommodating 4 guests (29%). This suggests the primary traveler segment is likely small families or groups.
- Properties designed for 4 guests and 6 guests dominate the Lennestadt STR market, accounting for 48.4% of listings.
- 29.1% of properties accommodate 6+ guests, serving the market segment for larger families or group travel in Lennestadt.
- On average, properties in Lennestadt are equipped to host 4.2 guests.
Lennestadt Airbnb Booking Patterns (2026): Available vs. Booked Days
Available Days Distribution
Booked Days Distribution
Booking Pattern Insights for Lennestadt
- The most common availability pattern in Lennestadt falls within the 271-366 days range, representing 74.2% of listings. This suggests many properties have significant open periods on their calendars.
- Approximately 93.6% of listings show high availability (181+ days open annually), indicating potential for increased bookings or specific owner usage patterns.
- For booked days, the 31-90 days range is most frequent in Lennestadt (41.9%), reflecting common guest stay durations or potential owner blocking patterns.
- A notable 6.5% of properties secure long booking periods (181+ days booked per year), highlighting successful long-term rental strategies or significant owner usage.
Lennestadt Airbnb Minimum Stay Requirements Analysis
Distribution of Listings by Minimum Night Requirement
1 Night
11 listings
35.5% of total
2 Nights
12 listings
38.7% of total
3 Nights
1 listings
3.2% of total
4-6 Nights
1 listings
3.2% of total
30+ Nights
6 listings
19.4% of total
Key Insights
- The most prevalent minimum stay requirement in Lennestadt is 2 Nights, adopted by 38.7% of listings. This highlights the market's preference for shorter, flexible bookings.
- A strong majority (74.2%) of the Lennestadt Airbnb data shows acceptance of very short stays (1-2 nights), indicating a dynamic, high-turnover market.
- A significant segment (19.4%) caters to monthly stays (30+ nights) in Lennestadt, pointing to opportunities in the extended-stay market.
Recommendations
- Align with the market by considering a 2 Nights minimum stay, as 38.7% of Lennestadt hosts use this setting.
- Explore offering discounts for stays of 30+ nights to attract the 19.4% of the market seeking extended stays.
- Adjust minimum nights based on seasonality – potentially shorter during low season and longer during peak demand periods in Lennestadt.
Lennestadt Airbnb Cancellation Policy Trends Analysis (2026)
Super Strict 30 Days
6 listings
19.4% of total
Super Strict 60 Days
5 listings
16.1% of total
Flexible
8 listings
25.8% of total
Moderate
9 listings
29% of total
Firm
3 listings
9.7% of total
Cancellation Policy Insights for Lennestadt
- The prevailing Airbnb cancellation policy trend in Lennestadt is Moderate, used by 29% of listings.
- There's a relatively balanced mix between guest-friendly (54.8%) and stricter (9.7%) policies, offering choices for different guest needs.
Recommendations for Hosts
- Consider adopting a Moderate policy to align with the 29% market standard in Lennestadt.
- Regularly review your cancellation policy against competitors and market demand shifts in Lennestadt.
Lennestadt STR Booking Lead Time Analysis (2026)
Average Booking Lead Time by Month
Booking Lead Time Insights for Lennestadt
- The overall average booking lead time for vacation rentals in Lennestadt is 87 days.
- Guests book furthest in advance for stays during December (average 130 days), likely coinciding with peak travel demand or local events.
- The shortest booking windows occur for stays in February (average 44 days), indicating more last-minute travel plans during this time.
- Seasonally, Fall (96 days avg.) sees the longest lead times, while Summer (75 days avg.) has the shortest, reflecting typical travel planning cycles.
Recommendations for Hosts
- Use the overall average lead time (87 days) as a baseline for your pricing and availability strategy in Lennestadt.
- For December stays, consider implementing length-of-stay discounts or slightly higher rates for bookings made less than 130 days out to capitalize on advance planning.
- Target marketing efforts for the Fall season well in advance (at least 96 days) to capture early planners.
- Monitor your own booking lead times against these Lennestadt averages to identify opportunities for dynamic pricing adjustments.
Popular & Essential Airbnb Amenities in Lennestadt (2026)
Amenity Prevalence
Amenity Insights for Lennestadt
- Popular amenities like Smoke alarm, Wifi, Heating are common but not universal. Offering these can provide a competitive edge.
- Warning: Wifi is not universally provided but is considered essential globally. Ensure reliable Wifi is offered.
Recommendations for Hosts
- Consider adding popular differentiators like Smoke alarm or Wifi to increase appeal.
- Highlight unique or less common amenities you offer (e.g., hot tub, dedicated workspace, EV charger) in your listing description and photos.
- Regularly check competitor amenities in Lennestadt to stay competitive.
Lennestadt Airbnb Guest Demographics & Profile Analysis (2026)
Guest Profile Summary for Lennestadt
- The typical guest profile for Airbnb in Lennestadt consists of primarily domestic travelers (83%), often arriving from nearby Düsseldorf, typically belonging to the Post-2000s (Gen Z/Alpha) group (50%), primarily speaking English or German.
- Domestic travelers account for 82.5% of guests.
- Key international markets include Germany (82.5%) and Netherlands (10.7%).
- Top languages spoken are English (41.8%) followed by German (36.7%).
- A significant demographic segment is the Post-2000s (Gen Z/Alpha) group, representing 50% of guests.
Recommendations for Hosts
- Target domestic marketing efforts towards travelers from Düsseldorf and Dortmund.
- Tailor amenities and listing descriptions to appeal to the dominant Post-2000s (Gen Z/Alpha) demographic (e.g., highlight fast WiFi, smart home features, local guides).
- Highlight unique local experiences or amenities relevant to the primary guest profile.
- Consider seasonal promotions aligned with peak travel times for key origin markets.
Nearby Short-Term Rental Market Comparison
How does the Lennestadt Airbnb market stack up against its neighbors? Compare key performance metrics like average monthly revenue, ADR, and occupancy rates in surrounding areas to understand the broader regional STR landscape.
| Market | Active Properties | Monthly Revenue | Daily Rate | Avg. Occupancy |
|---|---|---|---|---|
| Kruft | 13 | $3,022 | $258.41 | 37% |
| Unkel | 21 | $2,746 | $212.11 | 38% |
| Schwalefeld | 37 | $2,350 | $281.62 | 32% |
| Bendorf | 26 | $2,343 | $174.69 | 41% |
| Rieden | 20 | $2,291 | $203.13 | 43% |
| Bad Bertrich | 16 | $2,186 | $192.74 | 32% |
| Odenthal | 15 | $2,077 | $141.86 | 49% |
| Runkel | 12 | $2,036 | $221.40 | 42% |
| Eslohe | 26 | $2,024 | $230.66 | 37% |
| Dahlem | 41 | $1,954 | $199.18 | 42% |