Essen Airbnb Market Analysis 2026: Short Term Rental Data & Vacation Rental Statistics in North Rhine-Westphalia, Germany
Is Airbnb profitable in Essen in 2026? Explore comprehensive Airbnb analytics for Essen, North Rhine-Westphalia, Germany to uncover income potential. This 2026 STR market report for Essen, based on AirROI data from February 2025 to January 2026, reveals key trends in the market of 870 active listings.
Whether you're considering an Airbnb investment in Essen, optimizing your existing vacation rental, or exploring rental arbitrage opportunities, understanding the Essen Airbnb data is crucial. Leveraging the low regulation environment is key to maximizing your short term rental income potential. Let's dive into the specifics.
Key Essen Airbnb Performance Metrics Overview
Monthly Airbnb Revenue Variations & Income Potential in Essen (2026)
Understanding the monthly revenue variations for Airbnb listings in Essen is key to maximizing your short term rental income potential. Seasonality significantly impacts earnings. Our analysis, based on data from the past 12 months, shows that the peak revenue month for STRs in Essen is typically October, while February often presents the lowest earnings, highlighting opportunities for strategic pricing adjustments during shoulder and low seasons. Explore the typical Airbnb income in Essen across different performance tiers:
- Best-in-class properties (Top 10%) achieve $2,652+ monthly, often utilizing dynamic pricing and superior guest experiences.
- Strong performing properties (Top 25%) earn $1,827 or more, indicating effective management and desirable locations/amenities.
- Typical properties (Median) generate around $1,111 per month, representing the average market performance.
- Entry-level properties (Bottom 25%) see earnings around $541, often with potential for optimization.
Average Monthly Airbnb Earnings Trend in Essen
Essen Airbnb Occupancy Rate Trends (2026)
Maximize your bookings by understanding the Essen STR occupancy trends. Seasonal demand shifts significantly influence how often properties are booked. Typically, Octobersees the highest demand (peak season occupancy), while January experiences the lowest (low season). Effective strategies, like adjusting minimum stays or offering promotions, can boost occupancy during slower periods. Here's how different property tiers perform in Essen:
- Best-in-class properties (Top 10%) achieve 78%+ occupancy, indicating high desirability and potentially optimized availability.
- Strong performing properties (Top 25%) maintain 60% or higher occupancy, suggesting good market fit and guest satisfaction.
- Typical properties (Median) have an occupancy rate around 35%.
- Entry-level properties (Bottom 25%) average 17% occupancy, potentially facing higher vacancy.
Average Monthly Occupancy Rate Trend in Essen
Average Daily Rate (ADR) Airbnb Trends in Essen (2026)
Effective short term rental pricing strategy in Essen involves understanding monthly ADR fluctuations. The Average Daily Rate (ADR) for Airbnb in Essen typically peaks in October and dips lowest during February. Leveraging Airbnb dynamic pricing tools or strategies based on this seasonality can significantly boost revenue. Here's a look at the typical nightly rates achieved:
- Best-in-class properties (Top 10%) command rates of $190+ per night, often due to premium features or locations.
- Strong performing properties (Top 25%) achieve nightly rates of $135 or more.
- Typical properties (Median) charge around $97 per night.
- Entry-level properties (Bottom 25%) earn around $71 per night.
Average Daily Rate (ADR) Trend by Month in Essen
Get Live Essen Market Intelligence 👇

Explore Real-time Analytics
Airbnb Seasonality Analysis & Trends in Essen (2026)
Peak Season (October, September, July)
- Revenue averages $1,625 per month
- Occupancy rates average 41.9%
- Daily rates average $128
Shoulder Season
- Revenue averages $1,378 per month
- Occupancy maintains around 40.0%
- Daily rates hold near $119
Low Season (January, February, April)
- Revenue drops to average $1,076 per month
- Occupancy decreases to average 35.8%
- Daily rates adjust to average $114
Seasonality Insights for Essen
- The Airbnb seasonality in Essen shows moderate seasonality with distinct peak and low periods. While the sections above show seasonal averages, it's also insightful to look at the extremes:
- During the high season, the absolute peak month showcases Essen's highest earning potential, with monthly revenues capable of climbing to $1,836, occupancy reaching a high of 42.8%, and ADRs peaking at $135.
- Conversely, the slowest single month of the year, typically falling within the low season, marks the market's lowest point. In this month, revenue might dip to $1,022, occupancy could drop to 30.4%, and ADRs may adjust down to $108.
- Understanding both the seasonal averages and these monthly peaks and troughs in revenue, occupancy, and ADR is crucial for maximizing your Airbnb profit potential in Essen.
Seasonal Strategies for Maximizing Profit
- Peak Season: Maximize revenue through premium pricing and potentially longer minimum stays. Ensure high availability.
- Low Season: Offer competitive pricing, special promotions (e.g., extended stay discounts), and flexible cancellation policies. Target off-season travelers like remote workers or budget-conscious guests.
- Shoulder Seasons: Implement dynamic pricing that balances peak and low rates. Target weekend travelers or specific events. Offer slightly more flexible terms than peak season.
- Regularly analyze your own performance against these Essen seasonality benchmarks and adjust your pricing and availability strategy accordingly.
Best Areas for Airbnb Investment in Essen (2026)
Exploring the top neighborhoods for short-term rentals in Essen? This section highlights key areas, outlining why they are attractive for hosts and guests, along with notable local attractions. Consider these locations based on your target guest profile and investment strategy.
| Neighborhood / Area | Why Host Here? (Target Guests & Appeal) | Key Attractions & Landmarks |
|---|---|---|
| Kettwig | Picturesque district along the Ruhr River known for its charming old town and beautiful parks. Highly sought after by tourists looking for tranquility and nature, with great local dining. | Old Town Kettwig, St. Heinrich Church, Kettwiger Hafen, Ruhrtal Hiking Trail, Schloss Borbeck |
| Rüttenscheid | Vibrant neighborhood with a mix of modern and traditional elements, popular for its dining scene and proximity to museums. Ideal for visitors wanting to experience local culture and cuisine. | Museum Folkwang, Grugapark, Rüttenscheider Markt, Local restaurants and cafes, Kunstmuseum Essen |
| Essen City Centre | The bustling heart of Essen, known for shopping, entertainment, and cultural spots. Attracts a diverse crowd including business travelers and tourists looking to explore the city. | Essen Cathedral, Altstadt Galerie, Colosseum Theater, Aalto Theatre, Shopping streets |
| Bredeney | Exclusive residential area offering a quiet environment with access to parks and golf courses. Great for travelers looking for upscale accommodations in a peaceful setting. | Baldeneysee, Golf Club Essen, Gruga Park, St. Ludgerus Church, Local wine bars |
| Weisswasser | Charming district known for its unique architecture and proximity to recreational activities. Perfect for families looking for a peaceful stay with easy access to nature. | LVR-Industriemuseum, Essen University of Applied Sciences, Local parks and forests, Cultural events and festivals, Nature trails |
| Kray | A blend of urban living and historical sites, Kray offers visitors a unique perspective on Essen's industrial heritage coupled with many local amenities. | Cultural heritage sites, Local breweries, Public parks, Shopping options, Public transport links to Essen City |
| Altenessen | An up-and-coming area with revitalization efforts, attracting younger crowds and hip eateries. Offers a glimpse into Essen's evolving neighborhoods. | Essen Steel Works, Theater im অনুযায়ী, Local street food culture, Art galleries, Community events |
| Stoppenberg | Historic district with beautiful villas and parkland, appealing to visitors looking for a leisurely escape while still being close to city attractions. | Zollverein Coal Mine, Botanischer Garten, Local historical sites, Green spaces, Access to public transport |
Understanding Airbnb License Requirements & STR Laws in Essen (2026)
While Essen, North Rhine-Westphalia, Germany currently shows low STR regulations, specific Airbnb license requirements might still exist or change. Always verify the latest short term rental regulations and Airbnb license requirements directly with local government authorities for Essen to ensure full compliance before hosting.
(Source: AirROI data, 2026, based on 1% licensed listings)
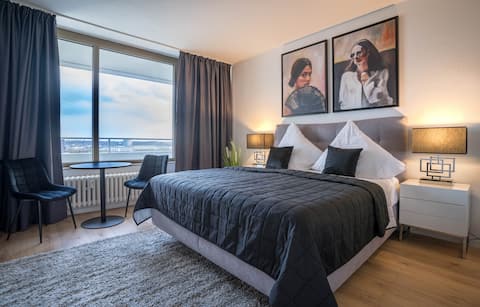
Top Performing Airbnb Properties in Essen (2026)
Benchmark your potential! Explore examples of top-performing Airbnb properties in Essenbased on Trailing Twelve Month (TTM) revenue. Analyze their characteristics, revenue, occupancy rate, and ADR to understand what drives success in this market.

Beyond Living® | 235 m² LOFT | Billard | Fireplace
Entire Place • 4 bedrooms

Entire house near the fair
Entire Place • 3 bedrooms

Modern, bright, friendly - 7+1 persons
Entire Place • 3 bedrooms

Rudi Homes Essen # 1
Entire Place • 4 bedrooms

Luxury apartment, 140 sqm, top location, two parking spaces
Entire Place • 4 bedrooms
RüSuite - Cozy apartment in Rüttenscheid
Entire Place • 1 bedroom
Note: Performance varies based on location, size, amenities, seasonality, and management quality. Data reflects the past 12 months.
Top Performing Airbnb Hosts in Essen (2026)
Learn from the best! This table showcases top-performing Airbnb hosts in Essen based on the number of properties managed and estimated total revenue over the past year. Analyze their scale and performance metrics.
| Host Name | Properties | Grossing Revenue | Stay Reviews | Avg Rating |
|---|---|---|---|---|
| Sebastian | 15 | $300,824 | 728 | 4.71/5.0 |
| Norbert | 7 | $252,704 | 432 | 4.76/5.0 |
| Temel | 25 | $249,993 | 236 | 4.57/5.0 |
| Viktoria | 5 | $244,881 | 413 | 4.77/5.0 |
| Julian | 10 | $241,854 | 689 | 4.84/5.0 |
| Daniel | 4 | $178,793 | 315 | 4.89/5.0 |
| Katharina & Sergej | 13 | $165,842 | 513 | 4.79/5.0 |
| Julian | 5 | $134,166 | 124 | 4.77/5.0 |
| Limehome | 7 | $124,574 | 360 | 4.49/5.0 |
| Kathi Und Marcel | 7 | $122,493 | 3248 | 4.88/5.0 |
Analyzing the strategies of top hosts, such as their property selection, pricing, and guest communication, can offer valuable lessons for optimizing your own Airbnb operations in Essen.
Dive Deeper: Advanced Essen STR Market Data (2026)
Ready to unlock more insights? AirROI provides access to advanced metrics and comprehensive Airbnb data for Essen. Explore detailed analytics beyond this report to refine your investment strategy, optimize pricing, and maximize your vacation rental profits.
Explore Advanced MetricsEssen Short-Term Rental Market Composition (2026): Property & Room Types
Room Type Distribution
Property Type Distribution
Market Composition Insights for Essen
- The Essen Airbnb market composition is heavily skewed towards Entire Home/Apt listings, which make up 89.1% of the 870 active rentals. This indicates strong guest preference for privacy and space.
- Looking at the property type distribution in Essen, Apartment/Condo properties are the most common (89.9%), reflecting the local real estate landscape.
- Smaller segments like hotel/boutique, others, unique stays (combined 3.4%) offer potential for unique stay experiences.
Essen Airbnb Room Capacity Analysis (2026): Bedroom Distribution
Distribution of Listings by Number of Bedrooms
Room Capacity Insights for Essen
- The dominant room capacity in Essen is 1 bedroom listings, making up 52.4% of the market. This suggests a strong demand for properties suitable for couples or solo travelers.
- Together, 1 bedroom and 2 bedrooms properties represent 77.5% of the active Airbnb listings in Essen, indicating a high concentration in these sizes.
- With over half the market (52.4%) consisting of studios or 1-bedroom units, Essen is particularly well-suited for individuals or couples.
- Listings with 3+ bedrooms (8.8%) represent a smaller niche, potentially indicating an underserved market for larger group accommodations in Essen.
Essen Vacation Rental Guest Capacity Trends (2026)
Distribution of Listings by Guest Capacity
Guest Capacity Insights for Essen
- The most common guest capacity trend in Essen vacation rentals is listings accommodating 2 guests (28.4%). This suggests the primary traveler segment is likely couples or solo travelers.
- Properties designed for 2 guests and 4 guests dominate the Essen STR market, accounting for 52.2% of listings.
- 14.0% of properties accommodate 6+ guests, serving the market segment for larger families or group travel in Essen.
- On average, properties in Essen are equipped to host 3.3 guests.
Essen Airbnb Booking Patterns (2026): Available vs. Booked Days
Available Days Distribution
Booked Days Distribution
Booking Pattern Insights for Essen
- The most common availability pattern in Essen falls within the 271-366 days range, representing 52.1% of listings. This suggests many properties have significant open periods on their calendars.
- Approximately 81.1% of listings show high availability (181+ days open annually), indicating potential for increased bookings or specific owner usage patterns.
- For booked days, the 31-90 days range is most frequent in Essen (31.8%), reflecting common guest stay durations or potential owner blocking patterns.
- A notable 20.3% of properties secure long booking periods (181+ days booked per year), highlighting successful long-term rental strategies or significant owner usage.
Essen Airbnb Minimum Stay Requirements Analysis
Distribution of Listings by Minimum Night Requirement
1 Night
248 listings
28.5% of total
2 Nights
228 listings
26.2% of total
3 Nights
55 listings
6.3% of total
4-6 Nights
59 listings
6.8% of total
7-29 Nights
44 listings
5.1% of total
30+ Nights
236 listings
27.1% of total
Key Insights
- The most prevalent minimum stay requirement in Essen is 1 Night, adopted by 28.5% of listings. This highlights the market's preference for shorter, flexible bookings.
- A significant segment (27.1%) caters to monthly stays (30+ nights) in Essen, pointing to opportunities in the extended-stay market.
Recommendations
- Align with the market by considering a 1 Night minimum stay, as 28.5% of Essen hosts use this setting.
- If feasible, allowing 1-night stays, especially midweek or during low season, could capture last-minute bookings, as only 28.5% currently do.
- Explore offering discounts for stays of 30+ nights to attract the 27.1% of the market seeking extended stays.
- Adjust minimum nights based on seasonality – potentially shorter during low season and longer during peak demand periods in Essen.
Essen Airbnb Cancellation Policy Trends Analysis (2026)
Limited
4 listings
0.5% of total
Super Strict 60 Days
5 listings
0.6% of total
Refundable
1 listings
0.1% of total
Super Strict 30 Days
14 listings
1.6% of total
Flexible
250 listings
28.7% of total
Moderate
306 listings
35.2% of total
Firm
224 listings
25.7% of total
Strict
66 listings
7.6% of total
Cancellation Policy Insights for Essen
- The prevailing Airbnb cancellation policy trend in Essen is Moderate, used by 35.2% of listings.
- There's a relatively balanced mix between guest-friendly (63.9%) and stricter (33.3%) policies, offering choices for different guest needs.
- Strict cancellation policies are quite rare (7.6%), potentially making listings with this policy less competitive unless justified by high demand or property type.
Recommendations for Hosts
- Consider adopting a Moderate policy to align with the 35.2% market standard in Essen.
- Using a Strict policy might deter some guests, as only 7.6% of listings use it. Evaluate if potential revenue protection outweighs possible lower booking rates.
- Regularly review your cancellation policy against competitors and market demand shifts in Essen.
Essen STR Booking Lead Time Analysis (2026)
Average Booking Lead Time by Month
Booking Lead Time Insights for Essen
- The overall average booking lead time for vacation rentals in Essen is 58 days.
- Guests book furthest in advance for stays during October (average 107 days), likely coinciding with peak travel demand or local events.
- The shortest booking windows occur for stays in April (average 34 days), indicating more last-minute travel plans during this time.
- Seasonally, Fall (73 days avg.) sees the longest lead times, while Spring (36 days avg.) has the shortest, reflecting typical travel planning cycles.
Recommendations for Hosts
- Use the overall average lead time (58 days) as a baseline for your pricing and availability strategy in Essen.
- For October stays, consider implementing length-of-stay discounts or slightly higher rates for bookings made less than 107 days out to capitalize on advance planning.
- Target marketing efforts for the Fall season well in advance (at least 73 days) to capture early planners.
- Monitor your own booking lead times against these Essen averages to identify opportunities for dynamic pricing adjustments.
Popular & Essential Airbnb Amenities in Essen (2026)
Amenity Prevalence
Amenity Insights for Essen
- Essential amenities in Essen that guests expect include: Wifi. Lacking these (this) could significantly impact bookings.
- Popular amenities like Smoke alarm, Kitchen, Heating are common but not universal. Offering these can provide a competitive edge.
Recommendations for Hosts
- Ensure your listing includes all essential amenities for Essen: Wifi.
- Prioritize adding missing essentials: Wifi.
- Consider adding popular differentiators like Smoke alarm or Kitchen to increase appeal.
- Highlight unique or less common amenities you offer (e.g., hot tub, dedicated workspace, EV charger) in your listing description and photos.
- Regularly check competitor amenities in Essen to stay competitive.
Essen Airbnb Guest Demographics & Profile Analysis (2026)
Guest Profile Summary for Essen
- The typical guest profile for Airbnb in Essen consists of a mix of domestic (59%) and international guests, often arriving from nearby Berlin, typically belonging to the Post-2000s (Gen Z/Alpha) group (50%), primarily speaking English or German.
- Domestic travelers account for 58.5% of guests.
- Key international markets include Germany (58.5%) and Netherlands (7.9%).
- Top languages spoken are English (37.4%) followed by German (27.1%).
- A significant demographic segment is the Post-2000s (Gen Z/Alpha) group, representing 50% of guests.
Recommendations for Hosts
- Balance marketing efforts between domestic and international channels based on the guest mix.
- Tailor amenities and listing descriptions to appeal to the dominant Post-2000s (Gen Z/Alpha) demographic (e.g., highlight fast WiFi, smart home features, local guides).
- Highlight unique local experiences or amenities relevant to the primary guest profile.
- Consider seasonal promotions aligned with peak travel times for key origin markets.
Nearby Short-Term Rental Market Comparison
How does the Essen Airbnb market stack up against its neighbors? Compare key performance metrics like average monthly revenue, ADR, and occupancy rates in surrounding areas to understand the broader regional STR landscape.
| Market | Active Properties | Monthly Revenue | Daily Rate | Avg. Occupancy |
|---|---|---|---|---|
| Losser | 10 | $7,954 | $1060.34 | 27% |
| Baarlo | 20 | $5,442 | $332.61 | 51% |
| Ruinen | 13 | $3,044 | $227.08 | 48% |
| Terwolde | 11 | $3,030 | $208.36 | 59% |
| Kruft | 13 | $3,022 | $258.41 | 37% |
| Neede | 10 | $2,882 | $410.06 | 30% |
| Lievelde | 23 | $2,862 | $271.13 | 40% |
| Waimes | 28 | $2,758 | $386.84 | 31% |
| Unkel | 21 | $2,746 | $212.11 | 38% |
| Büllingen | 27 | $2,744 | $302.32 | 36% |