Duisburg Airbnb Market Analysis 2026: Short Term Rental Data & Vacation Rental Statistics in North Rhine-Westphalia, Germany
Is Airbnb profitable in Duisburg in 2026? Explore comprehensive Airbnb analytics for Duisburg, North Rhine-Westphalia, Germany to uncover income potential. This 2026 STR market report for Duisburg, based on AirROI data from February 2025 to January 2026, reveals key trends in the market of 492 active listings.
Whether you're considering an Airbnb investment in Duisburg, optimizing your existing vacation rental, or exploring rental arbitrage opportunities, understanding the Duisburg Airbnb data is crucial. Leveraging the low regulation environment is key to maximizing your short term rental income potential. Let's dive into the specifics.
Key Duisburg Airbnb Performance Metrics Overview
Monthly Airbnb Revenue Variations & Income Potential in Duisburg (2026)
Understanding the monthly revenue variations for Airbnb listings in Duisburg is key to maximizing your short term rental income potential. Seasonality significantly impacts earnings. Our analysis, based on data from the past 12 months, shows that the peak revenue month for STRs in Duisburg is typically October, while January often presents the lowest earnings, highlighting opportunities for strategic pricing adjustments during shoulder and low seasons. Explore the typical Airbnb income in Duisburg across different performance tiers:
- Best-in-class properties (Top 10%) achieve $3,086+ monthly, often utilizing dynamic pricing and superior guest experiences.
- Strong performing properties (Top 25%) earn $1,833 or more, indicating effective management and desirable locations/amenities.
- Typical properties (Median) generate around $1,019 per month, representing the average market performance.
- Entry-level properties (Bottom 25%) see earnings around $502, often with potential for optimization.
Average Monthly Airbnb Earnings Trend in Duisburg
Duisburg Airbnb Occupancy Rate Trends (2026)
Maximize your bookings by understanding the Duisburg STR occupancy trends. Seasonal demand shifts significantly influence how often properties are booked. Typically, Octobersees the highest demand (peak season occupancy), while January experiences the lowest (low season). Effective strategies, like adjusting minimum stays or offering promotions, can boost occupancy during slower periods. Here's how different property tiers perform in Duisburg:
- Best-in-class properties (Top 10%) achieve 78%+ occupancy, indicating high desirability and potentially optimized availability.
- Strong performing properties (Top 25%) maintain 58% or higher occupancy, suggesting good market fit and guest satisfaction.
- Typical properties (Median) have an occupancy rate around 32%.
- Entry-level properties (Bottom 25%) average 16% occupancy, potentially facing higher vacancy.
Average Monthly Occupancy Rate Trend in Duisburg
Average Daily Rate (ADR) Airbnb Trends in Duisburg (2026)
Effective short term rental pricing strategy in Duisburg involves understanding monthly ADR fluctuations. The Average Daily Rate (ADR) for Airbnb in Duisburg typically peaks in January and dips lowest during July. Leveraging Airbnb dynamic pricing tools or strategies based on this seasonality can significantly boost revenue. Here's a look at the typical nightly rates achieved:
- Best-in-class properties (Top 10%) command rates of $268+ per night, often due to premium features or locations.
- Strong performing properties (Top 25%) achieve nightly rates of $153 or more.
- Typical properties (Median) charge around $97 per night.
- Entry-level properties (Bottom 25%) earn around $65 per night.
Average Daily Rate (ADR) Trend by Month in Duisburg
Get Live Duisburg Market Intelligence 👇

Explore Real-time Analytics
Airbnb Seasonality Analysis & Trends in Duisburg (2026)
Peak Season (October, November, September)
- Revenue averages $2,310 per month
- Occupancy rates average 41.4%
- Daily rates average $197
Shoulder Season
- Revenue averages $1,614 per month
- Occupancy maintains around 39.0%
- Daily rates hold near $147
Low Season (January, May, June)
- Revenue drops to average $1,257 per month
- Occupancy decreases to average 32.2%
- Daily rates adjust to average $160
Seasonality Insights for Duisburg
- The Airbnb seasonality in Duisburg shows highly seasonal trends requiring careful strategy. While the sections above show seasonal averages, it's also insightful to look at the extremes:
- During the high season, the absolute peak month showcases Duisburg's highest earning potential, with monthly revenues capable of climbing to $2,614, occupancy reaching a high of 44.8%, and ADRs peaking at $207.
- Conversely, the slowest single month of the year, typically falling within the low season, marks the market's lowest point. In this month, revenue might dip to $1,137, occupancy could drop to 28.4%, and ADRs may adjust down to $129.
- Understanding both the seasonal averages and these monthly peaks and troughs in revenue, occupancy, and ADR is crucial for maximizing your Airbnb profit potential in Duisburg.
Seasonal Strategies for Maximizing Profit
- Peak Season: Maximize revenue through premium pricing and potentially longer minimum stays. Ensure high availability.
- Low Season: Offer competitive pricing, special promotions (e.g., extended stay discounts), and flexible cancellation policies. Target off-season travelers like remote workers or budget-conscious guests.
- Shoulder Seasons: Implement dynamic pricing that balances peak and low rates. Target weekend travelers or specific events. Offer slightly more flexible terms than peak season.
- Regularly analyze your own performance against these Duisburg seasonality benchmarks and adjust your pricing and availability strategy accordingly.
Best Areas for Airbnb Investment in Duisburg (2026)
Exploring the top neighborhoods for short-term rentals in Duisburg? This section highlights key areas, outlining why they are attractive for hosts and guests, along with notable local attractions. Consider these locations based on your target guest profile and investment strategy.
| Neighborhood / Area | Why Host Here? (Target Guests & Appeal) | Key Attractions & Landmarks |
|---|---|---|
| Duisburg City Center | Vibrant urban area with a mix of shopping, dining, and entertainment options. Ideal for guests looking to explore the heart of Duisburg. | Duisburg Canal, CityPalais Duisburg, Theater Duisburg, Mercatorhalle, Duisburg's shopping district |
| Ruhrort | Historic port area with charming waterfront views. Attracts visitors interested in maritime activities and local history. | Ruhrort Port, Duisburg Nordsteert, Harbor Museum, Duisburg's scenic promenade |
| Duisburg-Aldemoor | Residential neighborhood with local parks and family-friendly amenities. Great for longer stays and those seeking a quieter environment. | Walsum Forest, Local parks, Family-friendly cafes |
| Duisburg-Hamborn | Emerging neighborhood known for its cultural diversity and community spirit. Highly appealing for visitors interested in local culture and traditions. | Hamborn City Park, Local cultural festivals, Duisburg Museums |
| Marxloh | Culturally rich area with a unique mix of traditional and modern elements. Attractive to guests seeking experience off the beaten path. | Cultural centers, Local eateries, Open-air markets |
| Duisburg-Walsum | A calm, suburban area with nature parks and recreational opportunities. Perfect for guests wanting to relax away from the bustling city. | Walsum's nature reserves, Birdwatching sites, Family parks |
| Neudorf | Attractive residential area with local shops, cafes, and a friendly atmosphere. Great for guests looking for a local experience. | Duisburg Botanical Garden, Shopping streets, Local events |
| Bruckhausen | Industrial area undergoing revitalization with unique architecture and new developments. This area appeals to visitors interested in modern urban transformations. | Industrial heritage sites, Art installations, Local breweries |
Understanding Airbnb License Requirements & STR Laws in Duisburg (2026)
While Duisburg, North Rhine-Westphalia, Germany currently shows low STR regulations, specific Airbnb license requirements might still exist or change. Always verify the latest short term rental regulations and Airbnb license requirements directly with local government authorities for Duisburg to ensure full compliance before hosting.
(Source: AirROI data, 2026, based on 1% licensed listings)
Top Performing Airbnb Properties in Duisburg (2026)
Benchmark your potential! Explore examples of top-performing Airbnb properties in Duisburgbased on Trailing Twelve Month (TTM) revenue. Analyze their characteristics, revenue, occupancy rate, and ADR to understand what drives success in this market.
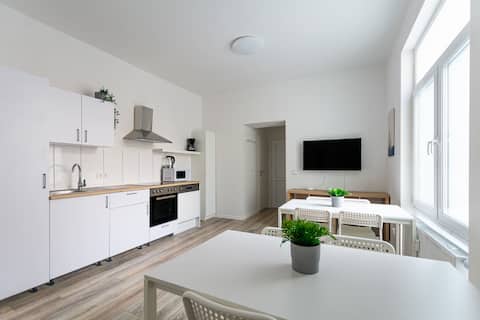
T&K Apartments-Duisburg-3 Zimmer-EG/Apt 2
Entire Place • 3 bedrooms
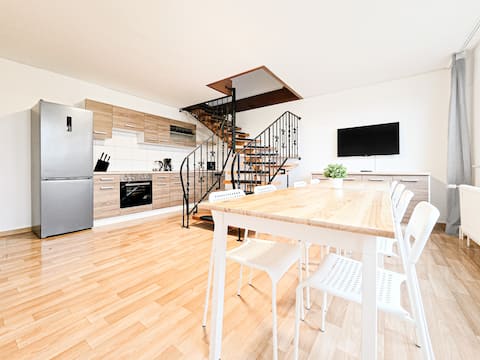
RAJ Living - 4 Room Maisonette - 25 min Messe DUS
Entire Place • 4 bedrooms
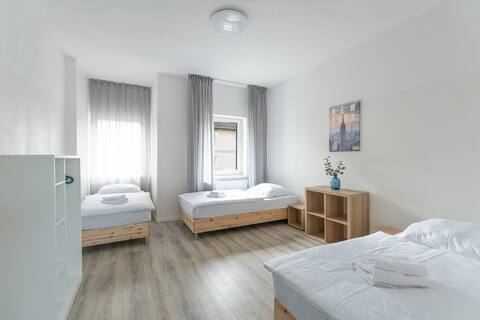
T&K Apartments-Duisburg-2 Rooms Aprt-1OG/Apt 4
Entire Place • 2 bedrooms
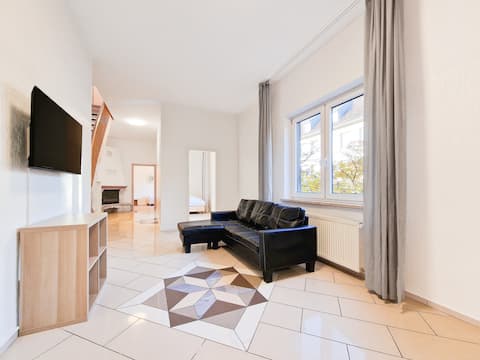
Tolstov Apartments - 4 Rooms - 25 min Messe DUS
Entire Place • 4 bedrooms
RAJ Living - Monteur Apartment - 25 min to Düsseldorf Airport Trade Fair
Entire Place • 1 bedroom
T&K Apartments - Duisburg- 1 room 1st floor Apt. 2
Entire Place • 1 bedroom
Note: Performance varies based on location, size, amenities, seasonality, and management quality. Data reflects the past 12 months.
Top Performing Airbnb Hosts in Duisburg (2026)
Learn from the best! This table showcases top-performing Airbnb hosts in Duisburg based on the number of properties managed and estimated total revenue over the past year. Analyze their scale and performance metrics.
| Host Name | Properties | Grossing Revenue | Stay Reviews | Avg Rating |
|---|---|---|---|---|
| Ivan | 34 | $1,111,123 | 173 | 4.64/5.0 |
| Ivan | 31 | $871,787 | 169 | 4.82/5.0 |
| Julia | 19 | $220,077 | 356 | 4.63/5.0 |
| Secret Hideaways | 9 | $183,499 | 52 | 4.48/5.0 |
| Simon | 7 | $154,730 | 629 | 4.77/5.0 |
| Jacky & Marco | 11 | $140,217 | 232 | 4.75/5.0 |
| Hello | 35 | $127,295 | 731 | 4.53/5.0 |
| Daniela & Thomas | 5 | $122,058 | 171 | 4.78/5.0 |
| Nalan | 14 | $119,517 | 627 | 4.85/5.0 |
| Manfred Und Markus | 4 | $99,571 | 74 | 4.69/5.0 |
Analyzing the strategies of top hosts, such as their property selection, pricing, and guest communication, can offer valuable lessons for optimizing your own Airbnb operations in Duisburg.
Dive Deeper: Advanced Duisburg STR Market Data (2026)
Ready to unlock more insights? AirROI provides access to advanced metrics and comprehensive Airbnb data for Duisburg. Explore detailed analytics beyond this report to refine your investment strategy, optimize pricing, and maximize your vacation rental profits.
Explore Advanced MetricsDuisburg Short-Term Rental Market Composition (2026): Property & Room Types
Room Type Distribution
Property Type Distribution
Market Composition Insights for Duisburg
- The Duisburg Airbnb market composition is heavily skewed towards Entire Home/Apt listings, which make up 85.4% of the 492 active rentals. This indicates strong guest preference for privacy and space.
- Looking at the property type distribution in Duisburg, Apartment/Condo properties are the most common (88.8%), reflecting the local real estate landscape.
- Smaller segments like hotel/boutique, others, outdoor/unique (combined 3.4%) offer potential for unique stay experiences.
Duisburg Airbnb Room Capacity Analysis (2026): Bedroom Distribution
Distribution of Listings by Number of Bedrooms
Room Capacity Insights for Duisburg
- The dominant room capacity in Duisburg is 1 bedroom listings, making up 43.3% of the market. This suggests a strong demand for properties suitable for couples or solo travelers.
- Together, 1 bedroom and 2 bedrooms properties represent 64.0% of the active Airbnb listings in Duisburg, indicating a high concentration in these sizes.
- A significant 22.4% of listings offer 3+ bedrooms, catering to larger groups and families seeking more space in Duisburg.
Duisburg Vacation Rental Guest Capacity Trends (2026)
Distribution of Listings by Guest Capacity
Guest Capacity Insights for Duisburg
- The most common guest capacity trend in Duisburg vacation rentals is listings accommodating 2 guests (24.6%). This suggests the primary traveler segment is likely couples or solo travelers.
- Properties designed for 2 guests and 4 guests dominate the Duisburg STR market, accounting for 41.5% of listings.
- 26.2% of properties accommodate 6+ guests, serving the market segment for larger families or group travel in Duisburg.
- On average, properties in Duisburg are equipped to host 3.7 guests.
Duisburg Airbnb Booking Patterns (2026): Available vs. Booked Days
Available Days Distribution
Booked Days Distribution
Booking Pattern Insights for Duisburg
- The most common availability pattern in Duisburg falls within the 271-366 days range, representing 62.2% of listings. This suggests many properties have significant open periods on their calendars.
- Approximately 87.4% of listings show high availability (181+ days open annually), indicating potential for increased bookings or specific owner usage patterns.
- For booked days, the 31-90 days range is most frequent in Duisburg (33.1%), reflecting common guest stay durations or potential owner blocking patterns.
- A notable 13.6% of properties secure long booking periods (181+ days booked per year), highlighting successful long-term rental strategies or significant owner usage.
Duisburg Airbnb Minimum Stay Requirements Analysis
Distribution of Listings by Minimum Night Requirement
1 Night
94 listings
19.1% of total
2 Nights
92 listings
18.7% of total
3 Nights
55 listings
11.2% of total
4-6 Nights
54 listings
11% of total
7-29 Nights
30 listings
6.1% of total
30+ Nights
167 listings
33.9% of total
Key Insights
- The most prevalent minimum stay requirement in Duisburg is 30+ Nights, adopted by 33.9% of listings. This highlights the market's preference for longer commitments.
- A significant segment (33.9%) caters to monthly stays (30+ nights) in Duisburg, pointing to opportunities in the extended-stay market.
Recommendations
- Align with the market by considering a 30+ Nights minimum stay, as 33.9% of Duisburg hosts use this setting.
- If feasible, allowing 1-night stays, especially midweek or during low season, could capture last-minute bookings, as only 19.1% currently do.
- Explore offering discounts for stays of 30+ nights to attract the 33.9% of the market seeking extended stays.
- Adjust minimum nights based on seasonality – potentially shorter during low season and longer during peak demand periods in Duisburg.
Duisburg Airbnb Cancellation Policy Trends Analysis (2026)
Super Strict 60 Days
63 listings
12.9% of total
Flexible
163 listings
33.3% of total
Moderate
132 listings
26.9% of total
Firm
93 listings
19% of total
Strict
39 listings
8% of total
Cancellation Policy Insights for Duisburg
- The prevailing Airbnb cancellation policy trend in Duisburg is Flexible, used by 33.3% of listings.
- There's a relatively balanced mix between guest-friendly (60.2%) and stricter (27.0%) policies, offering choices for different guest needs.
- Strict cancellation policies are quite rare (8%), potentially making listings with this policy less competitive unless justified by high demand or property type.
Recommendations for Hosts
- Consider adopting a Flexible policy to align with the 33.3% market standard in Duisburg.
- Using a Strict policy might deter some guests, as only 8% of listings use it. Evaluate if potential revenue protection outweighs possible lower booking rates.
- Regularly review your cancellation policy against competitors and market demand shifts in Duisburg.
Duisburg STR Booking Lead Time Analysis (2026)
Average Booking Lead Time by Month
Booking Lead Time Insights for Duisburg
- The overall average booking lead time for vacation rentals in Duisburg is 40 days.
- Guests book furthest in advance for stays during October (average 74 days), likely coinciding with peak travel demand or local events.
- The shortest booking windows occur for stays in February (average 16 days), indicating more last-minute travel plans during this time.
- Seasonally, Fall (59 days avg.) sees the longest lead times, while Winter (25 days avg.) has the shortest, reflecting typical travel planning cycles.
Recommendations for Hosts
- Use the overall average lead time (40 days) as a baseline for your pricing and availability strategy in Duisburg.
- For October stays, consider implementing length-of-stay discounts or slightly higher rates for bookings made less than 74 days out to capitalize on advance planning.
- Target marketing efforts for the Fall season well in advance (at least 59 days) to capture early planners.
- Monitor your own booking lead times against these Duisburg averages to identify opportunities for dynamic pricing adjustments.
Popular & Essential Airbnb Amenities in Duisburg (2026)
Amenity Prevalence
Amenity Insights for Duisburg
- Essential amenities in Duisburg that guests expect include: Wifi. Lacking these (this) could significantly impact bookings.
- Popular amenities like Smoke alarm, Kitchen, TV are common but not universal. Offering these can provide a competitive edge.
Recommendations for Hosts
- Ensure your listing includes all essential amenities for Duisburg: Wifi.
- Prioritize adding missing essentials: Wifi.
- Consider adding popular differentiators like Smoke alarm or Kitchen to increase appeal.
- Highlight unique or less common amenities you offer (e.g., hot tub, dedicated workspace, EV charger) in your listing description and photos.
- Regularly check competitor amenities in Duisburg to stay competitive.
Duisburg Airbnb Guest Demographics & Profile Analysis (2026)
Guest Profile Summary for Duisburg
- The typical guest profile for Airbnb in Duisburg consists of a mix of domestic (53%) and international guests, often arriving from nearby Berlin, typically belonging to the Post-2000s (Gen Z/Alpha) group (50%), primarily speaking English or German.
- Domestic travelers account for 53.4% of guests.
- Key international markets include Germany (53.4%) and Netherlands (8.7%).
- Top languages spoken are English (38%) followed by German (26.8%).
- A significant demographic segment is the Post-2000s (Gen Z/Alpha) group, representing 50% of guests.
Recommendations for Hosts
- Balance marketing efforts between domestic and international channels based on the guest mix.
- Tailor amenities and listing descriptions to appeal to the dominant Post-2000s (Gen Z/Alpha) demographic (e.g., highlight fast WiFi, smart home features, local guides).
- Highlight unique local experiences or amenities relevant to the primary guest profile.
- Consider seasonal promotions aligned with peak travel times for key origin markets.
Nearby Short-Term Rental Market Comparison
How does the Duisburg Airbnb market stack up against its neighbors? Compare key performance metrics like average monthly revenue, ADR, and occupancy rates in surrounding areas to understand the broader regional STR landscape.
| Market | Active Properties | Monthly Revenue | Daily Rate | Avg. Occupancy |
|---|---|---|---|---|
| Losser | 10 | $7,954 | $1060.34 | 27% |
| Haghorst | 11 | $5,995 | $480.40 | 40% |
| Baarlo | 20 | $5,442 | $332.61 | 51% |
| Wellin | 12 | $4,365 | $446.64 | 42% |
| Aubel | 26 | $4,191 | $283.88 | 46% |
| Bertogne | 26 | $3,839 | $325.90 | 42% |
| Kortenhoef | 14 | $3,655 | $255.24 | 55% |
| Samrée | 18 | $3,497 | $375.75 | 31% |
| Zeewolde | 157 | $3,494 | $351.76 | 37% |
| Heers | 30 | $3,405 | $294.43 | 39% |