Dormagen Airbnb Market Analysis 2026: Short Term Rental Data & Vacation Rental Statistics in North Rhine-Westphalia, Germany
Is Airbnb profitable in Dormagen in 2026? Explore comprehensive Airbnb analytics for Dormagen, North Rhine-Westphalia, Germany to uncover income potential. This 2026 STR market report for Dormagen, based on AirROI data from February 2025 to January 2026, reveals key trends in the niche market of 48 active listings.
Whether you're considering an Airbnb investment in Dormagen, optimizing your existing vacation rental, or exploring rental arbitrage opportunities, understanding the Dormagen Airbnb data is crucial. Leveraging the low regulation environment is key to maximizing your short term rental income potential. Let's dive into the specifics.
Key Dormagen Airbnb Performance Metrics Overview
Monthly Airbnb Revenue Variations & Income Potential in Dormagen (2026)
Understanding the monthly revenue variations for Airbnb listings in Dormagen is key to maximizing your short term rental income potential. Seasonality significantly impacts earnings. Our analysis, based on data from the past 12 months, shows that the peak revenue month for STRs in Dormagen is typically March, while January often presents the lowest earnings, highlighting opportunities for strategic pricing adjustments during shoulder and low seasons. Explore the typical Airbnb income in Dormagen across different performance tiers:
- Best-in-class properties (Top 10%) achieve $3,125+ monthly, often utilizing dynamic pricing and superior guest experiences.
- Strong performing properties (Top 25%) earn $2,045 or more, indicating effective management and desirable locations/amenities.
- Typical properties (Median) generate around $1,283 per month, representing the average market performance.
- Entry-level properties (Bottom 25%) see earnings around $766, often with potential for optimization.
Average Monthly Airbnb Earnings Trend in Dormagen
Dormagen Airbnb Occupancy Rate Trends (2026)
Maximize your bookings by understanding the Dormagen STR occupancy trends. Seasonal demand shifts significantly influence how often properties are booked. Typically, Marchsees the highest demand (peak season occupancy), while January experiences the lowest (low season). Effective strategies, like adjusting minimum stays or offering promotions, can boost occupancy during slower periods. Here's how different property tiers perform in Dormagen:
- Best-in-class properties (Top 10%) achieve 79%+ occupancy, indicating high desirability and potentially optimized availability.
- Strong performing properties (Top 25%) maintain 65% or higher occupancy, suggesting good market fit and guest satisfaction.
- Typical properties (Median) have an occupancy rate around 43%.
- Entry-level properties (Bottom 25%) average 24% occupancy, potentially facing higher vacancy.
Average Monthly Occupancy Rate Trend in Dormagen
Average Daily Rate (ADR) Airbnb Trends in Dormagen (2026)
Effective short term rental pricing strategy in Dormagen involves understanding monthly ADR fluctuations. The Average Daily Rate (ADR) for Airbnb in Dormagen typically peaks in November and dips lowest during February. Leveraging Airbnb dynamic pricing tools or strategies based on this seasonality can significantly boost revenue. Here's a look at the typical nightly rates achieved:
- Best-in-class properties (Top 10%) command rates of $219+ per night, often due to premium features or locations.
- Strong performing properties (Top 25%) achieve nightly rates of $126 or more.
- Typical properties (Median) charge around $95 per night.
- Entry-level properties (Bottom 25%) earn around $73 per night.
Average Daily Rate (ADR) Trend by Month in Dormagen
Get Live Dormagen Market Intelligence 👇

Explore Real-time Analytics
Airbnb Seasonality Analysis & Trends in Dormagen (2026)
Peak Season (March, November, October)
- Revenue averages $1,887 per month
- Occupancy rates average 51.2%
- Daily rates average $131
Shoulder Season
- Revenue averages $1,644 per month
- Occupancy maintains around 45.4%
- Daily rates hold near $126
Low Season (January, February, June)
- Revenue drops to average $1,165 per month
- Occupancy decreases to average 38.4%
- Daily rates adjust to average $122
Seasonality Insights for Dormagen
- The Airbnb seasonality in Dormagen shows moderate seasonality with distinct peak and low periods. While the sections above show seasonal averages, it's also insightful to look at the extremes:
- During the high season, the absolute peak month showcases Dormagen's highest earning potential, with monthly revenues capable of climbing to $1,912, occupancy reaching a high of 53.7%, and ADRs peaking at $143.
- Conversely, the slowest single month of the year, typically falling within the low season, marks the market's lowest point. In this month, revenue might dip to $818, occupancy could drop to 27.2%, and ADRs may adjust down to $106.
- Understanding both the seasonal averages and these monthly peaks and troughs in revenue, occupancy, and ADR is crucial for maximizing your Airbnb profit potential in Dormagen.
Seasonal Strategies for Maximizing Profit
- Peak Season: Maximize revenue through premium pricing and potentially longer minimum stays. Ensure high availability.
- Low Season: Offer competitive pricing, special promotions (e.g., extended stay discounts), and flexible cancellation policies. Target off-season travelers like remote workers or budget-conscious guests.
- Shoulder Seasons: Implement dynamic pricing that balances peak and low rates. Target weekend travelers or specific events. Offer slightly more flexible terms than peak season.
- Regularly analyze your own performance against these Dormagen seasonality benchmarks and adjust your pricing and availability strategy accordingly.
Best Areas for Airbnb Investment in Dormagen (2026)
Exploring the top neighborhoods for short-term rentals in Dormagen? This section highlights key areas, outlining why they are attractive for hosts and guests, along with notable local attractions. Consider these locations based on your target guest profile and investment strategy.
| Neighborhood / Area | Why Host Here? (Target Guests & Appeal) | Key Attractions & Landmarks |
|---|---|---|
| City Center | The vibrant heart of Dormagen, with easy access to shops, restaurants, and public transport. Ideal for tourists and business travelers seeking convenience. | Dreikönigshof Park, St. Johannes Baptist Church, Town Hall, Café am Markt, Shopping opportunities |
| Langst-Kierst | A charming residential area that offers a mix of tranquility and accessibility. Close to the Rhine River, attractive for families and nature lovers. | Rhine River paths, Parks and recreational areas, Local eateries |
| Hackhausen | A quiet suburb that provides a peaceful atmosphere while being close to urban amenities. Great for longer stays with a home-like environment. | Local parks, Neighborhood cafes, Community events |
| Delhoven | A small, scenic neighborhood with a local vibe, appealing to visitors who want to experience everyday life in Dormagen. | Natural surroundings, Community centers, Local markets |
| Nievenheim | Ideal for travelers seeking a serene experience with opportunities for outdoor activities like cycling and hiking along the Rhine. | Cycling trails, Fishing spots, Scenic views of the Rhine |
| Zons | A historic district known for its medieval architecture and castle-like structures. A unique attraction for history buffs and cultural enthusiasts. | Zons Castle, Historic city walls, Café culture, Local festivals |
| Dormagen Mitte | An area undergoing development, with new amenities and a growing community. Attractive to investors looking for future growth potential. | Future development projects, Creative spaces, New restaurants |
| Rheinfeld | A quaint neighborhood with an artistic touch, appealing to younger crowds and creatives looking for inspiration and a vibrant community. | Local art studios, Cultural festivals, Community gardens |
Understanding Airbnb License Requirements & STR Laws in Dormagen (2026)
While Dormagen, North Rhine-Westphalia, Germany currently shows low STR regulations, specific Airbnb license requirements might still exist or change. Always verify the latest short term rental regulations and Airbnb license requirements directly with local government authorities for Dormagen to ensure full compliance before hosting.
(Source: AirROI data, 2026, finding no licensed listings among those analyzed)
Top Performing Airbnb Properties in Dormagen (2026)
Benchmark your potential! Explore examples of top-performing Airbnb properties in Dormagenbased on Trailing Twelve Month (TTM) revenue. Analyze their characteristics, revenue, occupancy rate, and ADR to understand what drives success in this market.

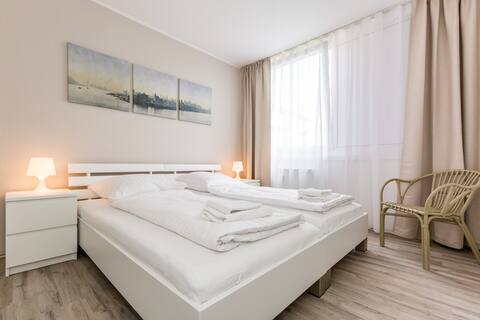
Town villa in Dormagen
Entire Place • 2 bedrooms

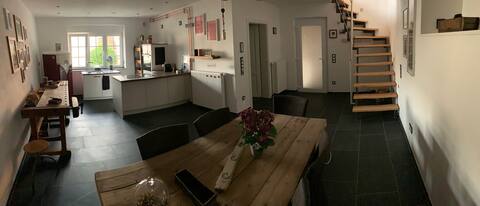
The old forester's house
Entire Place • 4 bedrooms

ModernCountryhouse Dormagen Zons rhine 30min fair
Entire Place • 3 bedrooms
DM2 bright apartment in Dormagen *balcony*
Entire Place • 2 bedrooms

Light-flooded apartment with roof terrace
Entire Place • 1 bedroom
There's love in here !
Entire Place • 1 bedroom
Note: Performance varies based on location, size, amenities, seasonality, and management quality. Data reflects the past 12 months.
Top Performing Airbnb Hosts in Dormagen (2026)
Learn from the best! This table showcases top-performing Airbnb hosts in Dormagen based on the number of properties managed and estimated total revenue over the past year. Analyze their scale and performance metrics.
| Host Name | Properties | Grossing Revenue | Stay Reviews | Avg Rating |
|---|---|---|---|---|
| 姜 | 6 | $82,078 | 112 | 4.62/5.0 |
| APC Grundbesitzverwaltung GmbH | 3 | $60,864 | 11 | 4.26/5.0 |
| Andrea | 1 | $57,158 | 76 | 4.96/5.0 |
| Maren | 1 | $47,026 | 33 | 4.79/5.0 |
| Michael | 1 | $37,899 | 153 | 4.95/5.0 |
| Tobias Und Nicole | 2 | $30,708 | 22 | 4.82/5.0 |
| Bettina | 1 | $27,969 | 82 | 4.96/5.0 |
| Martin | 1 | $23,447 | 34 | 4.97/5.0 |
| Alexander | 1 | $23,189 | 24 | 4.92/5.0 |
| Helmut | 1 | $22,820 | 108 | 4.96/5.0 |
Analyzing the strategies of top hosts, such as their property selection, pricing, and guest communication, can offer valuable lessons for optimizing your own Airbnb operations in Dormagen.
Dive Deeper: Advanced Dormagen STR Market Data (2026)
Ready to unlock more insights? AirROI provides access to advanced metrics and comprehensive Airbnb data for Dormagen. Explore detailed analytics beyond this report to refine your investment strategy, optimize pricing, and maximize your vacation rental profits.
Explore Advanced MetricsDormagen Short-Term Rental Market Composition (2026): Property & Room Types
Room Type Distribution
Property Type Distribution
Market Composition Insights for Dormagen
- The Dormagen Airbnb market composition is heavily skewed towards Entire Home/Apt listings, which make up 70.8% of the 48 active rentals. This indicates strong guest preference for privacy and space.
- Looking at the property type distribution in Dormagen, Apartment/Condo properties are the most common (62.5%), reflecting the local real estate landscape.
- The presence of 22.9% Hotel/Boutique listings indicates integration with traditional hospitality.
Dormagen Airbnb Room Capacity Analysis (2026): Bedroom Distribution
Distribution of Listings by Number of Bedrooms
Room Capacity Insights for Dormagen
- The dominant room capacity in Dormagen is 1 bedroom listings, making up 45.8% of the market. This suggests a strong demand for properties suitable for couples or solo travelers.
- Together, 1 bedroom and 2 bedrooms properties represent 68.7% of the active Airbnb listings in Dormagen, indicating a high concentration in these sizes.
- A significant 20.8% of listings offer 3+ bedrooms, catering to larger groups and families seeking more space in Dormagen.
Dormagen Vacation Rental Guest Capacity Trends (2026)
Distribution of Listings by Guest Capacity
Guest Capacity Insights for Dormagen
- The most common guest capacity trend in Dormagen vacation rentals is listings accommodating 2 guests (31.3%). This suggests the primary traveler segment is likely couples or solo travelers.
- Properties designed for 2 guests and 4 guests dominate the Dormagen STR market, accounting for 52.1% of listings.
- 18.8% of properties accommodate 6+ guests, serving the market segment for larger families or group travel in Dormagen.
- On average, properties in Dormagen are equipped to host 3.3 guests.
Dormagen Airbnb Booking Patterns (2026): Available vs. Booked Days
Available Days Distribution
Booked Days Distribution
Booking Pattern Insights for Dormagen
- The most common availability pattern in Dormagen falls within the 271-366 days range, representing 35.4% of listings. This suggests many properties have significant open periods on their calendars.
- Approximately 70.8% of listings show high availability (181+ days open annually), indicating potential for increased bookings or specific owner usage patterns.
- For booked days, the 91-180 days range is most frequent in Dormagen (33.3%), reflecting common guest stay durations or potential owner blocking patterns.
- A notable 31.2% of properties secure long booking periods (181+ days booked per year), highlighting successful long-term rental strategies or significant owner usage.
Dormagen Airbnb Minimum Stay Requirements Analysis
Distribution of Listings by Minimum Night Requirement
1 Night
15 listings
31.3% of total
2 Nights
8 listings
16.7% of total
3 Nights
2 listings
4.2% of total
4-6 Nights
7 listings
14.6% of total
7-29 Nights
6 listings
12.5% of total
30+ Nights
10 listings
20.8% of total
Key Insights
- The most prevalent minimum stay requirement in Dormagen is 1 Night, adopted by 31.3% of listings. This highlights the market's preference for shorter, flexible bookings.
- A significant segment (20.8%) caters to monthly stays (30+ nights) in Dormagen, pointing to opportunities in the extended-stay market.
Recommendations
- Align with the market by considering a 1 Night minimum stay, as 31.3% of Dormagen hosts use this setting.
- Explore offering discounts for stays of 30+ nights to attract the 20.8% of the market seeking extended stays.
- Adjust minimum nights based on seasonality – potentially shorter during low season and longer during peak demand periods in Dormagen.
Dormagen Airbnb Cancellation Policy Trends Analysis (2026)
Refundable
1 listings
2.1% of total
Flexible
17 listings
35.4% of total
Moderate
19 listings
39.6% of total
Firm
10 listings
20.8% of total
Strict
1 listings
2.1% of total
Cancellation Policy Insights for Dormagen
- The prevailing Airbnb cancellation policy trend in Dormagen is Moderate, used by 39.6% of listings.
- The market strongly favors guest-friendly terms, with 75.0% of listings offering Flexible or Moderate policies. This suggests guests in Dormagen may expect booking flexibility.
- Strict cancellation policies are quite rare (2.1%), potentially making listings with this policy less competitive unless justified by high demand or property type.
Recommendations for Hosts
- Consider adopting a Moderate policy to align with the 39.6% market standard in Dormagen.
- Using a Strict policy might deter some guests, as only 2.1% of listings use it. Evaluate if potential revenue protection outweighs possible lower booking rates.
- Regularly review your cancellation policy against competitors and market demand shifts in Dormagen.
Dormagen STR Booking Lead Time Analysis (2026)
Average Booking Lead Time by Month
Booking Lead Time Insights for Dormagen
- The overall average booking lead time for vacation rentals in Dormagen is 50 days.
- Guests book furthest in advance for stays during October (average 77 days), likely coinciding with peak travel demand or local events.
- The shortest booking windows occur for stays in February (average 25 days), indicating more last-minute travel plans during this time.
- Seasonally, Fall (64 days avg.) sees the longest lead times, while Winter (35 days avg.) has the shortest, reflecting typical travel planning cycles.
Recommendations for Hosts
- Use the overall average lead time (50 days) as a baseline for your pricing and availability strategy in Dormagen.
- For October stays, consider implementing length-of-stay discounts or slightly higher rates for bookings made less than 77 days out to capitalize on advance planning.
- Target marketing efforts for the Fall season well in advance (at least 64 days) to capture early planners.
- Monitor your own booking lead times against these Dormagen averages to identify opportunities for dynamic pricing adjustments.
Popular & Essential Airbnb Amenities in Dormagen (2026)
Amenity Prevalence
Amenity Insights for Dormagen
- Essential amenities in Dormagen that guests expect include: Wifi, Heating. Lacking these (any) could significantly impact bookings.
- Popular amenities like Smoke alarm, TV, Refrigerator are common but not universal. Offering these can provide a competitive edge.
Recommendations for Hosts
- Ensure your listing includes all essential amenities for Dormagen: Wifi, Heating.
- Consider adding popular differentiators like Smoke alarm or TV to increase appeal.
- Highlight unique or less common amenities you offer (e.g., hot tub, dedicated workspace, EV charger) in your listing description and photos.
- Regularly check competitor amenities in Dormagen to stay competitive.
Dormagen Airbnb Guest Demographics & Profile Analysis (2026)
Guest Profile Summary for Dormagen
- The typical guest profile for Airbnb in Dormagen consists of a mix of domestic (56%) and international guests, often arriving from nearby Frankfurt, typically belonging to the Post-2000s (Gen Z/Alpha) group (50%), primarily speaking English or German.
- Domestic travelers account for 56.3% of guests.
- Key international markets include Germany (56.3%) and Netherlands (8.2%).
- Top languages spoken are English (38.7%) followed by German (28.7%).
- A significant demographic segment is the Post-2000s (Gen Z/Alpha) group, representing 50% of guests.
Recommendations for Hosts
- Balance marketing efforts between domestic and international channels based on the guest mix.
- Tailor amenities and listing descriptions to appeal to the dominant Post-2000s (Gen Z/Alpha) demographic (e.g., highlight fast WiFi, smart home features, local guides).
- Highlight unique local experiences or amenities relevant to the primary guest profile.
- Consider seasonal promotions aligned with peak travel times for key origin markets.
Nearby Short-Term Rental Market Comparison
How does the Dormagen Airbnb market stack up against its neighbors? Compare key performance metrics like average monthly revenue, ADR, and occupancy rates in surrounding areas to understand the broader regional STR landscape.
| Market | Active Properties | Monthly Revenue | Daily Rate | Avg. Occupancy |
|---|---|---|---|---|
| Losser | 10 | $7,954 | $1060.34 | 27% |
| Haghorst | 11 | $5,995 | $480.40 | 40% |
| Baarlo | 20 | $5,442 | $332.61 | 51% |
| Wellin | 12 | $4,365 | $446.64 | 42% |
| Aubel | 26 | $4,191 | $283.88 | 46% |
| Bertogne | 26 | $3,839 | $325.90 | 42% |
| Kortenhoef | 14 | $3,655 | $255.24 | 55% |
| Samrée | 18 | $3,497 | $375.75 | 31% |
| Zeewolde | 157 | $3,494 | $351.76 | 37% |
| Heers | 30 | $3,405 | $294.43 | 39% |