Bottrop Airbnb Market Analysis 2026: Short Term Rental Data & Vacation Rental Statistics in North Rhine-Westphalia, Germany
Is Airbnb profitable in Bottrop in 2026? Explore comprehensive Airbnb analytics for Bottrop, North Rhine-Westphalia, Germany to uncover income potential. This 2026 STR market report for Bottrop, based on AirROI data from February 2025 to January 2026, reveals key trends in the niche market of 44 active listings.
Whether you're considering an Airbnb investment in Bottrop, optimizing your existing vacation rental, or exploring rental arbitrage opportunities, understanding the Bottrop Airbnb data is crucial. Leveraging the low regulation environment is key to maximizing your short term rental income potential. Let's dive into the specifics.
Key Bottrop Airbnb Performance Metrics Overview
Monthly Airbnb Revenue Variations & Income Potential in Bottrop (2026)
Understanding the monthly revenue variations for Airbnb listings in Bottrop is key to maximizing your short term rental income potential. Seasonality significantly impacts earnings. Our analysis, based on data from the past 12 months, shows that the peak revenue month for STRs in Bottrop is typically October, while January often presents the lowest earnings, highlighting opportunities for strategic pricing adjustments during shoulder and low seasons. Explore the typical Airbnb income in Bottrop across different performance tiers:
- Best-in-class properties (Top 10%) achieve $2,715+ monthly, often utilizing dynamic pricing and superior guest experiences.
- Strong performing properties (Top 25%) earn $1,833 or more, indicating effective management and desirable locations/amenities.
- Typical properties (Median) generate around $1,197 per month, representing the average market performance.
- Entry-level properties (Bottom 25%) see earnings around $596, often with potential for optimization.
Average Monthly Airbnb Earnings Trend in Bottrop
Bottrop Airbnb Occupancy Rate Trends (2026)
Maximize your bookings by understanding the Bottrop STR occupancy trends. Seasonal demand shifts significantly influence how often properties are booked. Typically, Augustsees the highest demand (peak season occupancy), while January experiences the lowest (low season). Effective strategies, like adjusting minimum stays or offering promotions, can boost occupancy during slower periods. Here's how different property tiers perform in Bottrop:
- Best-in-class properties (Top 10%) achieve 86%+ occupancy, indicating high desirability and potentially optimized availability.
- Strong performing properties (Top 25%) maintain 71% or higher occupancy, suggesting good market fit and guest satisfaction.
- Typical properties (Median) have an occupancy rate around 48%.
- Entry-level properties (Bottom 25%) average 26% occupancy, potentially facing higher vacancy.
Average Monthly Occupancy Rate Trend in Bottrop
Average Daily Rate (ADR) Airbnb Trends in Bottrop (2026)
Effective short term rental pricing strategy in Bottrop involves understanding monthly ADR fluctuations. The Average Daily Rate (ADR) for Airbnb in Bottrop typically peaks in October and dips lowest during February. Leveraging Airbnb dynamic pricing tools or strategies based on this seasonality can significantly boost revenue. Here's a look at the typical nightly rates achieved:
- Best-in-class properties (Top 10%) command rates of $142+ per night, often due to premium features or locations.
- Strong performing properties (Top 25%) achieve nightly rates of $98 or more.
- Typical properties (Median) charge around $76 per night.
- Entry-level properties (Bottom 25%) earn around $59 per night.
Average Daily Rate (ADR) Trend by Month in Bottrop
Get Live Bottrop Market Intelligence 👇

Explore Real-time Analytics
Airbnb Seasonality Analysis & Trends in Bottrop (2026)
Peak Season (October, June, August)
- Revenue averages $1,699 per month
- Occupancy rates average 57.1%
- Daily rates average $92
Shoulder Season
- Revenue averages $1,399 per month
- Occupancy maintains around 48.6%
- Daily rates hold near $89
Low Season (January, February, April)
- Revenue drops to average $1,027 per month
- Occupancy decreases to average 41.3%
- Daily rates adjust to average $83
Seasonality Insights for Bottrop
- The Airbnb seasonality in Bottrop shows moderate seasonality with distinct peak and low periods. While the sections above show seasonal averages, it's also insightful to look at the extremes:
- During the high season, the absolute peak month showcases Bottrop's highest earning potential, with monthly revenues capable of climbing to $1,776, occupancy reaching a high of 57.6%, and ADRs peaking at $94.
- Conversely, the slowest single month of the year, typically falling within the low season, marks the market's lowest point. In this month, revenue might dip to $910, occupancy could drop to 34.6%, and ADRs may adjust down to $79.
- Understanding both the seasonal averages and these monthly peaks and troughs in revenue, occupancy, and ADR is crucial for maximizing your Airbnb profit potential in Bottrop.
Seasonal Strategies for Maximizing Profit
- Peak Season: Maximize revenue through premium pricing and potentially longer minimum stays. Ensure high availability.
- Low Season: Offer competitive pricing, special promotions (e.g., extended stay discounts), and flexible cancellation policies. Target off-season travelers like remote workers or budget-conscious guests.
- Shoulder Seasons: Implement dynamic pricing that balances peak and low rates. Target weekend travelers or specific events. Offer slightly more flexible terms than peak season.
- Regularly analyze your own performance against these Bottrop seasonality benchmarks and adjust your pricing and availability strategy accordingly.
Best Areas for Airbnb Investment in Bottrop (2026)
Exploring the top neighborhoods for short-term rentals in Bottrop? This section highlights key areas, outlining why they are attractive for hosts and guests, along with notable local attractions. Consider these locations based on your target guest profile and investment strategy.
| Neighborhood / Area | Why Host Here? (Target Guests & Appeal) | Key Attractions & Landmarks |
|---|---|---|
| City Center | The vibrant heart of Bottrop, offering easy access to shopping, dining, and cultural attractions. Ideal for tourists needing convenience and amenities nearby. | Bottrop Town Hall, Kulturzentrum, CinemaxX Bottrop, Shopping streets, Marktplatz Bottrop |
| Nordrhein-Westfalen Park | A unique green space featuring gardens, playgrounds, and festive events, appealing to families and nature lovers. | Nordrhein-Westfalen Park, Playgrounds, Event spaces, Walking trails, Picnic areas |
| Zeche Prosper Haniel | A historical site that showcases Bottrop's coal mining heritage, attracting visitors interested in history and industrial culture. | Zeche Prosper Haniel, Mining Museum, Historical exhibits, Guided tours |
| Kraftwerk Bottrop | An impressive power plant attracting visitors interested in science and technology, as well as local visitors. | Kraftwerk Bottrop, Educational tours, Power plant exhibitions |
| Bottrop-Boy | A quiet, residential neighborhood offering a local experience with parks and small shops, ideal for longer stays. | Parks, Local shops, Community events |
| Bottrop-Kirchhellen | This area features a mix of rural charm and urban convenience, making it attractive for both tourists and locals. | Outdoor activities, Park landscapes, Local markets |
| Bottrop-Welheim | Known for its peaceful surroundings and access to nature, ideal for guests looking to escape the city life. | Nature trails, Parks, Tranquil environment |
| Oberhausener Strasse | A busy street with various dining and shopping options, perfect for guests looking to experience local life. | Restaurants, Cafes, Local shops |
Understanding Airbnb License Requirements & STR Laws in Bottrop (2026)
While Bottrop, North Rhine-Westphalia, Germany currently shows low STR regulations, specific Airbnb license requirements might still exist or change. Always verify the latest short term rental regulations and Airbnb license requirements directly with local government authorities for Bottrop to ensure full compliance before hosting.
(Source: AirROI data, 2026, finding no licensed listings among those analyzed)
Top Performing Airbnb Properties in Bottrop (2026)
Benchmark your potential! Explore examples of top-performing Airbnb properties in Bottropbased on Trailing Twelve Month (TTM) revenue. Analyze their characteristics, revenue, occupancy rate, and ADR to understand what drives success in this market.
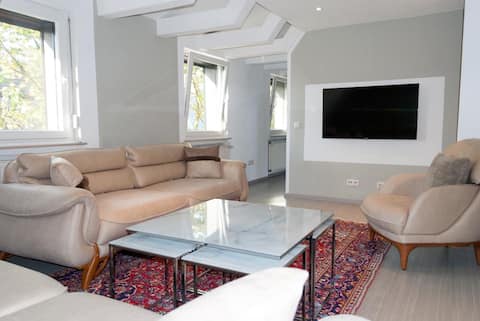
Under the stars
Entire Place • 2 bedrooms
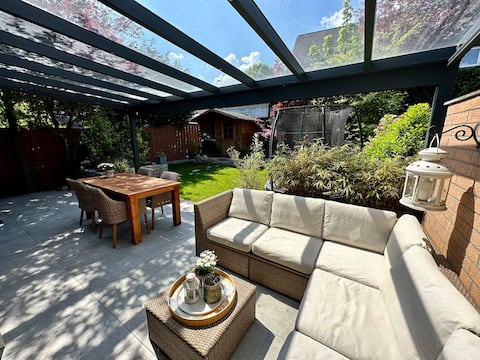
Renovated semi-detached house in a prime location
Entire Place • 2 bedrooms

Quiet, green and central living in the Zechenhaus
Entire Place • 3 bedrooms
The house in the woods
Entire Place • 3 bedrooms

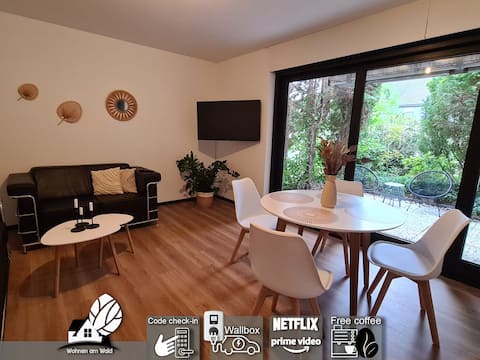
MiLPAU: Design-Apartment - Zentrum - Netflix
Entire Place • 1 bedroom

Cozy apartment in Bottrop-Stadtwald
Entire Place • 1 bedroom
Note: Performance varies based on location, size, amenities, seasonality, and management quality. Data reflects the past 12 months.
Top Performing Airbnb Hosts in Bottrop (2026)
Learn from the best! This table showcases top-performing Airbnb hosts in Bottrop based on the number of properties managed and estimated total revenue over the past year. Analyze their scale and performance metrics.
| Host Name | Properties | Grossing Revenue | Stay Reviews | Avg Rating |
|---|---|---|---|---|
| Veysel | 2 | $50,169 | 45 | 4.74/5.0 |
| Christopher | 3 | $48,718 | 90 | 4.75/5.0 |
| Annette | 1 | $38,288 | 53 | 4.94/5.0 |
| Friedhelm Und Gabi | 2 | $31,908 | 631 | 4.93/5.0 |
| Nele | 1 | $27,837 | 62 | 4.85/5.0 |
| Tim | 1 | $26,469 | 10 | 5.00/5.0 |
| Iris | 2 | $25,788 | 225 | 5.00/5.0 |
| Julia | 1 | $24,965 | 100 | 5.00/5.0 |
| Angelina | 1 | $22,452 | 23 | 5.00/5.0 |
| Petra | 1 | $19,256 | 212 | 4.97/5.0 |
Analyzing the strategies of top hosts, such as their property selection, pricing, and guest communication, can offer valuable lessons for optimizing your own Airbnb operations in Bottrop.
Dive Deeper: Advanced Bottrop STR Market Data (2026)
Ready to unlock more insights? AirROI provides access to advanced metrics and comprehensive Airbnb data for Bottrop. Explore detailed analytics beyond this report to refine your investment strategy, optimize pricing, and maximize your vacation rental profits.
Explore Advanced MetricsBottrop Short-Term Rental Market Composition (2026): Property & Room Types
Room Type Distribution
Property Type Distribution
Market Composition Insights for Bottrop
- The Bottrop Airbnb market composition is heavily skewed towards Entire Home/Apt listings, which make up 93.2% of the 44 active rentals. This indicates strong guest preference for privacy and space.
- Looking at the property type distribution in Bottrop, Apartment/Condo properties are the most common (88.6%), reflecting the local real estate landscape.
Bottrop Airbnb Room Capacity Analysis (2026): Bedroom Distribution
Distribution of Listings by Number of Bedrooms
Room Capacity Insights for Bottrop
- The dominant room capacity in Bottrop is 1 bedroom listings, making up 54.5% of the market. This suggests a strong demand for properties suitable for couples or solo travelers.
- Together, 1 bedroom and 2 bedrooms properties represent 84.0% of the active Airbnb listings in Bottrop, indicating a high concentration in these sizes.
- With over half the market (54.5%) consisting of studios or 1-bedroom units, Bottrop is particularly well-suited for individuals or couples.
- Listings with 3+ bedrooms (6.8%) represent a smaller niche, potentially indicating an underserved market for larger group accommodations in Bottrop.
Bottrop Vacation Rental Guest Capacity Trends (2026)
Distribution of Listings by Guest Capacity
Guest Capacity Insights for Bottrop
- The most common guest capacity trend in Bottrop vacation rentals is listings accommodating 4 guests (34.1%). This suggests the primary traveler segment is likely small families or groups.
- Properties designed for 4 guests and 2 guests dominate the Bottrop STR market, accounting for 61.4% of listings.
- On average, properties in Bottrop are equipped to host 3.3 guests.
Bottrop Airbnb Booking Patterns (2026): Available vs. Booked Days
Available Days Distribution
Booked Days Distribution
Booking Pattern Insights for Bottrop
- The most common availability pattern in Bottrop falls within the 181-270 days range, representing 36.4% of listings. This suggests many properties have significant open periods on their calendars.
- Approximately 70.5% of listings show high availability (181+ days open annually), indicating potential for increased bookings or specific owner usage patterns.
- For booked days, the 91-180 days range is most frequent in Bottrop (31.8%), reflecting common guest stay durations or potential owner blocking patterns.
- A notable 34.1% of properties secure long booking periods (181+ days booked per year), highlighting successful long-term rental strategies or significant owner usage.
Bottrop Airbnb Minimum Stay Requirements Analysis
Distribution of Listings by Minimum Night Requirement
1 Night
12 listings
27.3% of total
2 Nights
12 listings
27.3% of total
3 Nights
6 listings
13.6% of total
4-6 Nights
2 listings
4.5% of total
7-29 Nights
3 listings
6.8% of total
30+ Nights
9 listings
20.5% of total
Key Insights
- The most prevalent minimum stay requirement in Bottrop is 1 Night, adopted by 27.3% of listings. This highlights the market's preference for shorter, flexible bookings.
- A significant segment (20.5%) caters to monthly stays (30+ nights) in Bottrop, pointing to opportunities in the extended-stay market.
Recommendations
- Align with the market by considering a 1 Night minimum stay, as 27.3% of Bottrop hosts use this setting.
- If feasible, allowing 1-night stays, especially midweek or during low season, could capture last-minute bookings, as only 27.3% currently do.
- Explore offering discounts for stays of 30+ nights to attract the 20.5% of the market seeking extended stays.
- Adjust minimum nights based on seasonality – potentially shorter during low season and longer during peak demand periods in Bottrop.
Bottrop Airbnb Cancellation Policy Trends Analysis (2026)
Flexible
14 listings
31.8% of total
Moderate
21 listings
47.7% of total
Firm
5 listings
11.4% of total
Strict
4 listings
9.1% of total
Cancellation Policy Insights for Bottrop
- The prevailing Airbnb cancellation policy trend in Bottrop is Moderate, used by 47.7% of listings.
- The market strongly favors guest-friendly terms, with 79.5% of listings offering Flexible or Moderate policies. This suggests guests in Bottrop may expect booking flexibility.
- Strict cancellation policies are quite rare (9.1%), potentially making listings with this policy less competitive unless justified by high demand or property type.
Recommendations for Hosts
- Consider adopting a Moderate policy to align with the 47.7% market standard in Bottrop.
- Using a Strict policy might deter some guests, as only 9.1% of listings use it. Evaluate if potential revenue protection outweighs possible lower booking rates.
- Regularly review your cancellation policy against competitors and market demand shifts in Bottrop.
Bottrop STR Booking Lead Time Analysis (2026)
Average Booking Lead Time by Month
Booking Lead Time Insights for Bottrop
- The overall average booking lead time for vacation rentals in Bottrop is 51 days.
- Guests book furthest in advance for stays during June (average 81 days), likely coinciding with peak travel demand or local events.
- The shortest booking windows occur for stays in January (average 22 days), indicating more last-minute travel plans during this time.
- Seasonally, Summer (65 days avg.) sees the longest lead times, while Winter (27 days avg.) has the shortest, reflecting typical travel planning cycles.
Recommendations for Hosts
- Use the overall average lead time (51 days) as a baseline for your pricing and availability strategy in Bottrop.
- For June stays, consider implementing length-of-stay discounts or slightly higher rates for bookings made less than 81 days out to capitalize on advance planning.
- Target marketing efforts for the Summer season well in advance (at least 65 days) to capture early planners.
- Monitor your own booking lead times against these Bottrop averages to identify opportunities for dynamic pricing adjustments.
Popular & Essential Airbnb Amenities in Bottrop (2026)
Amenity Prevalence
Amenity Insights for Bottrop
- Essential amenities in Bottrop that guests expect include: Wifi, Kitchen, Smoke alarm, Heating, Refrigerator, TV. Lacking these (any) could significantly impact bookings.
- Popular amenities like Dishes and silverware, Hot water, Essentials are common but not universal. Offering these can provide a competitive edge.
Recommendations for Hosts
- Ensure your listing includes all essential amenities for Bottrop: Wifi, Kitchen, Smoke alarm, Heating, Refrigerator, TV.
- Prioritize adding missing essentials: Wifi, Kitchen, Smoke alarm, Heating, Refrigerator, TV.
- Consider adding popular differentiators like Dishes and silverware or Hot water to increase appeal.
- Highlight unique or less common amenities you offer (e.g., hot tub, dedicated workspace, EV charger) in your listing description and photos.
- Regularly check competitor amenities in Bottrop to stay competitive.
Bottrop Airbnb Guest Demographics & Profile Analysis (2026)
Guest Profile Summary for Bottrop
- The typical guest profile for Airbnb in Bottrop consists of primarily domestic travelers (68%), often arriving from nearby Berlin, typically belonging to the Post-2000s (Gen Z/Alpha) group (50%), primarily speaking English or German.
- Domestic travelers account for 68.1% of guests.
- Key international markets include Germany (68.1%) and Netherlands (13%).
- Top languages spoken are English (38.1%) followed by German (32.4%).
- A significant demographic segment is the Post-2000s (Gen Z/Alpha) group, representing 50% of guests.
Recommendations for Hosts
- Target domestic marketing efforts towards travelers from Berlin and Cologne.
- Tailor amenities and listing descriptions to appeal to the dominant Post-2000s (Gen Z/Alpha) demographic (e.g., highlight fast WiFi, smart home features, local guides).
- Highlight unique local experiences or amenities relevant to the primary guest profile.
- Consider seasonal promotions aligned with peak travel times for key origin markets.
Nearby Short-Term Rental Market Comparison
How does the Bottrop Airbnb market stack up against its neighbors? Compare key performance metrics like average monthly revenue, ADR, and occupancy rates in surrounding areas to understand the broader regional STR landscape.
| Market | Active Properties | Monthly Revenue | Daily Rate | Avg. Occupancy |
|---|---|---|---|---|
| Losser | 10 | $7,954 | $1060.34 | 27% |
| Haghorst | 11 | $5,995 | $480.40 | 40% |
| Baarlo | 20 | $5,442 | $332.61 | 51% |
| Wellin | 12 | $4,365 | $446.64 | 42% |
| Aubel | 26 | $4,191 | $283.88 | 46% |
| Bertogne | 26 | $3,839 | $325.90 | 42% |
| Kortenhoef | 14 | $3,655 | $255.24 | 55% |
| Samrée | 18 | $3,497 | $375.75 | 31% |
| Zeewolde | 157 | $3,494 | $351.76 | 37% |
| Heers | 30 | $3,405 | $294.43 | 39% |