Zinnowitz Airbnb Market Analysis 2026: Short Term Rental Data & Vacation Rental Statistics in Mecklenburg-Vorpommern, Germany
Is Airbnb profitable in Zinnowitz in 2026? Explore comprehensive Airbnb analytics for Zinnowitz, Mecklenburg-Vorpommern, Germany to uncover income potential. This 2026 STR market report for Zinnowitz, based on AirROI data from February 2025 to January 2026, reveals key trends in the niche market of 164 active listings.
Whether you're considering an Airbnb investment in Zinnowitz, optimizing your existing vacation rental, or exploring rental arbitrage opportunities, understanding the Zinnowitz Airbnb data is crucial. Leveraging the low regulation environment is key to maximizing your short term rental income potential. Let's dive into the specifics.
Key Zinnowitz Airbnb Performance Metrics Overview
Monthly Airbnb Revenue Variations & Income Potential in Zinnowitz (2026)
Understanding the monthly revenue variations for Airbnb listings in Zinnowitz is key to maximizing your short term rental income potential. Seasonality significantly impacts earnings. Our analysis, based on data from the past 12 months, shows that the peak revenue month for STRs in Zinnowitz is typically July, while January often presents the lowest earnings, highlighting opportunities for strategic pricing adjustments during shoulder and low seasons. Explore the typical Airbnb income in Zinnowitz across different performance tiers:
- Best-in-class properties (Top 10%) achieve $2,583+ monthly, often utilizing dynamic pricing and superior guest experiences.
- Strong performing properties (Top 25%) earn $1,770 or more, indicating effective management and desirable locations/amenities.
- Typical properties (Median) generate around $1,051 per month, representing the average market performance.
- Entry-level properties (Bottom 25%) see earnings around $575, often with potential for optimization.
Average Monthly Airbnb Earnings Trend in Zinnowitz
Zinnowitz Airbnb Occupancy Rate Trends (2026)
Maximize your bookings by understanding the Zinnowitz STR occupancy trends. Seasonal demand shifts significantly influence how often properties are booked. Typically, Augustsees the highest demand (peak season occupancy), while January experiences the lowest (low season). Effective strategies, like adjusting minimum stays or offering promotions, can boost occupancy during slower periods. Here's how different property tiers perform in Zinnowitz:
- Best-in-class properties (Top 10%) achieve 63%+ occupancy, indicating high desirability and potentially optimized availability.
- Strong performing properties (Top 25%) maintain 47% or higher occupancy, suggesting good market fit and guest satisfaction.
- Typical properties (Median) have an occupancy rate around 30%.
- Entry-level properties (Bottom 25%) average 14% occupancy, potentially facing higher vacancy.
Average Monthly Occupancy Rate Trend in Zinnowitz
Average Daily Rate (ADR) Airbnb Trends in Zinnowitz (2026)
Effective short term rental pricing strategy in Zinnowitz involves understanding monthly ADR fluctuations. The Average Daily Rate (ADR) for Airbnb in Zinnowitz typically peaks in August and dips lowest during February. Leveraging Airbnb dynamic pricing tools or strategies based on this seasonality can significantly boost revenue. Here's a look at the typical nightly rates achieved:
- Best-in-class properties (Top 10%) command rates of $201+ per night, often due to premium features or locations.
- Strong performing properties (Top 25%) achieve nightly rates of $154 or more.
- Typical properties (Median) charge around $125 per night.
- Entry-level properties (Bottom 25%) earn around $101 per night.
Average Daily Rate (ADR) Trend by Month in Zinnowitz
Get Live Zinnowitz Market Intelligence 👇

Explore Real-time Analytics
Airbnb Seasonality Analysis & Trends in Zinnowitz (2026)
Peak Season (July, August, June)
- Revenue averages $2,326 per month
- Occupancy rates average 52.1%
- Daily rates average $150
Shoulder Season
- Revenue averages $1,233 per month
- Occupancy maintains around 31.6%
- Daily rates hold near $132
Low Season (January, November, December)
- Revenue drops to average $660 per month
- Occupancy decreases to average 15.6%
- Daily rates adjust to average $140
Seasonality Insights for Zinnowitz
- The Airbnb seasonality in Zinnowitz shows highly seasonal trends requiring careful strategy. While the sections above show seasonal averages, it's also insightful to look at the extremes:
- During the high season, the absolute peak month showcases Zinnowitz's highest earning potential, with monthly revenues capable of climbing to $2,658, occupancy reaching a high of 58.8%, and ADRs peaking at $154.
- Conversely, the slowest single month of the year, typically falling within the low season, marks the market's lowest point. In this month, revenue might dip to $524, occupancy could drop to 12.0%, and ADRs may adjust down to $119.
- Understanding both the seasonal averages and these monthly peaks and troughs in revenue, occupancy, and ADR is crucial for maximizing your Airbnb profit potential in Zinnowitz.
Seasonal Strategies for Maximizing Profit
- Peak Season: Maximize revenue through premium pricing and potentially longer minimum stays. Ensure high availability.
- Low Season: Offer competitive pricing, special promotions (e.g., extended stay discounts), and flexible cancellation policies. Target off-season travelers like remote workers or budget-conscious guests.
- Shoulder Seasons: Implement dynamic pricing that balances peak and low rates. Target weekend travelers or specific events. Offer slightly more flexible terms than peak season.
- Regularly analyze your own performance against these Zinnowitz seasonality benchmarks and adjust your pricing and availability strategy accordingly.
Best Areas for Airbnb Investment in Zinnowitz (2026)
Exploring the top neighborhoods for short-term rentals in Zinnowitz? This section highlights key areas, outlining why they are attractive for hosts and guests, along with notable local attractions. Consider these locations based on your target guest profile and investment strategy.
| Neighborhood / Area | Why Host Here? (Target Guests & Appeal) | Key Attractions & Landmarks |
|---|---|---|
| Zinnowitz Beach | Zinnowitz Beach is a picturesque area known for its beautiful sandy shores and clear waters, making it a prime destination for vacationers looking to relax and enjoy water activities. | Zinnowitz Beach, Seebrücke Zinnowitz, Wald- und Strandstraße, Zinnowitz Theater, Tropical Islands Resort nearby |
| Zinnowitz Town Center | The town center of Zinnowitz is vibrant with shops, cafes, and local culture, attracting visitors who appreciate convenience and a lively atmosphere. | Kurplatz Zinnowitz, Zinnowitz promenade, Local restaurants and shops, Events at the town square, Cafes with outdoor seating |
| Usedom Island | Known for its stunning natural landscapes and charming seaside villages, Usedom Island attracts nature lovers and those looking for a quiet retreat away from the crowds. | Usedom Coast, Nature reserves, Cycle paths, Secluded beaches, Historic lighthouses |
| Heringsdorf | Adjacent to Zinnowitz, Heringsdorf is famous for its elegant old-world charm and beautiful pier, appealing to those looking for a classic seaside experience. | Heringsdorf Pier, Promenade, Spa facilities, Historical villas, Fine dining options |
| Ahlbeck | Ahlbeck is known for its grand architecture and historic charm, making it appealing to families and history enthusiasts interested in coastal heritage. | Ahlbeck Pier, Historical architecture, Beach promenades, Local ice cream shops, Family-friendly play areas |
| Koserow | Koserow offers a more laid-back atmosphere, ideal for those looking to escape the busier tourist spots, with beautiful nature trails and tranquil beaches. | Koserow Beach, Nature reserves, Hiking trails, Local taverns, Fishing spots |
| Pudagla | A historical village with a quaint atmosphere, Pudagla is perfect for visitors who enjoy exploring charming settings and nearby nature. | Pudagla Castle, Local museums, Historical landmarks, Countryside views, Paths for walking and cycling |
| Zempin | A peaceful area that offers a family-friendly vibe with a focus on nature and outdoor activities, making it suitable for visitors looking for a more serene getaway. | Zempin Beach, Local markets, Nature walks, Cycling paths, Community events |
Understanding Airbnb License Requirements & STR Laws in Zinnowitz (2026)
While Zinnowitz, Mecklenburg-Vorpommern, Germany currently shows low STR regulations, specific Airbnb license requirements might still exist or change. Always verify the latest short term rental regulations and Airbnb license requirements directly with local government authorities for Zinnowitz to ensure full compliance before hosting.
(Source: AirROI data, 2026, finding no licensed listings among those analyzed)
Top Performing Airbnb Properties in Zinnowitz (2026)
Benchmark your potential! Explore examples of top-performing Airbnb properties in Zinnowitzbased on Trailing Twelve Month (TTM) revenue. Analyze their characteristics, revenue, occupancy rate, and ADR to understand what drives success in this market.
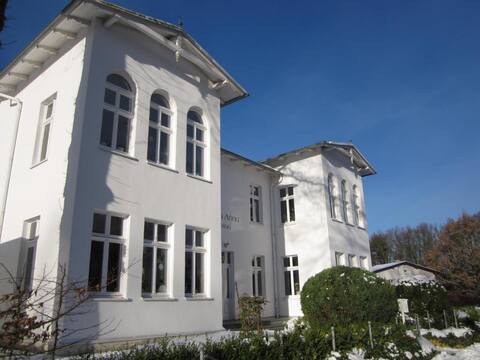
Schwalbe · Villa Anna 80 m² FEWO Schwalbennest in Zinnowitz
Entire Place • 3 bedrooms
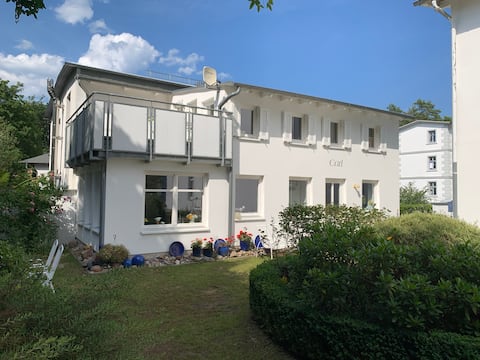
Carl · 90 m² House Carl in the garden of Villa Anna Zinnowitz
Entire Place • 2 bedrooms
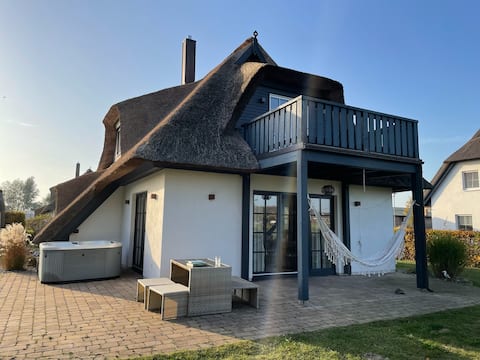
Luxurious thatched house with fireplace and sauna
Entire Place • 3 bedrooms

5-star apartment - 128 m² - 3 bedrooms - for 6 people - ground floor
Entire Place • 3 bedrooms
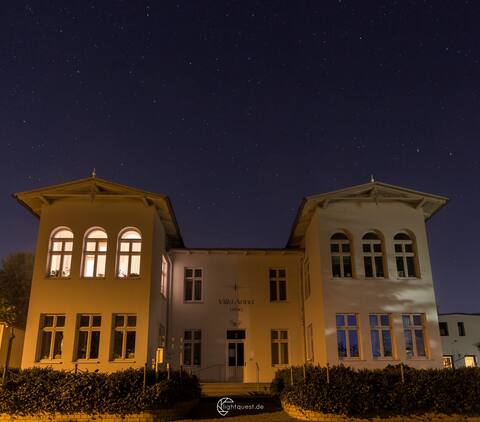
Blitzblank · Villa Anna 80 m² FEWO Blitzblank Zinnowitz / Usedom
Entire Place • 1 bedroom
Vacation home beach and forest
Entire Place • 3 bedrooms
Note: Performance varies based on location, size, amenities, seasonality, and management quality. Data reflects the past 12 months.
Top Performing Airbnb Hosts in Zinnowitz (2026)
Learn from the best! This table showcases top-performing Airbnb hosts in Zinnowitz based on the number of properties managed and estimated total revenue over the past year. Analyze their scale and performance metrics.
| Host Name | Properties | Grossing Revenue | Stay Reviews | Avg Rating |
|---|---|---|---|---|
| Alice - Interhome | 48 | $525,336 | 83 | 4.39/5.0 |
| Angelika | 3 | $145,047 | 51 | 4.47/5.0 |
| Christina | 7 | $75,784 | 384 | 4.79/5.0 |
| Ralf | 4 | $70,714 | 155 | 4.64/5.0 |
| Carsten | 2 | $66,285 | 2 | Not Rated |
| Claudia | 2 | $59,439 | 23 | 4.95/5.0 |
| Emily | 2 | $58,179 | 28 | 4.95/5.0 |
| Yvonne | 6 | $49,529 | 16 | 5.00/5.0 |
| Christian | 1 | $43,019 | 46 | 4.63/5.0 |
| MC Immobilienservice GmbH | 2 | $23,579 | 66 | 4.82/5.0 |
Analyzing the strategies of top hosts, such as their property selection, pricing, and guest communication, can offer valuable lessons for optimizing your own Airbnb operations in Zinnowitz.
Dive Deeper: Advanced Zinnowitz STR Market Data (2026)
Ready to unlock more insights? AirROI provides access to advanced metrics and comprehensive Airbnb data for Zinnowitz. Explore detailed analytics beyond this report to refine your investment strategy, optimize pricing, and maximize your vacation rental profits.
Explore Advanced MetricsZinnowitz Short-Term Rental Market Composition (2026): Property & Room Types
Room Type Distribution
Property Type Distribution
Market Composition Insights for Zinnowitz
- The Zinnowitz Airbnb market composition is heavily skewed towards Entire Home/Apt listings, which make up 99.4% of the 164 active rentals. This indicates strong guest preference for privacy and space.
- Looking at the property type distribution in Zinnowitz, Apartment/Condo properties are the most common (79.9%), reflecting the local real estate landscape.
- Houses represent a significant 18.3% portion, catering likely to families or larger groups.
- Smaller segments like hotel/boutique (combined 1.8%) offer potential for unique stay experiences.
Zinnowitz Airbnb Room Capacity Analysis (2026): Bedroom Distribution
Distribution of Listings by Number of Bedrooms
Room Capacity Insights for Zinnowitz
- The dominant room capacity in Zinnowitz is 1 bedroom listings, making up 54.9% of the market. This suggests a strong demand for properties suitable for couples or solo travelers.
- Together, 1 bedroom and 2 bedrooms properties represent 86.0% of the active Airbnb listings in Zinnowitz, indicating a high concentration in these sizes.
- With over half the market (54.9%) consisting of studios or 1-bedroom units, Zinnowitz is particularly well-suited for individuals or couples.
- Listings with 3+ bedrooms (7.9%) represent a smaller niche, potentially indicating an underserved market for larger group accommodations in Zinnowitz.
Zinnowitz Vacation Rental Guest Capacity Trends (2026)
Distribution of Listings by Guest Capacity
Guest Capacity Insights for Zinnowitz
- The most common guest capacity trend in Zinnowitz vacation rentals is listings accommodating 4 guests (43.3%). This suggests the primary traveler segment is likely small families or groups.
- Properties designed for 4 guests and 2 guests dominate the Zinnowitz STR market, accounting for 62.8% of listings.
- 14.0% of properties accommodate 6+ guests, serving the market segment for larger families or group travel in Zinnowitz.
- On average, properties in Zinnowitz are equipped to host 3.8 guests.
Zinnowitz Airbnb Booking Patterns (2026): Available vs. Booked Days
Available Days Distribution
Booked Days Distribution
Booking Pattern Insights for Zinnowitz
- The most common availability pattern in Zinnowitz falls within the 271-366 days range, representing 67.7% of listings. This suggests many properties have significant open periods on their calendars.
- Approximately 97.6% of listings show high availability (181+ days open annually), indicating potential for increased bookings or specific owner usage patterns.
- For booked days, the 31-90 days range is most frequent in Zinnowitz (34.1%), reflecting common guest stay durations or potential owner blocking patterns.
- A notable 2.4% of properties secure long booking periods (181+ days booked per year), highlighting successful long-term rental strategies or significant owner usage.
Zinnowitz Airbnb Minimum Stay Requirements Analysis
Distribution of Listings by Minimum Night Requirement
1 Night
3 listings
1.8% of total
2 Nights
9 listings
5.5% of total
3 Nights
4 listings
2.4% of total
4-6 Nights
23 listings
14% of total
7-29 Nights
4 listings
2.4% of total
30+ Nights
121 listings
73.8% of total
Key Insights
- The most prevalent minimum stay requirement in Zinnowitz is 30+ Nights, adopted by 73.8% of listings. This highlights the market's preference for longer commitments.
- Very short stays (1-2 nights) are less common (7.3%), suggesting hosts prefer slightly longer bookings to optimize turnover.
- A significant segment (73.8%) caters to monthly stays (30+ nights) in Zinnowitz, pointing to opportunities in the extended-stay market.
Recommendations
- Align with the market by considering a 30+ Nights minimum stay, as 73.8% of Zinnowitz hosts use this setting.
- If feasible, allowing 1-night stays, especially midweek or during low season, could capture last-minute bookings, as only 1.8% currently do.
- Explore offering discounts for stays of 30+ nights to attract the 73.8% of the market seeking extended stays.
- Adjust minimum nights based on seasonality – potentially shorter during low season and longer during peak demand periods in Zinnowitz.
Zinnowitz Airbnb Cancellation Policy Trends Analysis (2026)
Super Strict 30 Days
27 listings
16.5% of total
Super Strict 60 Days
6 listings
3.7% of total
Flexible
7 listings
4.3% of total
Moderate
20 listings
12.2% of total
Firm
93 listings
56.7% of total
Strict
11 listings
6.7% of total
Cancellation Policy Insights for Zinnowitz
- The prevailing Airbnb cancellation policy trend in Zinnowitz is Firm, used by 56.7% of listings.
- A majority (63.4%) of hosts in Zinnowitz utilize Firm or Strict policies, indicating a market where hosts prioritize booking security.
- Strict cancellation policies are quite rare (6.7%), potentially making listings with this policy less competitive unless justified by high demand or property type.
Recommendations for Hosts
- Consider adopting a Firm policy to align with the 56.7% market standard in Zinnowitz.
- Using a Strict policy might deter some guests, as only 6.7% of listings use it. Evaluate if potential revenue protection outweighs possible lower booking rates.
- Regularly review your cancellation policy against competitors and market demand shifts in Zinnowitz.
Zinnowitz STR Booking Lead Time Analysis (2026)
Average Booking Lead Time by Month
Booking Lead Time Insights for Zinnowitz
- The overall average booking lead time for vacation rentals in Zinnowitz is 82 days.
- Guests book furthest in advance for stays during July (average 130 days), likely coinciding with peak travel demand or local events.
- The shortest booking windows occur for stays in February (average 17 days), indicating more last-minute travel plans during this time.
- Seasonally, Summer (119 days avg.) sees the longest lead times, while Spring (49 days avg.) has the shortest, reflecting typical travel planning cycles.
Recommendations for Hosts
- Use the overall average lead time (82 days) as a baseline for your pricing and availability strategy in Zinnowitz.
- For July stays, consider implementing length-of-stay discounts or slightly higher rates for bookings made less than 130 days out to capitalize on advance planning.
- Target marketing efforts for the Summer season well in advance (at least 119 days) to capture early planners.
- Monitor your own booking lead times against these Zinnowitz averages to identify opportunities for dynamic pricing adjustments.
Popular & Essential Airbnb Amenities in Zinnowitz (2026)
Amenity Prevalence
Amenity Insights for Zinnowitz
- Essential amenities in Zinnowitz that guests expect include: TV, Heating, Refrigerator. Lacking these (any) could significantly impact bookings.
- Popular amenities like Coffee maker, Free parking on premises, Smoke alarm are common but not universal. Offering these can provide a competitive edge.
- Warning: Wifi is not universally provided but is considered essential globally. Ensure reliable Wifi is offered.
Recommendations for Hosts
- Ensure your listing includes all essential amenities for Zinnowitz: TV, Heating, Refrigerator.
- Prioritize adding missing essentials: Heating, Refrigerator.
- Consider adding popular differentiators like Coffee maker or Free parking on premises to increase appeal.
- Highlight unique or less common amenities you offer (e.g., hot tub, dedicated workspace, EV charger) in your listing description and photos.
- Regularly check competitor amenities in Zinnowitz to stay competitive.
Zinnowitz Airbnb Guest Demographics & Profile Analysis (2026)
Guest Profile Summary for Zinnowitz
- The typical guest profile for Airbnb in Zinnowitz consists of primarily domestic travelers (96%), often arriving from nearby Berlin, typically belonging to the Post-2000s (Gen Z/Alpha) group (50%), primarily speaking German or English.
- Domestic travelers account for 96.1% of guests.
- Key international markets include Germany (96.1%) and Switzerland (1%).
- Top languages spoken are German (44.9%) followed by English (41.8%).
- A significant demographic segment is the Post-2000s (Gen Z/Alpha) group, representing 50% of guests.
Recommendations for Hosts
- Target domestic marketing efforts towards travelers from Berlin and Leipzig.
- Tailor amenities and listing descriptions to appeal to the dominant Post-2000s (Gen Z/Alpha) demographic (e.g., highlight fast WiFi, smart home features, local guides).
- Highlight unique local experiences or amenities relevant to the primary guest profile.
- Consider seasonal promotions aligned with peak travel times for key origin markets.
Nearby Short-Term Rental Market Comparison
How does the Zinnowitz Airbnb market stack up against its neighbors? Compare key performance metrics like average monthly revenue, ADR, and occupancy rates in surrounding areas to understand the broader regional STR landscape.
| Market | Active Properties | Monthly Revenue | Daily Rate | Avg. Occupancy |
|---|---|---|---|---|
| Gallin-Kuppentin | 14 | $2,958 | $358.55 | 30% |
| Luckow | 18 | $2,751 | $265.42 | 40% |
| Groß Nemerow | 13 | $2,404 | $135.17 | 60% |
| Heiligengrabe | 12 | $2,400 | $226.39 | 39% |
| Copenhagen | 9,111 | $2,347 | $222.94 | 52% |
| Råbylille Strand | 31 | $2,254 | $190.70 | 45% |
| Tejn | 60 | $2,181 | $275.98 | 43% |
| Alt Sührkow | 10 | $2,175 | $426.32 | 28% |
| Zastań | 28 | $2,135 | $265.12 | 34% |
| Vogelsang-Warsin | 11 | $2,123 | $227.20 | 35% |