Wesenberg Airbnb Market Analysis 2026: Short Term Rental Data & Vacation Rental Statistics in Mecklenburg-Vorpommern, Germany
Is Airbnb profitable in Wesenberg in 2026? Explore comprehensive Airbnb analytics for Wesenberg, Mecklenburg-Vorpommern, Germany to uncover income potential. This 2026 STR market report for Wesenberg, based on AirROI data from February 2025 to January 2026, reveals key trends in the niche market of 19 active listings.
Whether you're considering an Airbnb investment in Wesenberg, optimizing your existing vacation rental, or exploring rental arbitrage opportunities, understanding the Wesenberg Airbnb data is crucial. Leveraging the low regulation environment is key to maximizing your short term rental income potential. Let's dive into the specifics.
Key Wesenberg Airbnb Performance Metrics Overview
Monthly Airbnb Revenue Variations & Income Potential in Wesenberg (2026)
Understanding the monthly revenue variations for Airbnb listings in Wesenberg is key to maximizing your short term rental income potential. Seasonality significantly impacts earnings. Our analysis, based on data from the past 12 months, shows that the peak revenue month for STRs in Wesenberg is typically July, while January often presents the lowest earnings, highlighting opportunities for strategic pricing adjustments during shoulder and low seasons. Explore the typical Airbnb income in Wesenberg across different performance tiers:
- Best-in-class properties (Top 10%) achieve $2,658+ monthly, often utilizing dynamic pricing and superior guest experiences.
- Strong performing properties (Top 25%) earn $1,704 or more, indicating effective management and desirable locations/amenities.
- Typical properties (Median) generate around $1,052 per month, representing the average market performance.
- Entry-level properties (Bottom 25%) see earnings around $721, often with potential for optimization.
Average Monthly Airbnb Earnings Trend in Wesenberg
Wesenberg Airbnb Occupancy Rate Trends (2026)
Maximize your bookings by understanding the Wesenberg STR occupancy trends. Seasonal demand shifts significantly influence how often properties are booked. Typically, Julysees the highest demand (peak season occupancy), while December experiences the lowest (low season). Effective strategies, like adjusting minimum stays or offering promotions, can boost occupancy during slower periods. Here's how different property tiers perform in Wesenberg:
- Best-in-class properties (Top 10%) achieve 70%+ occupancy, indicating high desirability and potentially optimized availability.
- Strong performing properties (Top 25%) maintain 49% or higher occupancy, suggesting good market fit and guest satisfaction.
- Typical properties (Median) have an occupancy rate around 34%.
- Entry-level properties (Bottom 25%) average 19% occupancy, potentially facing higher vacancy.
Average Monthly Occupancy Rate Trend in Wesenberg
Average Daily Rate (ADR) Airbnb Trends in Wesenberg (2026)
Effective short term rental pricing strategy in Wesenberg involves understanding monthly ADR fluctuations. The Average Daily Rate (ADR) for Airbnb in Wesenberg typically peaks in October and dips lowest during March. Leveraging Airbnb dynamic pricing tools or strategies based on this seasonality can significantly boost revenue. Here's a look at the typical nightly rates achieved:
- Best-in-class properties (Top 10%) command rates of $222+ per night, often due to premium features or locations.
- Strong performing properties (Top 25%) achieve nightly rates of $141 or more.
- Typical properties (Median) charge around $112 per night.
- Entry-level properties (Bottom 25%) earn around $87 per night.
Average Daily Rate (ADR) Trend by Month in Wesenberg
Get Live Wesenberg Market Intelligence 👇

Explore Real-time Analytics
Airbnb Seasonality Analysis & Trends in Wesenberg (2026)
Peak Season (July, August, June)
- Revenue averages $1,829 per month
- Occupancy rates average 49.7%
- Daily rates average $142
Shoulder Season
- Revenue averages $1,311 per month
- Occupancy maintains around 36.2%
- Daily rates hold near $141
Low Season (January, March, December)
- Revenue drops to average $922 per month
- Occupancy decreases to average 23.3%
- Daily rates adjust to average $142
Seasonality Insights for Wesenberg
- The Airbnb seasonality in Wesenberg shows highly seasonal trends requiring careful strategy. While the sections above show seasonal averages, it's also insightful to look at the extremes:
- During the high season, the absolute peak month showcases Wesenberg's highest earning potential, with monthly revenues capable of climbing to $1,997, occupancy reaching a high of 54.4%, and ADRs peaking at $154.
- Conversely, the slowest single month of the year, typically falling within the low season, marks the market's lowest point. In this month, revenue might dip to $784, occupancy could drop to 18.6%, and ADRs may adjust down to $125.
- Understanding both the seasonal averages and these monthly peaks and troughs in revenue, occupancy, and ADR is crucial for maximizing your Airbnb profit potential in Wesenberg.
Seasonal Strategies for Maximizing Profit
- Peak Season: Maximize revenue through premium pricing and potentially longer minimum stays. Ensure high availability.
- Low Season: Offer competitive pricing, special promotions (e.g., extended stay discounts), and flexible cancellation policies. Target off-season travelers like remote workers or budget-conscious guests.
- Shoulder Seasons: Implement dynamic pricing that balances peak and low rates. Target weekend travelers or specific events. Offer slightly more flexible terms than peak season.
- Regularly analyze your own performance against these Wesenberg seasonality benchmarks and adjust your pricing and availability strategy accordingly.
Best Areas for Airbnb Investment in Wesenberg (2026)
Exploring the top neighborhoods for short-term rentals in Wesenberg? This section highlights key areas, outlining why they are attractive for hosts and guests, along with notable local attractions. Consider these locations based on your target guest profile and investment strategy.
| Neighborhood / Area | Why Host Here? (Target Guests & Appeal) | Key Attractions & Landmarks |
|---|---|---|
| City Center | The heart of Wesenberg, characterized by charming streets and historical sites. Ideal for tourists who want to be close to cafes, shops, and local culture. | Wesenberg Castle, Historical City Center, Local Cafes and Shops, Arts and Crafts Market |
| Wesenberg Lakeside | A picturesque area by the water, offering beautiful views and outdoor activities. Perfect for nature lovers and families looking to enjoy water sports. | Wesenberger Lake, Water Sports Activities, Picnic Areas, Hiking Trails |
| Nature Reserve Neukloster | A serene location perfect for those seeking tranquility and nature. Attracts eco-tourists and those interested in hiking and wildlife. | Neukloster Forest, Birdwatching Spots, Hiking Trails, Picnic Areas |
| Historic District | Home to well-preserved architecture and a rich history, making it attractive to travelers interested in culture and education. | Local Museums, Cultural Events, Historical Architecture, Guided Tours |
| Countryside Retreats | Surrounded by beautiful nature and farmlands, this area is perfect for visitors looking to escape urban life and experience rural Germany. | Farm Stays, Countryside Trails, Local Produce Markets, Nature Walks |
| Weser-Wittstock Region | Known for its natural beauty and outdoor recreation opportunities, making it popular for active vacationers and families. | Biking Trails, Fishing Spots, Camping Areas, Nature Parks |
| Art and Culture Hub | A vibrant area known for its local art scene, crafts, and performances. Ideal for culturally curious travelers. | Art Galleries, Theater Performances, Craft Workshops, Cultural Festivals |
| Charming Villages Nearby | Discover the quaint charm of smaller villages around Wesenberg, offering a glimpse into traditional German life and hospitality. | Local Festivals, Traditional Restaurants, Scenic Walks, Historic Churches |
Understanding Airbnb License Requirements & STR Laws in Wesenberg (2026)
While Wesenberg, Mecklenburg-Vorpommern, Germany currently shows low STR regulations, specific Airbnb license requirements might still exist or change. Always verify the latest short term rental regulations and Airbnb license requirements directly with local government authorities for Wesenberg to ensure full compliance before hosting.
(Source: AirROI data, 2026, finding no licensed listings among those analyzed)
Top Performing Airbnb Properties in Wesenberg (2026)
Benchmark your potential! Explore examples of top-performing Airbnb properties in Wesenbergbased on Trailing Twelve Month (TTM) revenue. Analyze their characteristics, revenue, occupancy rate, and ADR to understand what drives success in this market.
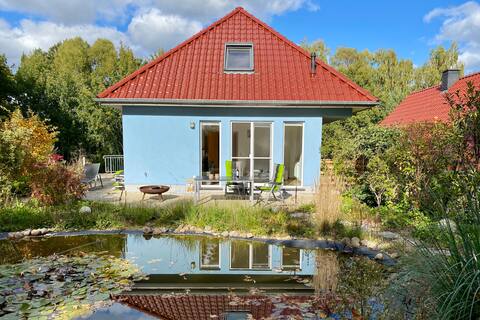
Large apartment / Blue house with sauna & garden
Entire Place • 2 bedrooms
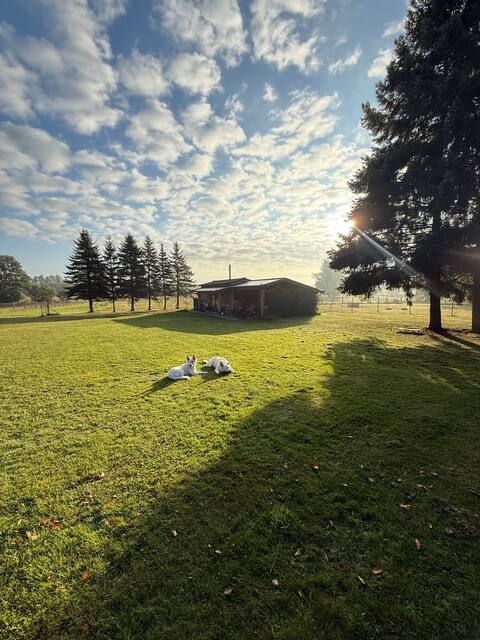
Ranch life at a Distillery on a Lake with Sauna
Private Room • N/A

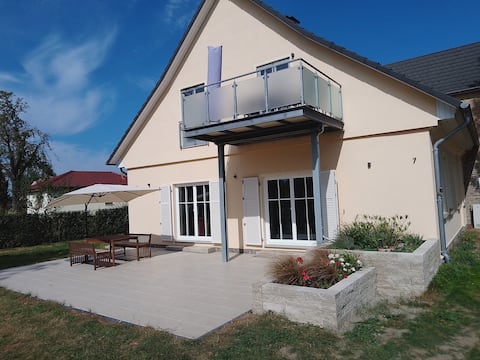
Vacation home at Ellenbogensee
Entire Place • 2 bedrooms

Matilda I-special Finnish hut with private jetty
Entire Place • 2 bedrooms
Vacation home in Zirtow near Wesenberg
Entire Place • 5 bedrooms
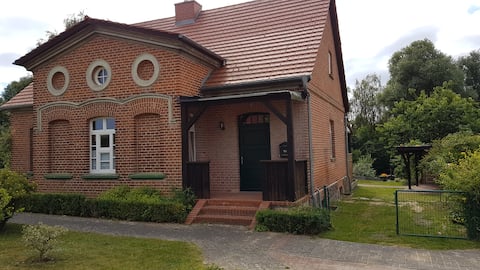
Customs House
Entire Place • 2 bedrooms
Note: Performance varies based on location, size, amenities, seasonality, and management quality. Data reflects the past 12 months.
Top Performing Airbnb Hosts in Wesenberg (2026)
Learn from the best! This table showcases top-performing Airbnb hosts in Wesenberg based on the number of properties managed and estimated total revenue over the past year. Analyze their scale and performance metrics.
| Host Name | Properties | Grossing Revenue | Stay Reviews | Avg Rating |
|---|---|---|---|---|
| Christiane | 2 | $40,457 | 30 | 4.68/5.0 |
| Alex | 1 | $26,265 | 102 | 4.95/5.0 |
| M. | 1 | $21,703 | 27 | 5.00/5.0 |
| Peter | 1 | $19,401 | 37 | 4.84/5.0 |
| Stefan | 1 | $13,921 | 3 | 5.00/5.0 |
| Claudia | 1 | $13,236 | 68 | 5.00/5.0 |
| Anika | 1 | $11,716 | 41 | 4.98/5.0 |
| Gerlinde | 1 | $10,582 | 46 | 4.83/5.0 |
| Petra | 1 | $10,171 | 60 | 4.87/5.0 |
| Karin | 1 | $8,859 | 50 | 4.76/5.0 |
Analyzing the strategies of top hosts, such as their property selection, pricing, and guest communication, can offer valuable lessons for optimizing your own Airbnb operations in Wesenberg.
Dive Deeper: Advanced Wesenberg STR Market Data (2026)
Ready to unlock more insights? AirROI provides access to advanced metrics and comprehensive Airbnb data for Wesenberg. Explore detailed analytics beyond this report to refine your investment strategy, optimize pricing, and maximize your vacation rental profits.
Explore Advanced MetricsWesenberg Short-Term Rental Market Composition (2026): Property & Room Types
Room Type Distribution
Property Type Distribution
Market Composition Insights for Wesenberg
- The Wesenberg Airbnb market composition is heavily skewed towards Entire Home/Apt listings, which make up 94.7% of the 19 active rentals. This indicates strong guest preference for privacy and space.
- Looking at the property type distribution in Wesenberg, House properties are the most common (57.9%), reflecting the local real estate landscape.
- Houses represent a significant 57.9% portion, catering likely to families or larger groups.
Wesenberg Airbnb Room Capacity Analysis (2026): Bedroom Distribution
Distribution of Listings by Number of Bedrooms
Room Capacity Insights for Wesenberg
- The dominant room capacity in Wesenberg is 1 bedroom listings, making up 52.6% of the market. This suggests a strong demand for properties suitable for couples or solo travelers.
- Together, 1 bedroom and 2 bedrooms properties represent 84.2% of the active Airbnb listings in Wesenberg, indicating a high concentration in these sizes.
- With over half the market (52.6%) consisting of studios or 1-bedroom units, Wesenberg is particularly well-suited for individuals or couples.
- Listings with 3+ bedrooms (5.3%) represent a smaller niche, potentially indicating an underserved market for larger group accommodations in Wesenberg.
Wesenberg Vacation Rental Guest Capacity Trends (2026)
Distribution of Listings by Guest Capacity
Guest Capacity Insights for Wesenberg
- The most common guest capacity trend in Wesenberg vacation rentals is listings accommodating 4 guests (42.1%). This suggests the primary traveler segment is likely small families or groups.
- Properties designed for 4 guests and 2 guests dominate the Wesenberg STR market, accounting for 68.4% of listings.
- 15.8% of properties accommodate 6+ guests, serving the market segment for larger families or group travel in Wesenberg.
- On average, properties in Wesenberg are equipped to host 3.8 guests.
Wesenberg Airbnb Booking Patterns (2026): Available vs. Booked Days
Available Days Distribution
Booked Days Distribution
Booking Pattern Insights for Wesenberg
- The most common availability pattern in Wesenberg falls within the 271-366 days range, representing 57.9% of listings. This suggests many properties have significant open periods on their calendars.
- Approximately 100.0% of listings show high availability (181+ days open annually), indicating potential for increased bookings or specific owner usage patterns.
- For booked days, the 31-90 days range is most frequent in Wesenberg (42.1%), reflecting common guest stay durations or potential owner blocking patterns.
- A notable 5.3% of properties secure long booking periods (181+ days booked per year), highlighting successful long-term rental strategies or significant owner usage.
Wesenberg Airbnb Minimum Stay Requirements Analysis
Distribution of Listings by Minimum Night Requirement
2 Nights
3 listings
15.8% of total
3 Nights
2 listings
10.5% of total
4-6 Nights
8 listings
42.1% of total
30+ Nights
6 listings
31.6% of total
Key Insights
- The most prevalent minimum stay requirement in Wesenberg is 4-6 Nights, adopted by 42.1% of listings. This highlights the market's preference for longer commitments.
- Very short stays (1-2 nights) are less common (15.8%), suggesting hosts prefer slightly longer bookings to optimize turnover.
- A significant segment (31.6%) caters to monthly stays (30+ nights) in Wesenberg, pointing to opportunities in the extended-stay market.
Recommendations
- Align with the market by considering a 4-6 Nights minimum stay, as 42.1% of Wesenberg hosts use this setting.
- Explore offering discounts for stays of 30+ nights to attract the 31.6% of the market seeking extended stays.
- Adjust minimum nights based on seasonality – potentially shorter during low season and longer during peak demand periods in Wesenberg.
Wesenberg Airbnb Cancellation Policy Trends Analysis (2026)
Flexible
5 listings
26.3% of total
Moderate
3 listings
15.8% of total
Firm
9 listings
47.4% of total
Strict
2 listings
10.5% of total
Cancellation Policy Insights for Wesenberg
- The prevailing Airbnb cancellation policy trend in Wesenberg is Firm, used by 47.4% of listings.
- A majority (57.9%) of hosts in Wesenberg utilize Firm or Strict policies, indicating a market where hosts prioritize booking security.
Recommendations for Hosts
- Consider adopting a Firm policy to align with the 47.4% market standard in Wesenberg.
- Using a Strict policy might deter some guests, as only 10.5% of listings use it. Evaluate if potential revenue protection outweighs possible lower booking rates.
- Regularly review your cancellation policy against competitors and market demand shifts in Wesenberg.
Wesenberg STR Booking Lead Time Analysis (2026)
Average Booking Lead Time by Month
Booking Lead Time Insights for Wesenberg
- The overall average booking lead time for vacation rentals in Wesenberg is 81 days.
- Guests book furthest in advance for stays during March (average 120 days), likely coinciding with peak travel demand or local events.
- The shortest booking windows occur for stays in January (average 47 days), indicating more last-minute travel plans during this time.
- Seasonally, Summer (94 days avg.) sees the longest lead times, while Winter (58 days avg.) has the shortest, reflecting typical travel planning cycles.
Recommendations for Hosts
- Use the overall average lead time (81 days) as a baseline for your pricing and availability strategy in Wesenberg.
- For March stays, consider implementing length-of-stay discounts or slightly higher rates for bookings made less than 120 days out to capitalize on advance planning.
- Target marketing efforts for the Summer season well in advance (at least 94 days) to capture early planners.
- Monitor your own booking lead times against these Wesenberg averages to identify opportunities for dynamic pricing adjustments.
Popular & Essential Airbnb Amenities in Wesenberg (2026)
Amenity Prevalence
Amenity Insights for Wesenberg
- Popular amenities like Kitchen, Refrigerator, Free parking on premises are common but not universal. Offering these can provide a competitive edge.
Recommendations for Hosts
- Consider adding popular differentiators like Kitchen or Refrigerator to increase appeal.
- Highlight unique or less common amenities you offer (e.g., hot tub, dedicated workspace, EV charger) in your listing description and photos.
- Regularly check competitor amenities in Wesenberg to stay competitive.
Wesenberg Airbnb Guest Demographics & Profile Analysis (2026)
Guest Profile Summary for Wesenberg
- The typical guest profile for Airbnb in Wesenberg consists of primarily domestic travelers (89%), often arriving from nearby Berlin, typically belonging to the Post-2000s (Gen Z/Alpha) group (50%), primarily speaking English or German.
- Domestic travelers account for 89.4% of guests.
- Key international markets include Germany (89.4%) and Portugal (2.1%).
- Top languages spoken are English (40.7%) followed by German (33.3%).
- A significant demographic segment is the Post-2000s (Gen Z/Alpha) group, representing 50% of guests.
Recommendations for Hosts
- Target domestic marketing efforts towards travelers from Berlin and Hamburg.
- Tailor amenities and listing descriptions to appeal to the dominant Post-2000s (Gen Z/Alpha) demographic (e.g., highlight fast WiFi, smart home features, local guides).
- Highlight unique local experiences or amenities relevant to the primary guest profile.
- Consider seasonal promotions aligned with peak travel times for key origin markets.
Nearby Short-Term Rental Market Comparison
How does the Wesenberg Airbnb market stack up against its neighbors? Compare key performance metrics like average monthly revenue, ADR, and occupancy rates in surrounding areas to understand the broader regional STR landscape.
| Market | Active Properties | Monthly Revenue | Daily Rate | Avg. Occupancy |
|---|---|---|---|---|
| Kremmen | 10 | $3,240 | $335.57 | 31% |
| Gallin-Kuppentin | 14 | $2,958 | $358.55 | 30% |
| Wittenbeck | 14 | $2,937 | $224.34 | 43% |
| Groß Nemerow | 13 | $2,404 | $135.17 | 60% |
| Heiligengrabe | 12 | $2,400 | $226.39 | 39% |
| Råbylille Strand | 31 | $2,254 | $190.70 | 45% |
| Alt Sührkow | 10 | $2,175 | $426.32 | 28% |
| Berlin | 6,390 | $2,126 | $168.98 | 50% |
| Rüdersdorf bei Berlin | 11 | $1,953 | $160.80 | 43% |
| Hoppegarten | 21 | $1,926 | $134.44 | 56% |