Userin Airbnb Market Analysis 2025: Short Term Rental Data & Vacation Rental Statistics in Mecklenburg-Vorpommern, Germany
Is Airbnb profitable in Userin in 2025? Explore comprehensive Airbnb analytics for Userin, Mecklenburg-Vorpommern, Germany to uncover income potential. This 2025 STR market report for Userin, based on AirROI data from November 2024 to October 2025, reveals key trends in the niche market of 17 active listings.
Whether you're considering an Airbnb investment in Userin, optimizing your existing vacation rental, or exploring rental arbitrage opportunities, understanding the Userin Airbnb data is crucial. Leveraging the low regulation environment is key to maximizing your short term rental income potential. Let's dive into the specifics.
Key Userin Airbnb Performance Metrics Overview
Monthly Airbnb Revenue Variations & Income Potential in Userin (2025)
Understanding the monthly revenue variations for Airbnb listings in Userin is key to maximizing your short term rental income potential. Seasonality significantly impacts earnings. Our analysis, based on data from the past 12 months, shows that the peak revenue month for STRs in Userin is typically August, while January often presents the lowest earnings, highlighting opportunities for strategic pricing adjustments during shoulder and low seasons. Explore the typical Airbnb income in Userin across different performance tiers:
- Best-in-class properties (Top 10%) achieve $2,230+ monthly, often utilizing dynamic pricing and superior guest experiences.
- Strong performing properties (Top 25%) earn $1,595 or more, indicating effective management and desirable locations/amenities.
- Typical properties (Median) generate around $1,064 per month, representing the average market performance.
- Entry-level properties (Bottom 25%) see earnings around $612, often with potential for optimization.
Average Monthly Airbnb Earnings Trend in Userin
Userin Airbnb Occupancy Rate Trends (2025)
Maximize your bookings by understanding the Userin STR occupancy trends. Seasonal demand shifts significantly influence how often properties are booked. Typically, Augustsees the highest demand (peak season occupancy), while January experiences the lowest (low season). Effective strategies, like adjusting minimum stays or offering promotions, can boost occupancy during slower periods. Here's how different property tiers perform in Userin:
- Best-in-class properties (Top 10%) achieve 63%+ occupancy, indicating high desirability and potentially optimized availability.
- Strong performing properties (Top 25%) maintain 42% or higher occupancy, suggesting good market fit and guest satisfaction.
- Typical properties (Median) have an occupancy rate around 30%.
- Entry-level properties (Bottom 25%) average 14% occupancy, potentially facing higher vacancy.
Average Monthly Occupancy Rate Trend in Userin
Average Daily Rate (ADR) Airbnb Trends in Userin (2025)
Effective short term rental pricing strategy in Userin involves understanding monthly ADR fluctuations. The Average Daily Rate (ADR) for Airbnb in Userin typically peaks in August and dips lowest during February. Leveraging Airbnb dynamic pricing tools or strategies based on this seasonality can significantly boost revenue. Here's a look at the typical nightly rates achieved:
- Best-in-class properties (Top 10%) command rates of $164+ per night, often due to premium features or locations.
- Strong performing properties (Top 25%) achieve nightly rates of $141 or more.
- Typical properties (Median) charge around $123 per night.
- Entry-level properties (Bottom 25%) earn around $90 per night.
Average Daily Rate (ADR) Trend by Month in Userin
Get Live Userin Market Intelligence 👇

Explore Real-time Analytics
Airbnb Seasonality Analysis & Trends in Userin (2025)
Peak Season (August, July, June)
- Revenue averages $2,169 per month
- Occupancy rates average 52.7%
- Daily rates average $133
Shoulder Season
- Revenue averages $1,013 per month
- Occupancy maintains around 28.9%
- Daily rates hold near $118
Low Season (January, March, November)
- Revenue drops to average $684 per month
- Occupancy decreases to average 22.0%
- Daily rates adjust to average $111
Seasonality Insights for Userin
- The Airbnb seasonality in Userin shows highly seasonal trends requiring careful strategy. While the sections above show seasonal averages, it's also insightful to look at the extremes:
- During the high season, the absolute peak month showcases Userin's highest earning potential, with monthly revenues capable of climbing to $2,731, occupancy reaching a high of 66.9%, and ADRs peaking at $136.
- Conversely, the slowest single month of the year, typically falling within the low season, marks the market's lowest point. In this month, revenue might dip to $531, occupancy could drop to 15.5%, and ADRs may adjust down to $107.
- Understanding both the seasonal averages and these monthly peaks and troughs in revenue, occupancy, and ADR is crucial for maximizing your Airbnb profit potential in Userin.
Seasonal Strategies for Maximizing Profit
- Peak Season: Maximize revenue through premium pricing and potentially longer minimum stays. Ensure high availability.
- Low Season: Offer competitive pricing, special promotions (e.g., extended stay discounts), and flexible cancellation policies. Target off-season travelers like remote workers or budget-conscious guests.
- Shoulder Seasons: Implement dynamic pricing that balances peak and low rates. Target weekend travelers or specific events. Offer slightly more flexible terms than peak season.
- Regularly analyze your own performance against these Userin seasonality benchmarks and adjust your pricing and availability strategy accordingly.
Best Areas for Airbnb Investment in Userin (2025)
Exploring the top neighborhoods for short-term rentals in Userin? This section highlights key areas, outlining why they are attractive for hosts and guests, along with notable local attractions. Consider these locations based on your target guest profile and investment strategy.
| Neighborhood / Area | Why Host Here? (Target Guests & Appeal) | Key Attractions & Landmarks |
|---|---|---|
| Usedom Island | A popular vacation destination known for its sandy beaches, seaside resorts, and stunning natural landscapes. Perfect for tourists looking for relaxation and outdoor activities. | Ahlbeck Beach, Heringsdorf Pier, Usedom Island Nature Park, Seebrücke Ahlbeck, Peenemünde Historic Technical Museum |
| Rostock | A vibrant port city with rich maritime history and access to the Baltic Sea. Attractive for tourists wanting to explore historical sites and enjoy water activities. | Rostock Zoo, Kulturhistorisches Museum Rostock, Warnemünde Beach, St. Mary's Church, Rostock Harbor |
| Mecklenburg Lake District | Known for its picturesque lakes and recreational opportunities. Ideal for nature lovers and families looking for a tranquil and scenic retreat. | Plauer See, Müritz National Park, Kummerower See, Lake Müritz, Waren (Müritz) |
| Schwerin | The capital of Mecklenburg-Vorpommern, famous for its stunning castle and beautiful gardens. A great place for cultural tourism and history enthusiasts. | Schwerin Castle, Schwerin Cathedral, Lakes of Schwerin, Petruschower See, Museum Schwerin |
| Greifswald | A historic university town with a youthful atmosphere, known for its charming old town and coastal access. Appeals to both students and cultural tourists. | St. Nicholas Cathedral, University of Greifswald, Museum of Cultural History, Greifswald Botanical Garden, Wieck Hafen |
| Wismar | A UNESCO World Heritage site with medieval architecture and rich Hanseatic history. Attracts visitors interested in history and architecture. | Wismar Market Square, St. George's Church, Wismar Harbour, Historic Old Town, Schweinsbrücke |
| Bad Doberan | Known for its spa culture and proximity to the Baltic Sea. Attracts health-conscious travelers and those looking for relaxation. | Doberan Minster, Molli Railway, Kühler Grund, Alte Schule Museum, Badehaus Doberan |
| Binz | A popular seaside resort located on the island of Rügen, famous for its beach promenade and leisure activities. Ideal for families and beach lovers. | Binz Beach, Rügen Historic Railway, Prora Beach, Pier Binz, Granitz Hunting Lodge |
Understanding Airbnb License Requirements & STR Laws in Userin (2025)
While Userin, Mecklenburg-Vorpommern, Germany currently shows low STR regulations, specific Airbnb license requirements might still exist or change. Always verify the latest short term rental regulations and Airbnb license requirements directly with local government authorities for Userin to ensure full compliance before hosting.
(Source: AirROI data, 2025, finding no licensed listings among those analyzed)
Top Performing Airbnb Properties in Userin (2025)
Benchmark your potential! Explore examples of top-performing Airbnb properties in Userinbased on Trailing Twelve Month (TTM) revenue. Analyze their characteristics, revenue, occupancy rate, and ADR to understand what drives success in this market.
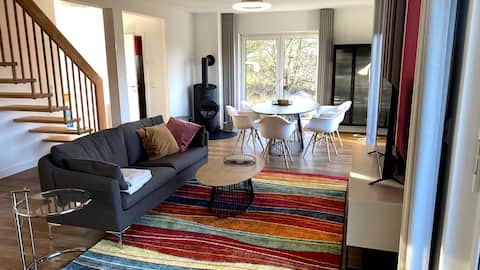
Vacation home Kalea
Entire Place • 2 bedrooms
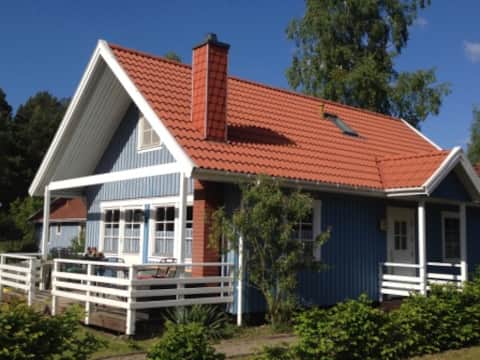
Villa Bunterkunt 2 boats, fireplace
Entire Place • 4 bedrooms

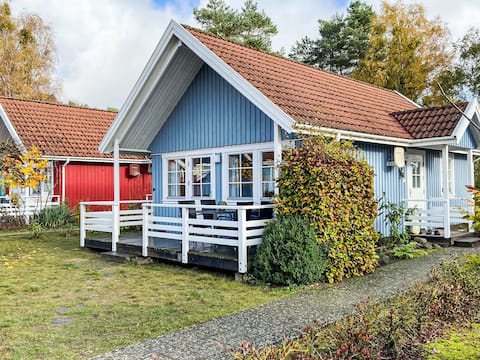
Vacation home on the Flößerkanal
Entire Place • 1 bedroom
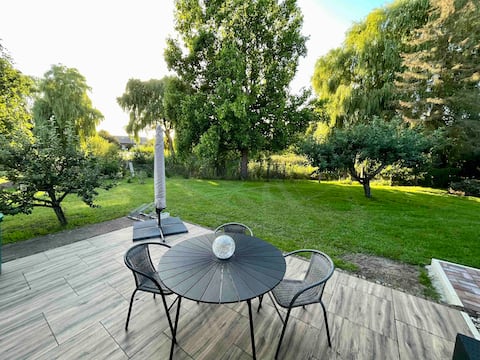
Ritters Ferienhus by Interhome
Entire Place • 2 bedrooms
Idyllic apartment for the perfect relaxation
Entire Place • 1 bedroom
Forestry House surrounded by Lakes&huge Garden
Entire Place • 3 bedrooms
Note: Performance varies based on location, size, amenities, seasonality, and management quality. Data reflects the past 12 months.
Top Performing Airbnb Hosts in Userin (2025)
Learn from the best! This table showcases top-performing Airbnb hosts in Userin based on the number of properties managed and estimated total revenue over the past year. Analyze their scale and performance metrics.
| Host Name | Properties | Grossing Revenue | Stay Reviews | Avg Rating |
|---|---|---|---|---|
| Reinhold | 3 | $31,705 | 68 | 4.69/5.0 |
| Detlef | 1 | $16,627 | 2 | Not Rated |
| Dörte | 1 | $15,968 | 127 | 4.97/5.0 |
| Ellen - Interhome | 2 | $15,350 | 7 | 4.83/5.0 |
| Christian | 1 | $10,156 | 40 | 4.93/5.0 |
| Dörte | 1 | $10,090 | 14 | 4.93/5.0 |
| Rene | 1 | $6,767 | 9 | 4.78/5.0 |
| Novasol | 2 | $6,147 | 2 | Not Rated |
| Denis | 1 | $4,535 | 18 | 4.78/5.0 |
| Buchungsservice SECRA Bookings | 1 | $3,197 | 2 | Not Rated |
Analyzing the strategies of top hosts, such as their property selection, pricing, and guest communication, can offer valuable lessons for optimizing your own Airbnb operations in Userin.
Dive Deeper: Advanced Userin STR Market Data (2025)
Ready to unlock more insights? AirROI provides access to advanced metrics and comprehensive Airbnb data for Userin. Explore detailed analytics beyond this report to refine your investment strategy, optimize pricing, and maximize your vacation rental profits.
Explore Advanced MetricsUserin Short-Term Rental Market Composition (2025): Property & Room Types
Room Type Distribution
Property Type Distribution
Market Composition Insights for Userin
- The Userin Airbnb market composition is heavily skewed towards Entire Home/Apt listings, which make up 100% of the 17 active rentals. This indicates strong guest preference for privacy and space.
- Looking at the property type distribution in Userin, House properties are the most common (70.6%), reflecting the local real estate landscape.
- Houses represent a significant 70.6% portion, catering likely to families or larger groups.
- The presence of 5.9% Hotel/Boutique listings indicates integration with traditional hospitality.
Userin Airbnb Room Capacity Analysis (2025): Bedroom Distribution
Distribution of Listings by Number of Bedrooms
Room Capacity Insights for Userin
- The dominant room capacity in Userin is 3 bedrooms listings, making up 35.3% of the market. This suggests a strong demand for properties suitable for families or small groups.
- Together, 3 bedrooms and 4 bedrooms properties represent 58.8% of the active Airbnb listings in Userin, indicating a high concentration in these sizes.
- A significant 58.8% of listings offer 3+ bedrooms, catering to larger groups and families seeking more space in Userin.
Userin Vacation Rental Guest Capacity Trends (2025)
Distribution of Listings by Guest Capacity
Guest Capacity Insights for Userin
- The most common guest capacity trend in Userin vacation rentals is listings accommodating 6 guests (29.4%). This suggests the primary traveler segment is likely larger groups.
- Properties designed for 6 guests and 8+ guests dominate the Userin STR market, accounting for 47.0% of listings.
- 58.8% of properties accommodate 6+ guests, serving the market segment for larger families or group travel in Userin.
- On average, properties in Userin are equipped to host 5.4 guests.
Userin Airbnb Booking Patterns (2025): Available vs. Booked Days
Available Days Distribution
Booked Days Distribution
Booking Pattern Insights for Userin
- The most common availability pattern in Userin falls within the 271-366 days range, representing 76.5% of listings. This suggests many properties have significant open periods on their calendars.
- Approximately 94.1% of listings show high availability (181+ days open annually), indicating potential for increased bookings or specific owner usage patterns.
- For booked days, the 31-90 days range is most frequent in Userin (52.9%), reflecting common guest stay durations or potential owner blocking patterns.
- A notable 5.9% of properties secure long booking periods (181+ days booked per year), highlighting successful long-term rental strategies or significant owner usage.
Userin Airbnb Minimum Stay Requirements Analysis
Distribution of Listings by Minimum Night Requirement
3 Nights
2 listings
11.8% of total
4-6 Nights
3 listings
17.6% of total
30+ Nights
12 listings
70.6% of total
Key Insights
- The most prevalent minimum stay requirement in Userin is 30+ Nights, adopted by 70.6% of listings. This highlights the market's preference for longer commitments.
- A significant segment (70.6%) caters to monthly stays (30+ nights) in Userin, pointing to opportunities in the extended-stay market.
Recommendations
- Align with the market by considering a 30+ Nights minimum stay, as 70.6% of Userin hosts use this setting.
- Explore offering discounts for stays of 30+ nights to attract the 70.6% of the market seeking extended stays.
- Adjust minimum nights based on seasonality – potentially shorter during low season and longer during peak demand periods in Userin.
Userin Airbnb Cancellation Policy Trends Analysis (2025)
Super Strict 30 Days
2 listings
11.8% of total
Super Strict 60 Days
2 listings
11.8% of total
Flexible
3 listings
17.6% of total
Moderate
2 listings
11.8% of total
Firm
6 listings
35.3% of total
Strict
2 listings
11.8% of total
Cancellation Policy Insights for Userin
- The prevailing Airbnb cancellation policy trend in Userin is Firm, used by 35.3% of listings.
- There's a relatively balanced mix between guest-friendly (29.4%) and stricter (47.1%) policies, offering choices for different guest needs.
Recommendations for Hosts
- Consider adopting a Firm policy to align with the 35.3% market standard in Userin.
- Using a Strict policy might deter some guests, as only 11.8% of listings use it. Evaluate if potential revenue protection outweighs possible lower booking rates.
- Regularly review your cancellation policy against competitors and market demand shifts in Userin.
Userin STR Booking Lead Time Analysis (2025)
Average Booking Lead Time by Month
Booking Lead Time Insights for Userin
- The overall average booking lead time for vacation rentals in Userin is 95 days.
- Guests book furthest in advance for stays during May (average 151 days), likely coinciding with peak travel demand or local events.
- The shortest booking windows occur for stays in November (average 19 days), indicating more last-minute travel plans during this time.
- Seasonally, Summer (134 days avg.) sees the longest lead times, while Winter (46 days avg.) has the shortest, reflecting typical travel planning cycles.
Recommendations for Hosts
- Use the overall average lead time (95 days) as a baseline for your pricing and availability strategy in Userin.
- For May stays, consider implementing length-of-stay discounts or slightly higher rates for bookings made less than 151 days out to capitalize on advance planning.
- Target marketing efforts for the Summer season well in advance (at least 134 days) to capture early planners.
- Monitor your own booking lead times against these Userin averages to identify opportunities for dynamic pricing adjustments.
Popular & Essential Airbnb Amenities in Userin (2025)
Amenity Prevalence
Amenity Insights for Userin
- Popular amenities like TV, Free parking on premises, Heating are common but not universal. Offering these can provide a competitive edge.
- Warning: Wifi is not universally provided but is considered essential globally. Ensure reliable Wifi is offered.
Recommendations for Hosts
- Consider adding popular differentiators like TV or Free parking on premises to increase appeal.
- Highlight unique or less common amenities you offer (e.g., hot tub, dedicated workspace, EV charger) in your listing description and photos.
- Regularly check competitor amenities in Userin to stay competitive.
Userin Airbnb Guest Demographics & Profile Analysis (2025)
Guest Profile Summary for Userin
- The typical guest profile for Airbnb in Userin consists of primarily domestic travelers (88%), often arriving from nearby Berlin, typically belonging to the Post-2000s (Gen Z/Alpha) group (50%), primarily speaking German or English.
- Domestic travelers account for 87.9% of guests.
- Key international markets include Germany (87.9%) and Switzerland (3%).
- Top languages spoken are German (37%) followed by English (34.8%).
- A significant demographic segment is the Post-2000s (Gen Z/Alpha) group, representing 50% of guests.
Recommendations for Hosts
- Target domestic marketing efforts towards travelers from Berlin and Hamburg.
- Tailor amenities and listing descriptions to appeal to the dominant Post-2000s (Gen Z/Alpha) demographic (e.g., highlight fast WiFi, smart home features, local guides).
- Highlight unique local experiences or amenities relevant to the primary guest profile.
- Consider seasonal promotions aligned with peak travel times for key origin markets.
Nearby Short-Term Rental Market Comparison
How does the Userin Airbnb market stack up against its neighbors? Compare key performance metrics like average monthly revenue, ADR, and occupancy rates in surrounding areas to understand the broader regional STR landscape.
| Market | Active Properties | Monthly Revenue | Daily Rate | Avg. Occupancy |
|---|---|---|---|---|
| Gallin-Kuppentin | 13 | $3,077 | $390.72 | 30% |
| Heiligengrabe | 11 | $3,075 | $244.02 | 44% |
| Wittenbeck | 14 | $2,515 | $214.51 | 40% |
| Groß Nemerow | 12 | $2,492 | $130.74 | 62% |
| Råbylille Strand | 31 | $2,307 | $194.41 | 44% |
| Rüdersdorf bei Berlin | 12 | $2,201 | $167.58 | 44% |
| Berlin | 6,258 | $2,136 | $170.38 | 49% |
| Gumtow | 17 | $1,932 | $155.99 | 40% |
| Hoppegarten | 20 | $1,904 | $121.85 | 57% |
| Storkow (Mark) | 19 | $1,865 | $147.50 | 47% |