Trassenheide Airbnb Market Analysis 2026: Short Term Rental Data & Vacation Rental Statistics in Mecklenburg-Vorpommern, Germany
Is Airbnb profitable in Trassenheide in 2026? Explore comprehensive Airbnb analytics for Trassenheide, Mecklenburg-Vorpommern, Germany to uncover income potential. This 2026 STR market report for Trassenheide, based on AirROI data from February 2025 to January 2026, reveals key trends in the niche market of 49 active listings.
Whether you're considering an Airbnb investment in Trassenheide, optimizing your existing vacation rental, or exploring rental arbitrage opportunities, understanding the Trassenheide Airbnb data is crucial. Leveraging the low regulation environment is key to maximizing your short term rental income potential. Let's dive into the specifics.
Key Trassenheide Airbnb Performance Metrics Overview
Monthly Airbnb Revenue Variations & Income Potential in Trassenheide (2026)
Understanding the monthly revenue variations for Airbnb listings in Trassenheide is key to maximizing your short term rental income potential. Seasonality significantly impacts earnings. Our analysis, based on data from the past 12 months, shows that the peak revenue month for STRs in Trassenheide is typically August, while January often presents the lowest earnings, highlighting opportunities for strategic pricing adjustments during shoulder and low seasons. Explore the typical Airbnb income in Trassenheide across different performance tiers:
- Best-in-class properties (Top 10%) achieve $2,840+ monthly, often utilizing dynamic pricing and superior guest experiences.
- Strong performing properties (Top 25%) earn $1,768 or more, indicating effective management and desirable locations/amenities.
- Typical properties (Median) generate around $1,097 per month, representing the average market performance.
- Entry-level properties (Bottom 25%) see earnings around $571, often with potential for optimization.
Average Monthly Airbnb Earnings Trend in Trassenheide
Trassenheide Airbnb Occupancy Rate Trends (2026)
Maximize your bookings by understanding the Trassenheide STR occupancy trends. Seasonal demand shifts significantly influence how often properties are booked. Typically, Augustsees the highest demand (peak season occupancy), while January experiences the lowest (low season). Effective strategies, like adjusting minimum stays or offering promotions, can boost occupancy during slower periods. Here's how different property tiers perform in Trassenheide:
- Best-in-class properties (Top 10%) achieve 66%+ occupancy, indicating high desirability and potentially optimized availability.
- Strong performing properties (Top 25%) maintain 48% or higher occupancy, suggesting good market fit and guest satisfaction.
- Typical properties (Median) have an occupancy rate around 30%.
- Entry-level properties (Bottom 25%) average 14% occupancy, potentially facing higher vacancy.
Average Monthly Occupancy Rate Trend in Trassenheide
Average Daily Rate (ADR) Airbnb Trends in Trassenheide (2026)
Effective short term rental pricing strategy in Trassenheide involves understanding monthly ADR fluctuations. The Average Daily Rate (ADR) for Airbnb in Trassenheide typically peaks in August and dips lowest during February. Leveraging Airbnb dynamic pricing tools or strategies based on this seasonality can significantly boost revenue. Here's a look at the typical nightly rates achieved:
- Best-in-class properties (Top 10%) command rates of $231+ per night, often due to premium features or locations.
- Strong performing properties (Top 25%) achieve nightly rates of $187 or more.
- Typical properties (Median) charge around $142 per night.
- Entry-level properties (Bottom 25%) earn around $107 per night.
Average Daily Rate (ADR) Trend by Month in Trassenheide
Get Live Trassenheide Market Intelligence 👇

Explore Real-time Analytics
Airbnb Seasonality Analysis & Trends in Trassenheide (2026)
Peak Season (August, July, June)
- Revenue averages $2,340 per month
- Occupancy rates average 51.9%
- Daily rates average $160
Shoulder Season
- Revenue averages $1,239 per month
- Occupancy maintains around 30.4%
- Daily rates hold near $148
Low Season (January, February, November)
- Revenue drops to average $672 per month
- Occupancy decreases to average 20.9%
- Daily rates adjust to average $145
Seasonality Insights for Trassenheide
- The Airbnb seasonality in Trassenheide shows highly seasonal trends requiring careful strategy. While the sections above show seasonal averages, it's also insightful to look at the extremes:
- During the high season, the absolute peak month showcases Trassenheide's highest earning potential, with monthly revenues capable of climbing to $2,825, occupancy reaching a high of 62.0%, and ADRs peaking at $161.
- Conversely, the slowest single month of the year, typically falling within the low season, marks the market's lowest point. In this month, revenue might dip to $392, occupancy could drop to 9.4%, and ADRs may adjust down to $137.
- Understanding both the seasonal averages and these monthly peaks and troughs in revenue, occupancy, and ADR is crucial for maximizing your Airbnb profit potential in Trassenheide.
Seasonal Strategies for Maximizing Profit
- Peak Season: Maximize revenue through premium pricing and potentially longer minimum stays. Ensure high availability.
- Low Season: Offer competitive pricing, special promotions (e.g., extended stay discounts), and flexible cancellation policies. Target off-season travelers like remote workers or budget-conscious guests.
- Shoulder Seasons: Implement dynamic pricing that balances peak and low rates. Target weekend travelers or specific events. Offer slightly more flexible terms than peak season.
- Regularly analyze your own performance against these Trassenheide seasonality benchmarks and adjust your pricing and availability strategy accordingly.
Best Areas for Airbnb Investment in Trassenheide (2026)
Exploring the top neighborhoods for short-term rentals in Trassenheide? This section highlights key areas, outlining why they are attractive for hosts and guests, along with notable local attractions. Consider these locations based on your target guest profile and investment strategy.
| Neighborhood / Area | Why Host Here? (Target Guests & Appeal) | Key Attractions & Landmarks |
|---|---|---|
| Trassenheide Beach | Trassenheide Beach is known for its sandy shores and family-friendly atmosphere. Ideal for guests looking for a relaxing beach vacation with access to various water sports and activities. | Trassenheide Beach, Wasserschloss, Beach Promenade, Seal Sanctuary, Trassenheide Sandsurfing |
| Peenemünde | Just a short drive from Trassenheide, Peenemünde is rich in history, particularly known for its military history and historical exhibitions. This area attracts history enthusiasts and families looking for educational experiences. | Peenemünde Historical Technical Museum, U-Boat Museum, Peenestrom Ferry, Bunker Museum Peenemünde |
| Zinnowitz | Zinnowitz is a nearby resort town known for its beautiful beach and spa facilities. It is a popular destination for tourists looking for wellness and relaxation. | Zinnowitz Beach, Schmalspurbahn, Badehaus Zinnowitz, Zinnowitz Pier, Sea Theatre Zinnowitz |
| Usedom Island | The entire Usedom Island is a hotspot for tourists looking for scenic nature, beaches, and resorts. Guests come to enjoy hiking, biking, and spa services in a beautiful coastal setting. | Usedom Island Coastline, Swinoujscie, Nationalpark Vorpommersche Boddenlandschaft, Usedomer Achterwasser |
| Koserow | Koserow attracts visitors seeking a quieter beach experience with beautiful natural landscapes. Its location offers a tranquil environment for relaxing vacations. | Koserow Beach, Kölpinsee, Waldbad Koserow, Historical Fisherman's Village |
| Ahlbeck | Ahlbeck is a charming seaside resort with historical architecture and a lovely promenade. It is known for its picturesque beach and attracts both families and couples. | Ahlbeck Beach, Ahlbeck Pier, Historical Ahlbeck Seebrücke, Ahlbeck Village |
| Heringsdorf | Heringsdorf is famous for its long sandy beaches and historic villas. It offers a glamorous seaside atmosphere, making it perfect for upscale travelers. | Heringsdorf Beach, Seebrücke Heringsdorf, Villa Oppenheim, Schwarzer Weg |
| Bansin | Bansin is a quaint resort town with a relaxed vibe. It is ideal for families and travelers looking for a peaceful retreat close to nature and the sea. | Bansin Beach, Ahlbeck-Bansin Promenade, Historical Bansin Church, Tropical Butterfly Garden |
Understanding Airbnb License Requirements & STR Laws in Trassenheide (2026)
While Trassenheide, Mecklenburg-Vorpommern, Germany currently shows low STR regulations, specific Airbnb license requirements might still exist or change. Always verify the latest short term rental regulations and Airbnb license requirements directly with local government authorities for Trassenheide to ensure full compliance before hosting.
(Source: AirROI data, 2026, based on 2% licensed listings)
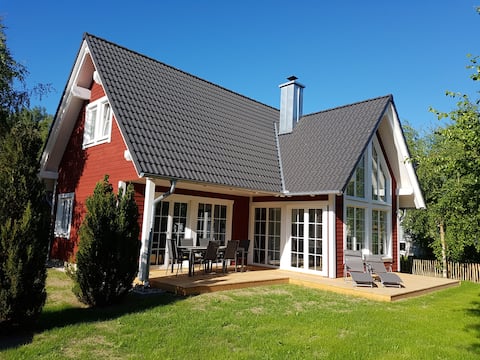
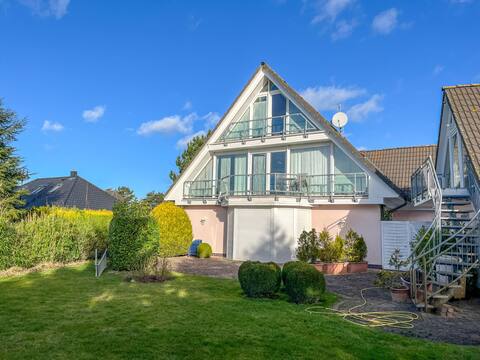
Top Performing Airbnb Properties in Trassenheide (2026)
Benchmark your potential! Explore examples of top-performing Airbnb properties in Trassenheidebased on Trailing Twelve Month (TTM) revenue. Analyze their characteristics, revenue, occupancy rate, and ADR to understand what drives success in this market.
Landhaus Birka - a family dream
Entire Place • 3 bedrooms

Idyllic wooden house - Quiet location for families
Entire Place • 2 bedrooms
Ferienhaus Evelin
Entire Place • 3 bedrooms
Eike by Interhome
Entire Place • 2 bedrooms
FeWo Ostseeschatz 50 m to the beach
Entire Place • 2 bedrooms
Vacation home Morgenstern - private idyll for 4 people.
Entire Place • 2 bedrooms
Note: Performance varies based on location, size, amenities, seasonality, and management quality. Data reflects the past 12 months.
Top Performing Airbnb Hosts in Trassenheide (2026)
Learn from the best! This table showcases top-performing Airbnb hosts in Trassenheide based on the number of properties managed and estimated total revenue over the past year. Analyze their scale and performance metrics.
| Host Name | Properties | Grossing Revenue | Stay Reviews | Avg Rating |
|---|---|---|---|---|
| Alice - Interhome | 8 | $72,598 | 19 | 4.30/5.0 |
| Claudia | 2 | $43,805 | 108 | 4.96/5.0 |
| Sarah | 3 | $38,694 | 45 | 4.79/5.0 |
| Familie Kempa | 4 | $36,343 | 20 | 5.00/5.0 |
| Carola | 1 | $20,403 | 46 | 4.72/5.0 |
| Carolin | 1 | $19,525 | 71 | 4.93/5.0 |
| Christin | 2 | $19,016 | 3 | 4.67/5.0 |
| Novasol | 2 | $18,205 | 5 | 4.75/5.0 |
| Frank | 2 | $15,089 | 114 | 4.88/5.0 |
| Lars | 1 | $13,724 | 152 | 4.84/5.0 |
Analyzing the strategies of top hosts, such as their property selection, pricing, and guest communication, can offer valuable lessons for optimizing your own Airbnb operations in Trassenheide.
Dive Deeper: Advanced Trassenheide STR Market Data (2026)
Ready to unlock more insights? AirROI provides access to advanced metrics and comprehensive Airbnb data for Trassenheide. Explore detailed analytics beyond this report to refine your investment strategy, optimize pricing, and maximize your vacation rental profits.
Explore Advanced MetricsTrassenheide Short-Term Rental Market Composition (2026): Property & Room Types
Room Type Distribution
Property Type Distribution
Market Composition Insights for Trassenheide
- The Trassenheide Airbnb market composition is heavily skewed towards Entire Home/Apt listings, which make up 100% of the 49 active rentals. This indicates strong guest preference for privacy and space.
- Looking at the property type distribution in Trassenheide, Apartment/Condo properties are the most common (61.2%), reflecting the local real estate landscape.
- Houses represent a significant 36.7% portion, catering likely to families or larger groups.
- Smaller segments like outdoor/unique (combined 2.0%) offer potential for unique stay experiences.
Trassenheide Airbnb Room Capacity Analysis (2026): Bedroom Distribution
Distribution of Listings by Number of Bedrooms
Room Capacity Insights for Trassenheide
- The dominant room capacity in Trassenheide is 2 bedrooms listings, making up 53.1% of the market. This suggests a strong demand for properties suitable for couples or solo travelers.
- Together, 2 bedrooms and 1 bedroom properties represent 81.7% of the active Airbnb listings in Trassenheide, indicating a high concentration in these sizes.
Trassenheide Vacation Rental Guest Capacity Trends (2026)
Distribution of Listings by Guest Capacity
Guest Capacity Insights for Trassenheide
- The most common guest capacity trend in Trassenheide vacation rentals is listings accommodating 4 guests (34.7%). This suggests the primary traveler segment is likely small families or groups.
- Properties designed for 4 guests and 3 guests dominate the Trassenheide STR market, accounting for 57.1% of listings.
- 24.5% of properties accommodate 6+ guests, serving the market segment for larger families or group travel in Trassenheide.
- On average, properties in Trassenheide are equipped to host 4.4 guests.
Trassenheide Airbnb Booking Patterns (2026): Available vs. Booked Days
Available Days Distribution
Booked Days Distribution
Booking Pattern Insights for Trassenheide
- The most common availability pattern in Trassenheide falls within the 271-366 days range, representing 81.6% of listings. This suggests many properties have significant open periods on their calendars.
- Approximately 91.8% of listings show high availability (181+ days open annually), indicating potential for increased bookings or specific owner usage patterns.
- For booked days, the 1-30 days range is most frequent in Trassenheide (42.9%), reflecting common guest stay durations or potential owner blocking patterns.
- A notable 8.2% of properties secure long booking periods (181+ days booked per year), highlighting successful long-term rental strategies or significant owner usage.
Trassenheide Airbnb Minimum Stay Requirements Analysis
Distribution of Listings by Minimum Night Requirement
1 Night
2 listings
4.1% of total
2 Nights
4 listings
8.2% of total
3 Nights
7 listings
14.3% of total
4-6 Nights
6 listings
12.2% of total
7-29 Nights
1 listings
2% of total
30+ Nights
29 listings
59.2% of total
Key Insights
- The most prevalent minimum stay requirement in Trassenheide is 30+ Nights, adopted by 59.2% of listings. This highlights the market's preference for longer commitments.
- Very short stays (1-2 nights) are less common (12.3%), suggesting hosts prefer slightly longer bookings to optimize turnover.
- A significant segment (59.2%) caters to monthly stays (30+ nights) in Trassenheide, pointing to opportunities in the extended-stay market.
Recommendations
- Align with the market by considering a 30+ Nights minimum stay, as 59.2% of Trassenheide hosts use this setting.
- If feasible, allowing 1-night stays, especially midweek or during low season, could capture last-minute bookings, as only 4.1% currently do.
- Explore offering discounts for stays of 30+ nights to attract the 59.2% of the market seeking extended stays.
- Adjust minimum nights based on seasonality – potentially shorter during low season and longer during peak demand periods in Trassenheide.
Trassenheide Airbnb Cancellation Policy Trends Analysis (2026)
Super Strict 60 Days
2 listings
4.1% of total
Super Strict 30 Days
2 listings
4.1% of total
Flexible
6 listings
12.2% of total
Moderate
4 listings
8.2% of total
Firm
30 listings
61.2% of total
Strict
5 listings
10.2% of total
Cancellation Policy Insights for Trassenheide
- The prevailing Airbnb cancellation policy trend in Trassenheide is Firm, used by 61.2% of listings.
- A majority (71.4%) of hosts in Trassenheide utilize Firm or Strict policies, indicating a market where hosts prioritize booking security.
Recommendations for Hosts
- Consider adopting a Firm policy to align with the 61.2% market standard in Trassenheide.
- Using a Strict policy might deter some guests, as only 10.2% of listings use it. Evaluate if potential revenue protection outweighs possible lower booking rates.
- Regularly review your cancellation policy against competitors and market demand shifts in Trassenheide.
Trassenheide STR Booking Lead Time Analysis (2026)
Average Booking Lead Time by Month
Booking Lead Time Insights for Trassenheide
- The overall average booking lead time for vacation rentals in Trassenheide is 102 days.
- Guests book furthest in advance for stays during August (average 148 days), likely coinciding with peak travel demand or local events.
- The shortest booking windows occur for stays in February (average 32 days), indicating more last-minute travel plans during this time.
- Seasonally, Summer (134 days avg.) sees the longest lead times, while Winter (79 days avg.) has the shortest, reflecting typical travel planning cycles.
Recommendations for Hosts
- Use the overall average lead time (102 days) as a baseline for your pricing and availability strategy in Trassenheide.
- For August stays, consider implementing length-of-stay discounts or slightly higher rates for bookings made less than 148 days out to capitalize on advance planning.
- Target marketing efforts for the Summer season well in advance (at least 134 days) to capture early planners.
- Monitor your own booking lead times against these Trassenheide averages to identify opportunities for dynamic pricing adjustments.
Popular & Essential Airbnb Amenities in Trassenheide (2026)
Amenity Prevalence
Amenity Insights for Trassenheide
- Essential amenities in Trassenheide that guests expect include: TV, Heating, Coffee maker. Lacking these (any) could significantly impact bookings.
- Popular amenities like Kitchen, Refrigerator, Hangers are common but not universal. Offering these can provide a competitive edge.
- Warning: Wifi is not universally provided but is considered essential globally. Ensure reliable Wifi is offered.
Recommendations for Hosts
- Ensure your listing includes all essential amenities for Trassenheide: TV, Heating, Coffee maker.
- Prioritize adding missing essentials: Heating, Coffee maker.
- Consider adding popular differentiators like Kitchen or Refrigerator to increase appeal.
- Highlight unique or less common amenities you offer (e.g., hot tub, dedicated workspace, EV charger) in your listing description and photos.
- Regularly check competitor amenities in Trassenheide to stay competitive.
Trassenheide Airbnb Guest Demographics & Profile Analysis (2026)
Guest Profile Summary for Trassenheide
- The typical guest profile for Airbnb in Trassenheide consists of primarily domestic travelers (87%), often arriving from nearby Berlin, typically belonging to the Post-2000s (Gen Z/Alpha) group (50%), primarily speaking German or English.
- Domestic travelers account for 86.8% of guests.
- Key international markets include Germany (86.8%) and Switzerland (1.9%).
- Top languages spoken are German (39.3%) followed by English (33.9%).
- A significant demographic segment is the Post-2000s (Gen Z/Alpha) group, representing 50% of guests.
Recommendations for Hosts
- Target domestic marketing efforts towards travelers from Berlin and Dresden.
- Tailor amenities and listing descriptions to appeal to the dominant Post-2000s (Gen Z/Alpha) demographic (e.g., highlight fast WiFi, smart home features, local guides).
- Highlight unique local experiences or amenities relevant to the primary guest profile.
- Consider seasonal promotions aligned with peak travel times for key origin markets.
Nearby Short-Term Rental Market Comparison
How does the Trassenheide Airbnb market stack up against its neighbors? Compare key performance metrics like average monthly revenue, ADR, and occupancy rates in surrounding areas to understand the broader regional STR landscape.
| Market | Active Properties | Monthly Revenue | Daily Rate | Avg. Occupancy |
|---|---|---|---|---|
| Gallin-Kuppentin | 14 | $2,958 | $358.55 | 30% |
| Luckow | 18 | $2,751 | $265.42 | 40% |
| Groß Nemerow | 13 | $2,404 | $135.17 | 60% |
| Heiligengrabe | 12 | $2,400 | $226.39 | 39% |
| Copenhagen | 9,111 | $2,347 | $222.94 | 52% |
| Råbylille Strand | 31 | $2,254 | $190.70 | 45% |
| Tejn | 60 | $2,181 | $275.98 | 43% |
| Alt Sührkow | 10 | $2,175 | $426.32 | 28% |
| Zastań | 28 | $2,135 | $265.12 | 34% |
| Vogelsang-Warsin | 11 | $2,123 | $227.20 | 35% |