Tannenheim Airbnb Market Analysis 2026: Short Term Rental Data & Vacation Rental Statistics in Mecklenburg-Vorpommern, Germany
Is Airbnb profitable in Tannenheim in 2026? Explore comprehensive Airbnb analytics for Tannenheim, Mecklenburg-Vorpommern, Germany to uncover income potential. This 2026 STR market report for Tannenheim, based on AirROI data from February 2025 to January 2026, reveals key trends in the niche market of 48 active listings.
Whether you're considering an Airbnb investment in Tannenheim, optimizing your existing vacation rental, or exploring rental arbitrage opportunities, understanding the Tannenheim Airbnb data is crucial. Leveraging the low regulation environment is key to maximizing your short term rental income potential. Let's dive into the specifics.
Key Tannenheim Airbnb Performance Metrics Overview
Monthly Airbnb Revenue Variations & Income Potential in Tannenheim (2026)
Understanding the monthly revenue variations for Airbnb listings in Tannenheim is key to maximizing your short term rental income potential. Seasonality significantly impacts earnings. Our analysis, based on data from the past 12 months, shows that the peak revenue month for STRs in Tannenheim is typically August, while January often presents the lowest earnings, highlighting opportunities for strategic pricing adjustments during shoulder and low seasons. Explore the typical Airbnb income in Tannenheim across different performance tiers:
- Best-in-class properties (Top 10%) achieve $3,290+ monthly, often utilizing dynamic pricing and superior guest experiences.
- Strong performing properties (Top 25%) earn $2,101 or more, indicating effective management and desirable locations/amenities.
- Typical properties (Median) generate around $1,025 per month, representing the average market performance.
- Entry-level properties (Bottom 25%) see earnings around $463, often with potential for optimization.
Average Monthly Airbnb Earnings Trend in Tannenheim
Tannenheim Airbnb Occupancy Rate Trends (2026)
Maximize your bookings by understanding the Tannenheim STR occupancy trends. Seasonal demand shifts significantly influence how often properties are booked. Typically, Augustsees the highest demand (peak season occupancy), while January experiences the lowest (low season). Effective strategies, like adjusting minimum stays or offering promotions, can boost occupancy during slower periods. Here's how different property tiers perform in Tannenheim:
- Best-in-class properties (Top 10%) achieve 59%+ occupancy, indicating high desirability and potentially optimized availability.
- Strong performing properties (Top 25%) maintain 46% or higher occupancy, suggesting good market fit and guest satisfaction.
- Typical properties (Median) have an occupancy rate around 33%.
- Entry-level properties (Bottom 25%) average 17% occupancy, potentially facing higher vacancy.
Average Monthly Occupancy Rate Trend in Tannenheim
Average Daily Rate (ADR) Airbnb Trends in Tannenheim (2026)
Effective short term rental pricing strategy in Tannenheim involves understanding monthly ADR fluctuations. The Average Daily Rate (ADR) for Airbnb in Tannenheim typically peaks in December and dips lowest during March. Leveraging Airbnb dynamic pricing tools or strategies based on this seasonality can significantly boost revenue. Here's a look at the typical nightly rates achieved:
- Best-in-class properties (Top 10%) command rates of $217+ per night, often due to premium features or locations.
- Strong performing properties (Top 25%) achieve nightly rates of $141 or more.
- Typical properties (Median) charge around $93 per night.
- Entry-level properties (Bottom 25%) earn around $72 per night.
Average Daily Rate (ADR) Trend by Month in Tannenheim
Get Live Tannenheim Market Intelligence 👇

Explore Real-time Analytics
Airbnb Seasonality Analysis & Trends in Tannenheim (2026)
Peak Season (August, July, October)
- Revenue averages $2,306 per month
- Occupancy rates average 51.2%
- Daily rates average $128
Shoulder Season
- Revenue averages $1,355 per month
- Occupancy maintains around 30.5%
- Daily rates hold near $115
Low Season (January, May, November)
- Revenue drops to average $953 per month
- Occupancy decreases to average 19.9%
- Daily rates adjust to average $122
Seasonality Insights for Tannenheim
- The Airbnb seasonality in Tannenheim shows highly seasonal trends requiring careful strategy. While the sections above show seasonal averages, it's also insightful to look at the extremes:
- During the high season, the absolute peak month showcases Tannenheim's highest earning potential, with monthly revenues capable of climbing to $2,619, occupancy reaching a high of 63.7%, and ADRs peaking at $135.
- Conversely, the slowest single month of the year, typically falling within the low season, marks the market's lowest point. In this month, revenue might dip to $750, occupancy could drop to 13.6%, and ADRs may adjust down to $100.
- Understanding both the seasonal averages and these monthly peaks and troughs in revenue, occupancy, and ADR is crucial for maximizing your Airbnb profit potential in Tannenheim.
Seasonal Strategies for Maximizing Profit
- Peak Season: Maximize revenue through premium pricing and potentially longer minimum stays. Ensure high availability.
- Low Season: Offer competitive pricing, special promotions (e.g., extended stay discounts), and flexible cancellation policies. Target off-season travelers like remote workers or budget-conscious guests.
- Shoulder Seasons: Implement dynamic pricing that balances peak and low rates. Target weekend travelers or specific events. Offer slightly more flexible terms than peak season.
- Regularly analyze your own performance against these Tannenheim seasonality benchmarks and adjust your pricing and availability strategy accordingly.
Best Areas for Airbnb Investment in Tannenheim (2026)
Exploring the top neighborhoods for short-term rentals in Tannenheim? This section highlights key areas, outlining why they are attractive for hosts and guests, along with notable local attractions. Consider these locations based on your target guest profile and investment strategy.
| Neighborhood / Area | Why Host Here? (Target Guests & Appeal) | Key Attractions & Landmarks |
|---|---|---|
| Tannenheim Forest | A serene location surrounded by nature, ideal for those seeking tranquility and outdoor activities. Its proximity to hiking trails and the beautiful landscapes of Mecklenburg-Vorpommern attracts nature lovers and families alike. | Hiking Trails, Serene Lakes, Biking Paths, Nature Walks, Wildlife Watching |
| Rostock Stadtmitte | The downtown area of Rostock offers a charming blend of old and new, with historical sites and vibrant city life. This area attracts tourists exploring the rich culture and history of the region. | St. Mary's Church, Rostock Cultural History Museum, Kropeliner Straße, Rostock Zoo, Historic Market Square |
| Warnemünde Beach | A popular seaside resort known for its sandy beaches and seaside promenade, Warnemünde is ideal for tourists looking to enjoy beach life, water sports, and fresh seafood. | Warnemünde Lighthouse, Beach Promenade, Teepott, Seabridge, Water Sports Activities |
| Schwerin Old Town | Known for its stunning castle and historic architecture, Schwerin attracts tourists interested in culture, history, and art. A vibrant community with activities year-round. | Schwerin Castle, State Museum Schwerin, Garden of the Castle, Historic City Center, Schwerin Cathedral |
| Mecklenburger Seenplatte | A picturesque region with lakes and forests, perfect for outdoor enthusiasts. This area is known for boating, fishing, and nature exploration, appealing to families and nature lovers. | Lakes and Streams, Boating Tours, Fishing Spots, Nature Reserves, Biking Trails |
| Greifswald City | A university town with a youthful vibe, Greifswald offers a blend of academic life and cultural events, attracting both students and tourists interested in arts and sciences. | University of Greifswald, St. Nicholas Cathedral, Museum of Cultural History, Historic Market Square, Parks and Gardens |
| Stralsund Historic Center | A UNESCO World Heritage site known for its brick Gothic architecture and maritime history. It's a fascinating area for history buffs and tourists alike. | Stralsund Museum, St. Mary's Church, Ozeaneum, Historic Harbors, Rugen Bridge |
| Usedom Island | Famed for its beautiful beaches and spa resorts, Usedom offers a luxurious getaway for those looking to relax and unwind. It attracts both tourists and wellness seekers. | Ahlbeck Beach, Bansin Promenade, Usedom Island Spa Resorts, Historical Pier, Nature Reserves |
Understanding Airbnb License Requirements & STR Laws in Tannenheim (2026)
While Tannenheim, Mecklenburg-Vorpommern, Germany currently shows low STR regulations, specific Airbnb license requirements might still exist or change. Always verify the latest short term rental regulations and Airbnb license requirements directly with local government authorities for Tannenheim to ensure full compliance before hosting.
(Source: AirROI data, 2026, finding no licensed listings among those analyzed)
Top Performing Airbnb Properties in Tannenheim (2026)
Benchmark your potential! Explore examples of top-performing Airbnb properties in Tannenheimbased on Trailing Twelve Month (TTM) revenue. Analyze their characteristics, revenue, occupancy rate, and ADR to understand what drives success in this market.

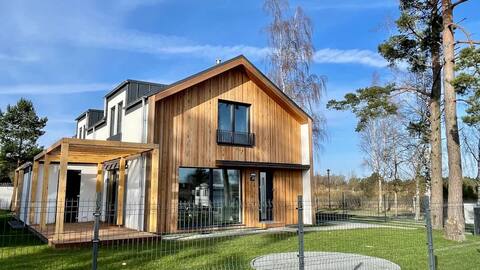
Thatched cottage country doctor - secluded location 3,000 m² property
Entire Place • 3 bedrooms
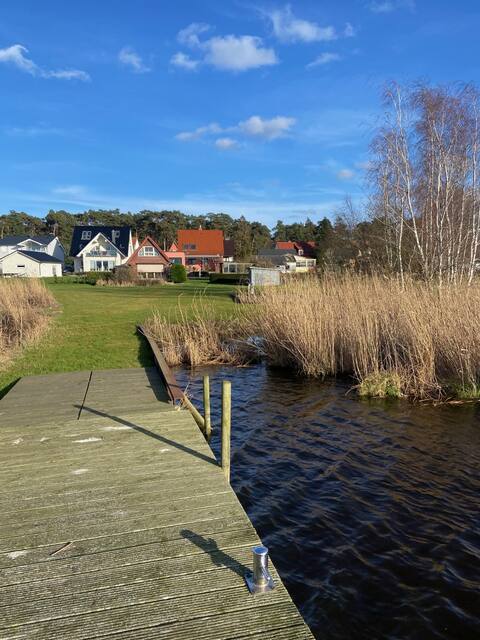
Large house right on the water
Entire Place • 4 bedrooms

Holiday Home SandDorn 2
Entire Place • 2 bedrooms
DarssAhoi 1A
Entire Place • 3 bedrooms

Holiday Home SandDorn 1
Entire Place • 1 bedroom

Crane Happiness
Entire Place • 2 bedrooms
Note: Performance varies based on location, size, amenities, seasonality, and management quality. Data reflects the past 12 months.
Top Performing Airbnb Hosts in Tannenheim (2026)
Learn from the best! This table showcases top-performing Airbnb hosts in Tannenheim based on the number of properties managed and estimated total revenue over the past year. Analyze their scale and performance metrics.
| Host Name | Properties | Grossing Revenue | Stay Reviews | Avg Rating |
|---|---|---|---|---|
| Favorent | 5 | $110,000 | 27 | 4.49/5.0 |
| Favorent | 3 | $85,085 | 48 | 4.82/5.0 |
| Ricky | 2 | $60,619 | 28 | 4.96/5.0 |
| Susanne | 1 | $41,803 | 23 | 5.00/5.0 |
| Simone | 1 | $26,201 | 24 | 4.88/5.0 |
| Harry | 5 | $25,048 | 82 | 4.33/5.0 |
| Yvonne | 2 | $21,594 | 9 | 5.00/5.0 |
| Sven | 1 | $17,218 | 50 | 4.94/5.0 |
| Ines | 6 | $16,326 | 116 | 4.40/5.0 |
| Holidu | 1 | $15,310 | 2 | Not Rated |
Analyzing the strategies of top hosts, such as their property selection, pricing, and guest communication, can offer valuable lessons for optimizing your own Airbnb operations in Tannenheim.
Dive Deeper: Advanced Tannenheim STR Market Data (2026)
Ready to unlock more insights? AirROI provides access to advanced metrics and comprehensive Airbnb data for Tannenheim. Explore detailed analytics beyond this report to refine your investment strategy, optimize pricing, and maximize your vacation rental profits.
Explore Advanced MetricsTannenheim Short-Term Rental Market Composition (2026): Property & Room Types
Room Type Distribution
Property Type Distribution
Market Composition Insights for Tannenheim
- The Tannenheim Airbnb market composition is heavily skewed towards Entire Home/Apt listings, which make up 89.6% of the 48 active rentals. This indicates strong guest preference for privacy and space.
- Looking at the property type distribution in Tannenheim, House properties are the most common (56.3%), reflecting the local real estate landscape.
- Houses represent a significant 56.3% portion, catering likely to families or larger groups.
- The presence of 8.3% Hotel/Boutique listings indicates integration with traditional hospitality.
- Smaller segments like outdoor/unique, others (combined 6.3%) offer potential for unique stay experiences.
Tannenheim Airbnb Room Capacity Analysis (2026): Bedroom Distribution
Distribution of Listings by Number of Bedrooms
Room Capacity Insights for Tannenheim
- The dominant room capacity in Tannenheim is 1 bedroom listings, making up 47.9% of the market. This suggests a strong demand for properties suitable for couples or solo travelers.
- Together, 1 bedroom and 2 bedrooms properties represent 75.0% of the active Airbnb listings in Tannenheim, indicating a high concentration in these sizes.
Tannenheim Vacation Rental Guest Capacity Trends (2026)
Distribution of Listings by Guest Capacity
Guest Capacity Insights for Tannenheim
- The most common guest capacity trend in Tannenheim vacation rentals is listings accommodating 2 guests (35.4%). This suggests the primary traveler segment is likely couples or solo travelers.
- Properties designed for 2 guests and 4 guests dominate the Tannenheim STR market, accounting for 70.8% of listings.
- 14.7% of properties accommodate 6+ guests, serving the market segment for larger families or group travel in Tannenheim.
- On average, properties in Tannenheim are equipped to host 3.4 guests.
Tannenheim Airbnb Booking Patterns (2026): Available vs. Booked Days
Available Days Distribution
Booked Days Distribution
Booking Pattern Insights for Tannenheim
- The most common availability pattern in Tannenheim falls within the 271-366 days range, representing 64.6% of listings. This suggests many properties have significant open periods on their calendars.
- Approximately 91.7% of listings show high availability (181+ days open annually), indicating potential for increased bookings or specific owner usage patterns.
- For booked days, the 31-90 days range is most frequent in Tannenheim (33.3%), reflecting common guest stay durations or potential owner blocking patterns.
- A notable 8.3% of properties secure long booking periods (181+ days booked per year), highlighting successful long-term rental strategies or significant owner usage.
Tannenheim Airbnb Minimum Stay Requirements Analysis
Distribution of Listings by Minimum Night Requirement
1 Night
2 listings
4.2% of total
2 Nights
2 listings
4.2% of total
3 Nights
5 listings
10.4% of total
4-6 Nights
15 listings
31.3% of total
30+ Nights
24 listings
50% of total
Key Insights
- The most prevalent minimum stay requirement in Tannenheim is 30+ Nights, adopted by 50% of listings. This highlights the market's preference for longer commitments.
- Very short stays (1-2 nights) are less common (8.4%), suggesting hosts prefer slightly longer bookings to optimize turnover.
- A significant segment (50%) caters to monthly stays (30+ nights) in Tannenheim, pointing to opportunities in the extended-stay market.
Recommendations
- Align with the market by considering a 30+ Nights minimum stay, as 50% of Tannenheim hosts use this setting.
- If feasible, allowing 1-night stays, especially midweek or during low season, could capture last-minute bookings, as only 4.2% currently do.
- Explore offering discounts for stays of 30+ nights to attract the 50% of the market seeking extended stays.
- Adjust minimum nights based on seasonality – potentially shorter during low season and longer during peak demand periods in Tannenheim.
Tannenheim Airbnb Cancellation Policy Trends Analysis (2026)
Super Strict 60 Days
2 listings
4.2% of total
Super Strict 30 Days
9 listings
18.8% of total
Flexible
5 listings
10.4% of total
Moderate
8 listings
16.7% of total
Firm
13 listings
27.1% of total
Strict
11 listings
22.9% of total
Cancellation Policy Insights for Tannenheim
- The prevailing Airbnb cancellation policy trend in Tannenheim is Firm, used by 27.1% of listings.
- There's a relatively balanced mix between guest-friendly (27.1%) and stricter (50.0%) policies, offering choices for different guest needs.
Recommendations for Hosts
- Consider adopting a Firm policy to align with the 27.1% market standard in Tannenheim.
- Regularly review your cancellation policy against competitors and market demand shifts in Tannenheim.
Tannenheim STR Booking Lead Time Analysis (2026)
Average Booking Lead Time by Month
Booking Lead Time Insights for Tannenheim
- The overall average booking lead time for vacation rentals in Tannenheim is 71 days.
- Guests book furthest in advance for stays during August (average 96 days), likely coinciding with peak travel demand or local events.
- The shortest booking windows occur for stays in February (average 12 days), indicating more last-minute travel plans during this time.
- Seasonally, Summer (93 days avg.) sees the longest lead times, while Winter (46 days avg.) has the shortest, reflecting typical travel planning cycles.
Recommendations for Hosts
- Use the overall average lead time (71 days) as a baseline for your pricing and availability strategy in Tannenheim.
- For August stays, consider implementing length-of-stay discounts or slightly higher rates for bookings made less than 96 days out to capitalize on advance planning.
- During February, focus on last-minute booking availability and promotions, as guests book with very short notice (12 days avg.).
- Target marketing efforts for the Summer season well in advance (at least 93 days) to capture early planners.
- Monitor your own booking lead times against these Tannenheim averages to identify opportunities for dynamic pricing adjustments.
Popular & Essential Airbnb Amenities in Tannenheim (2026)
Amenity Prevalence
Amenity Insights for Tannenheim
- Essential amenities in Tannenheim that guests expect include: Kitchen, Free parking on premises, TV, Wifi. Lacking these (any) could significantly impact bookings.
- Popular amenities like Heating, Refrigerator, Coffee maker are common but not universal. Offering these can provide a competitive edge.
Recommendations for Hosts
- Ensure your listing includes all essential amenities for Tannenheim: Kitchen, Free parking on premises, TV, Wifi.
- Prioritize adding missing essentials: Free parking on premises, TV, Wifi.
- Consider adding popular differentiators like Heating or Refrigerator to increase appeal.
- Highlight unique or less common amenities you offer (e.g., hot tub, dedicated workspace, EV charger) in your listing description and photos.
- Regularly check competitor amenities in Tannenheim to stay competitive.
Tannenheim Airbnb Guest Demographics & Profile Analysis (2026)
Guest Profile Summary for Tannenheim
- The typical guest profile for Airbnb in Tannenheim consists of primarily domestic travelers (91%), often arriving from nearby Berlin, typically belonging to the Post-2000s (Gen Z/Alpha) group (50%), primarily speaking German or English.
- Domestic travelers account for 90.5% of guests.
- Key international markets include Germany (90.5%) and United Kingdom (3.2%).
- Top languages spoken are German (42.7%) followed by English (38.2%).
- A significant demographic segment is the Post-2000s (Gen Z/Alpha) group, representing 50% of guests.
Recommendations for Hosts
- Target domestic marketing efforts towards travelers from Berlin and Dresden.
- Tailor amenities and listing descriptions to appeal to the dominant Post-2000s (Gen Z/Alpha) demographic (e.g., highlight fast WiFi, smart home features, local guides).
- Highlight unique local experiences or amenities relevant to the primary guest profile.
- Consider seasonal promotions aligned with peak travel times for key origin markets.
Nearby Short-Term Rental Market Comparison
How does the Tannenheim Airbnb market stack up against its neighbors? Compare key performance metrics like average monthly revenue, ADR, and occupancy rates in surrounding areas to understand the broader regional STR landscape.
| Market | Active Properties | Monthly Revenue | Daily Rate | Avg. Occupancy |
|---|---|---|---|---|
| Gallin-Kuppentin | 14 | $2,958 | $358.55 | 30% |
| Wittenbeck | 14 | $2,937 | $224.34 | 43% |
| Groß Nemerow | 13 | $2,404 | $135.17 | 60% |
| Heiligengrabe | 12 | $2,400 | $226.39 | 39% |
| Copenhagen | 9,111 | $2,347 | $222.94 | 52% |
| Råbylille Strand | 31 | $2,254 | $190.70 | 45% |
| Alt Sührkow | 10 | $2,175 | $426.32 | 28% |
| Frederiksberg | 1,015 | $2,062 | $217.28 | 50% |
| Solrød Strand | 54 | $2,032 | $249.51 | 48% |
| Hellerup | 11 | $1,973 | $298.07 | 51% |