Rambin Airbnb Market Analysis 2026: Short Term Rental Data & Vacation Rental Statistics in Mecklenburg-Vorpommern, Germany
Is Airbnb profitable in Rambin in 2026? Explore comprehensive Airbnb analytics for Rambin, Mecklenburg-Vorpommern, Germany to uncover income potential. This 2026 STR market report for Rambin, based on AirROI data from February 2025 to January 2026, reveals key trends in the niche market of 28 active listings.
Whether you're considering an Airbnb investment in Rambin, optimizing your existing vacation rental, or exploring rental arbitrage opportunities, understanding the Rambin Airbnb data is crucial. Leveraging the low regulation environment is key to maximizing your short term rental income potential. Let's dive into the specifics.
Key Rambin Airbnb Performance Metrics Overview
Monthly Airbnb Revenue Variations & Income Potential in Rambin (2026)
Understanding the monthly revenue variations for Airbnb listings in Rambin is key to maximizing your short term rental income potential. Seasonality significantly impacts earnings. Our analysis, based on data from the past 12 months, shows that the peak revenue month for STRs in Rambin is typically August, while January often presents the lowest earnings, highlighting opportunities for strategic pricing adjustments during shoulder and low seasons. Explore the typical Airbnb income in Rambin across different performance tiers:
- Best-in-class properties (Top 10%) achieve $2,494+ monthly, often utilizing dynamic pricing and superior guest experiences.
- Strong performing properties (Top 25%) earn $1,800 or more, indicating effective management and desirable locations/amenities.
- Typical properties (Median) generate around $1,144 per month, representing the average market performance.
- Entry-level properties (Bottom 25%) see earnings around $589, often with potential for optimization.
Average Monthly Airbnb Earnings Trend in Rambin
Rambin Airbnb Occupancy Rate Trends (2026)
Maximize your bookings by understanding the Rambin STR occupancy trends. Seasonal demand shifts significantly influence how often properties are booked. Typically, Augustsees the highest demand (peak season occupancy), while January experiences the lowest (low season). Effective strategies, like adjusting minimum stays or offering promotions, can boost occupancy during slower periods. Here's how different property tiers perform in Rambin:
- Best-in-class properties (Top 10%) achieve 63%+ occupancy, indicating high desirability and potentially optimized availability.
- Strong performing properties (Top 25%) maintain 49% or higher occupancy, suggesting good market fit and guest satisfaction.
- Typical properties (Median) have an occupancy rate around 32%.
- Entry-level properties (Bottom 25%) average 18% occupancy, potentially facing higher vacancy.
Average Monthly Occupancy Rate Trend in Rambin
Average Daily Rate (ADR) Airbnb Trends in Rambin (2026)
Effective short term rental pricing strategy in Rambin involves understanding monthly ADR fluctuations. The Average Daily Rate (ADR) for Airbnb in Rambin typically peaks in October and dips lowest during February. Leveraging Airbnb dynamic pricing tools or strategies based on this seasonality can significantly boost revenue. Here's a look at the typical nightly rates achieved:
- Best-in-class properties (Top 10%) command rates of $191+ per night, often due to premium features or locations.
- Strong performing properties (Top 25%) achieve nightly rates of $141 or more.
- Typical properties (Median) charge around $107 per night.
- Entry-level properties (Bottom 25%) earn around $82 per night.
Average Daily Rate (ADR) Trend by Month in Rambin
Get Live Rambin Market Intelligence 👇

Explore Real-time Analytics
Airbnb Seasonality Analysis & Trends in Rambin (2026)
Peak Season (August, July, June)
- Revenue averages $1,789 per month
- Occupancy rates average 51.5%
- Daily rates average $119
Shoulder Season
- Revenue averages $1,275 per month
- Occupancy maintains around 33.6%
- Daily rates hold near $118
Low Season (January, February, November)
- Revenue drops to average $804 per month
- Occupancy decreases to average 21.0%
- Daily rates adjust to average $117
Seasonality Insights for Rambin
- The Airbnb seasonality in Rambin shows highly seasonal trends requiring careful strategy. While the sections above show seasonal averages, it's also insightful to look at the extremes:
- During the high season, the absolute peak month showcases Rambin's highest earning potential, with monthly revenues capable of climbing to $2,061, occupancy reaching a high of 60.5%, and ADRs peaking at $126.
- Conversely, the slowest single month of the year, typically falling within the low season, marks the market's lowest point. In this month, revenue might dip to $438, occupancy could drop to 12.4%, and ADRs may adjust down to $107.
- Understanding both the seasonal averages and these monthly peaks and troughs in revenue, occupancy, and ADR is crucial for maximizing your Airbnb profit potential in Rambin.
Seasonal Strategies for Maximizing Profit
- Peak Season: Maximize revenue through premium pricing and potentially longer minimum stays. Ensure high availability.
- Low Season: Offer competitive pricing, special promotions (e.g., extended stay discounts), and flexible cancellation policies. Target off-season travelers like remote workers or budget-conscious guests.
- Shoulder Seasons: Implement dynamic pricing that balances peak and low rates. Target weekend travelers or specific events. Offer slightly more flexible terms than peak season.
- Regularly analyze your own performance against these Rambin seasonality benchmarks and adjust your pricing and availability strategy accordingly.
Best Areas for Airbnb Investment in Rambin (2026)
Exploring the top neighborhoods for short-term rentals in Rambin? This section highlights key areas, outlining why they are attractive for hosts and guests, along with notable local attractions. Consider these locations based on your target guest profile and investment strategy.
| Neighborhood / Area | Why Host Here? (Target Guests & Appeal) | Key Attractions & Landmarks |
|---|---|---|
| Rambin Beach | A serene beach area on the Ruegen Island known for its picturesque coastline and peaceful atmosphere. Attracts vacationers looking for a relaxing beach retreat. | Rambin Beach, Rügen Island, Jasmund National Park, Binz Beach, Schönberg Beach, Rambins Casino |
| Binz | The largest seaside resort on the Island of Rügen, known for its beautiful beaches and historic architecture. A favored destination for families and beach lovers. | Binz Beach, Kurhaus Binz, Rügen Railway, Dune Boardwalk, Beach promenade, Pier of Binz |
| Sassnitz | A charming coastal town famous for its proximity to the Jasmund National Park and its stunning cliffs. Ideal for nature lovers and adventurers. | Jasmund National Park, Königsstuhl Cliff, Sassnitz harbor, Hiking trails, Museum of the 1950s, U-Boat Museum |
| Sellin | Known for its iconic pier and historic seaside promenade. Popular with tourists seeking a traditional seaside holiday experience. | Sellin Pier, Sellin Beach, Amber Museum, Schmachter Lake, Granitz Hunting Lodge, Sellin Seaside Promenade |
| Putbus | A historic spa town on Rügen Island, known for its beautiful parks and classical architecture. Attractive for cultural tourism. | Putbus Theater, Circus Putbus, Rügen Gallery, Park Putbus, Putbus Castle, Rügensche Kleinbahn |
| Baabe | A quaint seaside resort offering family-friendly beaches and a relaxed atmosphere. Great for those looking for a quiet getaway. | Baabe Beach, Baaber Heide Nature Trail, Amber Museum, Local shops and cafés, Hiking trails around the village, Baabe Bridge |
| Göhren | A popular holiday destination with a great balance of nature and beach, ideal for families and campers. | Göhren Beach, Nordperd Cliff, Rügen Adventure Park, Hiking trails, Göhren local shops, Seaside promenade |
| Lauterbach | A picturesque harbor town with access to ferry services to nearby islands. Perfect for water sports enthusiasts and tourists exploring Rügen. | Lauterbach Marina, Rügen Ferry Service, Local seafood restaurants, Water sports activities, Scenic waterfront walks, Nature trails nearby |
Understanding Airbnb License Requirements & STR Laws in Rambin (2026)
While Rambin, Mecklenburg-Vorpommern, Germany currently shows low STR regulations, specific Airbnb license requirements might still exist or change. Always verify the latest short term rental regulations and Airbnb license requirements directly with local government authorities for Rambin to ensure full compliance before hosting.
(Source: AirROI data, 2026, finding no licensed listings among those analyzed)
Top Performing Airbnb Properties in Rambin (2026)
Benchmark your potential! Explore examples of top-performing Airbnb properties in Rambinbased on Trailing Twelve Month (TTM) revenue. Analyze their characteristics, revenue, occupancy rate, and ADR to understand what drives success in this market.

Gurvitz vacation home
Entire Place • 1 bedroom

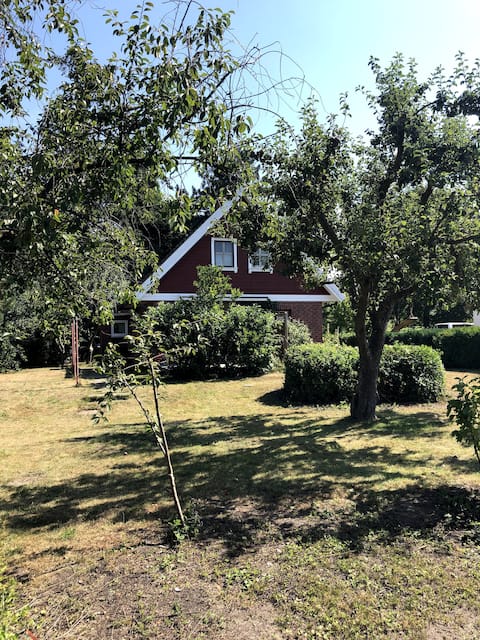
Wonderful house with 4000 sqm natural garden
Entire Place • 2 bedrooms
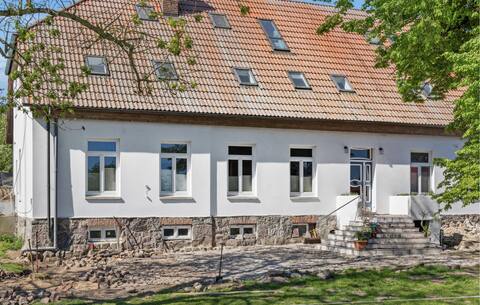
House Beachcombing
Entire Place • 3 bedrooms
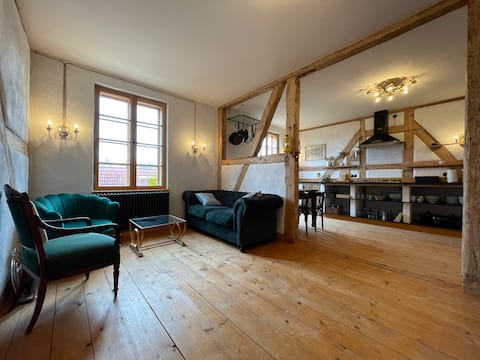
the pearl | Gutshaus Bückling
Entire Place • 2 bedrooms
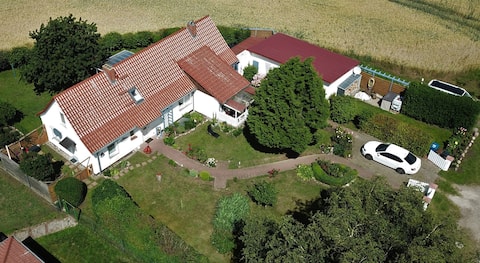
Vacation home Nicole
Entire Place • 2 bedrooms
Starboard bungalow
Entire Place • 1 bedroom
Note: Performance varies based on location, size, amenities, seasonality, and management quality. Data reflects the past 12 months.
Top Performing Airbnb Hosts in Rambin (2026)
Learn from the best! This table showcases top-performing Airbnb hosts in Rambin based on the number of properties managed and estimated total revenue over the past year. Analyze their scale and performance metrics.
| Host Name | Properties | Grossing Revenue | Stay Reviews | Avg Rating |
|---|---|---|---|---|
| Karsten | 4 | $62,173 | 10 | 5.00/5.0 |
| Mirko | 2 | $29,102 | 51 | 4.92/5.0 |
| Monika | 2 | $28,035 | 116 | 4.93/5.0 |
| Matz | 1 | $22,111 | 59 | 4.97/5.0 |
| Axel | 1 | $20,417 | 66 | 4.71/5.0 |
| Falk | 1 | $19,969 | 30 | 4.83/5.0 |
| Novasol | 1 | $19,414 | 3 | 4.67/5.0 |
| Anja | 4 | $16,801 | 101 | 4.79/5.0 |
| Tobias | 1 | $12,604 | 39 | 4.67/5.0 |
| Antje | 1 | $11,985 | 7 | 5.00/5.0 |
Analyzing the strategies of top hosts, such as their property selection, pricing, and guest communication, can offer valuable lessons for optimizing your own Airbnb operations in Rambin.
Dive Deeper: Advanced Rambin STR Market Data (2026)
Ready to unlock more insights? AirROI provides access to advanced metrics and comprehensive Airbnb data for Rambin. Explore detailed analytics beyond this report to refine your investment strategy, optimize pricing, and maximize your vacation rental profits.
Explore Advanced MetricsRambin Short-Term Rental Market Composition (2026): Property & Room Types
Room Type Distribution
Property Type Distribution
Market Composition Insights for Rambin
- The Rambin Airbnb market composition is heavily skewed towards Entire Home/Apt listings, which make up 100% of the 28 active rentals. This indicates strong guest preference for privacy and space.
- Looking at the property type distribution in Rambin, Apartment/Condo properties are the most common (71.4%), reflecting the local real estate landscape.
- Houses represent a significant 17.9% portion, catering likely to families or larger groups.
- Smaller segments like hotel/boutique (combined 3.6%) offer potential for unique stay experiences.
Rambin Airbnb Room Capacity Analysis (2026): Bedroom Distribution
Distribution of Listings by Number of Bedrooms
Room Capacity Insights for Rambin
- The dominant room capacity in Rambin is 2 bedrooms listings, making up 53.6% of the market. This suggests a strong demand for properties suitable for couples or solo travelers.
- Together, 2 bedrooms and 1 bedroom properties represent 96.5% of the active Airbnb listings in Rambin, indicating a high concentration in these sizes.
- Listings with 3+ bedrooms (3.6%) represent a smaller niche, potentially indicating an underserved market for larger group accommodations in Rambin.
Rambin Vacation Rental Guest Capacity Trends (2026)
Distribution of Listings by Guest Capacity
Guest Capacity Insights for Rambin
- The most common guest capacity trend in Rambin vacation rentals is listings accommodating 4 guests (53.6%). This suggests the primary traveler segment is likely small families or groups.
- Properties designed for 4 guests and 2 guests dominate the Rambin STR market, accounting for 75.0% of listings.
- Listings for large groups (6+ guests) are relatively rare (3.6%), potentially indicating an opportunity for hosts targeting this segment in Rambin.
- On average, properties in Rambin are equipped to host 3.6 guests.
Rambin Airbnb Booking Patterns (2026): Available vs. Booked Days
Available Days Distribution
Booked Days Distribution
Booking Pattern Insights for Rambin
- The most common availability pattern in Rambin falls within the 271-366 days range, representing 64.3% of listings. This suggests many properties have significant open periods on their calendars.
- Approximately 96.4% of listings show high availability (181+ days open annually), indicating potential for increased bookings or specific owner usage patterns.
- For booked days, the 31-90 days range is most frequent in Rambin (42.9%), reflecting common guest stay durations or potential owner blocking patterns.
- A notable 10.7% of properties secure long booking periods (181+ days booked per year), highlighting successful long-term rental strategies or significant owner usage.
Rambin Airbnb Minimum Stay Requirements Analysis
Distribution of Listings by Minimum Night Requirement
3 Nights
3 listings
10.7% of total
4-6 Nights
14 listings
50% of total
7-29 Nights
1 listings
3.6% of total
30+ Nights
10 listings
35.7% of total
Key Insights
- The most prevalent minimum stay requirement in Rambin is 4-6 Nights, adopted by 50% of listings. This highlights the market's preference for longer commitments.
- A significant segment (35.7%) caters to monthly stays (30+ nights) in Rambin, pointing to opportunities in the extended-stay market.
Recommendations
- Align with the market by considering a 4-6 Nights minimum stay, as 50% of Rambin hosts use this setting.
- Explore offering discounts for stays of 30+ nights to attract the 35.7% of the market seeking extended stays.
- Adjust minimum nights based on seasonality – potentially shorter during low season and longer during peak demand periods in Rambin.
Rambin Airbnb Cancellation Policy Trends Analysis (2026)
Super Strict 30 Days
1 listings
3.6% of total
Super Strict 60 Days
1 listings
3.6% of total
Limited
1 listings
3.6% of total
Flexible
1 listings
3.6% of total
Moderate
6 listings
21.4% of total
Firm
13 listings
46.4% of total
Strict
5 listings
17.9% of total
Cancellation Policy Insights for Rambin
- The prevailing Airbnb cancellation policy trend in Rambin is Firm, used by 46.4% of listings.
- A majority (64.3%) of hosts in Rambin utilize Firm or Strict policies, indicating a market where hosts prioritize booking security.
Recommendations for Hosts
- Consider adopting a Firm policy to align with the 46.4% market standard in Rambin.
- Regularly review your cancellation policy against competitors and market demand shifts in Rambin.
Rambin STR Booking Lead Time Analysis (2026)
Average Booking Lead Time by Month
Booking Lead Time Insights for Rambin
- The overall average booking lead time for vacation rentals in Rambin is 48 days.
- Guests book furthest in advance for stays during August (average 95 days), likely coinciding with peak travel demand or local events.
- The shortest booking windows occur for stays in March (average 6 days), indicating more last-minute travel plans during this time.
- Seasonally, Summer (75 days avg.) sees the longest lead times, while Spring (33 days avg.) has the shortest, reflecting typical travel planning cycles.
Recommendations for Hosts
- Use the overall average lead time (48 days) as a baseline for your pricing and availability strategy in Rambin.
- For August stays, consider implementing length-of-stay discounts or slightly higher rates for bookings made less than 95 days out to capitalize on advance planning.
- During March, focus on last-minute booking availability and promotions, as guests book with very short notice (6 days avg.).
- Target marketing efforts for the Summer season well in advance (at least 75 days) to capture early planners.
- Monitor your own booking lead times against these Rambin averages to identify opportunities for dynamic pricing adjustments.
Popular & Essential Airbnb Amenities in Rambin (2026)
Amenity Prevalence
Amenity Insights for Rambin
- Essential amenities in Rambin that guests expect include: Smoke alarm, Kitchen. Lacking these (any) could significantly impact bookings.
- Popular amenities like Hot water, Free parking on premises, Dishes and silverware are common but not universal. Offering these can provide a competitive edge.
- Warning: Wifi is not universally provided but is considered essential globally. Ensure reliable Wifi is offered.
Recommendations for Hosts
- Ensure your listing includes all essential amenities for Rambin: Smoke alarm, Kitchen.
- Prioritize adding missing essentials: Kitchen.
- Consider adding popular differentiators like Hot water or Free parking on premises to increase appeal.
- Highlight unique or less common amenities you offer (e.g., hot tub, dedicated workspace, EV charger) in your listing description and photos.
- Regularly check competitor amenities in Rambin to stay competitive.
Rambin Airbnb Guest Demographics & Profile Analysis (2026)
Guest Profile Summary for Rambin
- The typical guest profile for Airbnb in Rambin consists of primarily domestic travelers (66%), often arriving from nearby Berlin, typically belonging to the Post-2000s (Gen Z/Alpha) group (50%), primarily speaking English or German.
- Domestic travelers account for 65.5% of guests.
- Key international markets include Germany (65.5%) and Netherlands (14.5%).
- Top languages spoken are English (40%) followed by German (33.8%).
- A significant demographic segment is the Post-2000s (Gen Z/Alpha) group, representing 50% of guests.
Recommendations for Hosts
- Target domestic marketing efforts towards travelers from Berlin and Leipzig.
- Tailor amenities and listing descriptions to appeal to the dominant Post-2000s (Gen Z/Alpha) demographic (e.g., highlight fast WiFi, smart home features, local guides).
- Highlight unique local experiences or amenities relevant to the primary guest profile.
- Consider seasonal promotions aligned with peak travel times for key origin markets.
Nearby Short-Term Rental Market Comparison
How does the Rambin Airbnb market stack up against its neighbors? Compare key performance metrics like average monthly revenue, ADR, and occupancy rates in surrounding areas to understand the broader regional STR landscape.
| Market | Active Properties | Monthly Revenue | Daily Rate | Avg. Occupancy |
|---|---|---|---|---|
| Gallin-Kuppentin | 14 | $2,958 | $358.55 | 30% |
| Luckow | 18 | $2,751 | $265.42 | 40% |
| Groß Nemerow | 13 | $2,404 | $135.17 | 60% |
| Heiligengrabe | 12 | $2,400 | $226.39 | 39% |
| Copenhagen | 9,111 | $2,347 | $222.94 | 52% |
| Råbylille Strand | 31 | $2,254 | $190.70 | 45% |
| Tejn | 60 | $2,181 | $275.98 | 43% |
| Alt Sührkow | 10 | $2,175 | $426.32 | 28% |
| Zastań | 28 | $2,135 | $265.12 | 34% |
| Vogelsang-Warsin | 11 | $2,123 | $227.20 | 35% |