Putbus Airbnb Market Analysis 2026: Short Term Rental Data & Vacation Rental Statistics in Mecklenburg-Vorpommern, Germany
Is Airbnb profitable in Putbus in 2026? Explore comprehensive Airbnb analytics for Putbus, Mecklenburg-Vorpommern, Germany to uncover income potential. This 2026 STR market report for Putbus, based on AirROI data from February 2025 to January 2026, reveals key trends in the niche market of 95 active listings.
Whether you're considering an Airbnb investment in Putbus, optimizing your existing vacation rental, or exploring rental arbitrage opportunities, understanding the Putbus Airbnb data is crucial. Leveraging the low regulation environment is key to maximizing your short term rental income potential. Let's dive into the specifics.
Key Putbus Airbnb Performance Metrics Overview
Monthly Airbnb Revenue Variations & Income Potential in Putbus (2026)
Understanding the monthly revenue variations for Airbnb listings in Putbus is key to maximizing your short term rental income potential. Seasonality significantly impacts earnings. Our analysis, based on data from the past 12 months, shows that the peak revenue month for STRs in Putbus is typically August, while January often presents the lowest earnings, highlighting opportunities for strategic pricing adjustments during shoulder and low seasons. Explore the typical Airbnb income in Putbus across different performance tiers:
- Best-in-class properties (Top 10%) achieve $2,582+ monthly, often utilizing dynamic pricing and superior guest experiences.
- Strong performing properties (Top 25%) earn $1,575 or more, indicating effective management and desirable locations/amenities.
- Typical properties (Median) generate around $857 per month, representing the average market performance.
- Entry-level properties (Bottom 25%) see earnings around $406, often with potential for optimization.
Average Monthly Airbnb Earnings Trend in Putbus
Putbus Airbnb Occupancy Rate Trends (2026)
Maximize your bookings by understanding the Putbus STR occupancy trends. Seasonal demand shifts significantly influence how often properties are booked. Typically, Augustsees the highest demand (peak season occupancy), while January experiences the lowest (low season). Effective strategies, like adjusting minimum stays or offering promotions, can boost occupancy during slower periods. Here's how different property tiers perform in Putbus:
- Best-in-class properties (Top 10%) achieve 64%+ occupancy, indicating high desirability and potentially optimized availability.
- Strong performing properties (Top 25%) maintain 45% or higher occupancy, suggesting good market fit and guest satisfaction.
- Typical properties (Median) have an occupancy rate around 24%.
- Entry-level properties (Bottom 25%) average 10% occupancy, potentially facing higher vacancy.
Average Monthly Occupancy Rate Trend in Putbus
Average Daily Rate (ADR) Airbnb Trends in Putbus (2026)
Effective short term rental pricing strategy in Putbus involves understanding monthly ADR fluctuations. The Average Daily Rate (ADR) for Airbnb in Putbus typically peaks in September and dips lowest during February. Leveraging Airbnb dynamic pricing tools or strategies based on this seasonality can significantly boost revenue. Here's a look at the typical nightly rates achieved:
- Best-in-class properties (Top 10%) command rates of $222+ per night, often due to premium features or locations.
- Strong performing properties (Top 25%) achieve nightly rates of $173 or more.
- Typical properties (Median) charge around $134 per night.
- Entry-level properties (Bottom 25%) earn around $100 per night.
Average Daily Rate (ADR) Trend by Month in Putbus
Get Live Putbus Market Intelligence 👇

Explore Real-time Analytics
Airbnb Seasonality Analysis & Trends in Putbus (2026)
Peak Season (August, July, June)
- Revenue averages $1,749 per month
- Occupancy rates average 41.0%
- Daily rates average $155
Shoulder Season
- Revenue averages $1,087 per month
- Occupancy maintains around 30.4%
- Daily rates hold near $138
Low Season (January, November, December)
- Revenue drops to average $712 per month
- Occupancy decreases to average 18.4%
- Daily rates adjust to average $150
Seasonality Insights for Putbus
- The Airbnb seasonality in Putbus shows highly seasonal trends requiring careful strategy. While the sections above show seasonal averages, it's also insightful to look at the extremes:
- During the high season, the absolute peak month showcases Putbus's highest earning potential, with monthly revenues capable of climbing to $1,952, occupancy reaching a high of 45.2%, and ADRs peaking at $161.
- Conversely, the slowest single month of the year, typically falling within the low season, marks the market's lowest point. In this month, revenue might dip to $575, occupancy could drop to 15.9%, and ADRs may adjust down to $124.
- Understanding both the seasonal averages and these monthly peaks and troughs in revenue, occupancy, and ADR is crucial for maximizing your Airbnb profit potential in Putbus.
Seasonal Strategies for Maximizing Profit
- Peak Season: Maximize revenue through premium pricing and potentially longer minimum stays. Ensure high availability.
- Low Season: Offer competitive pricing, special promotions (e.g., extended stay discounts), and flexible cancellation policies. Target off-season travelers like remote workers or budget-conscious guests.
- Shoulder Seasons: Implement dynamic pricing that balances peak and low rates. Target weekend travelers or specific events. Offer slightly more flexible terms than peak season.
- Regularly analyze your own performance against these Putbus seasonality benchmarks and adjust your pricing and availability strategy accordingly.
Best Areas for Airbnb Investment in Putbus (2026)
Exploring the top neighborhoods for short-term rentals in Putbus? This section highlights key areas, outlining why they are attractive for hosts and guests, along with notable local attractions. Consider these locations based on your target guest profile and investment strategy.
| Neighborhood / Area | Why Host Here? (Target Guests & Appeal) | Key Attractions & Landmarks |
|---|---|---|
| Putbus Historic Town | Charming town known for its classic architecture and the nearby circus shaped landscape gardens. Great for guests interested in historical sites and peaceful surroundings. | Putbus Theater, Circus Putbus, Rugard Nature Trail, Putbus Castle, St. Jacob's Church |
| Baltic Sea Coast | Beautiful coastline offering stunning beaches and water activities. Perfect for summer vacationers and those seeking relaxation by the sea. | Prorer Wiek Beach, Binz Beach, Sellin Pier, Rügen Island activities, Mönchgut Nature Reserve |
| Granitz Nature Reserve | A nature lover's paradise with dense beech forests and hiking trails. Attracts outdoor enthusiasts and families looking for nature excursions. | Granitz Hunting Lodge, Hiking Trails, Biking Routes, Wildlife Watching, Observation Tower |
| Rügen Island | Germany's largest island with diverse landscapes, beaches, and attractions. Ideal for tourists looking to explore natural and historical sites. | Jasmund National Park, Königsstuhl Cliffs, Sassnitz Old Town, Cape Arkona, Sellin Shore |
| Putbus Zoo | A local attraction that is great for families and those looking for fun activities with children. Offers a variety of animal displays in a scenic park. | Putbus Zoo, Animal Encounters, Play Areas, Picnic Spaces |
| Monte Vannin | A unique park area featuring artificial hilltops that offer great views. It’s a nice spot for relaxation and panoramic views. | Monte Vannin Park, Viewpoints, Walking Paths |
| Selliner See | A picturesque lake popular with nature lovers and those looking for recreational activities such as kayaking and fishing. | Lake Activities, Scenic Views, Walking Trails |
| Putbus Maritime Museum | Attracts visitors interested in maritime history and local heritage. A good spot for education and cultural experiences. | Museum Exhibits, Historical Ships, Local Art Displays |
Understanding Airbnb License Requirements & STR Laws in Putbus (2026)
While Putbus, Mecklenburg-Vorpommern, Germany currently shows low STR regulations, specific Airbnb license requirements might still exist or change. Always verify the latest short term rental regulations and Airbnb license requirements directly with local government authorities for Putbus to ensure full compliance before hosting.
(Source: AirROI data, 2026, based on 6% licensed listings)
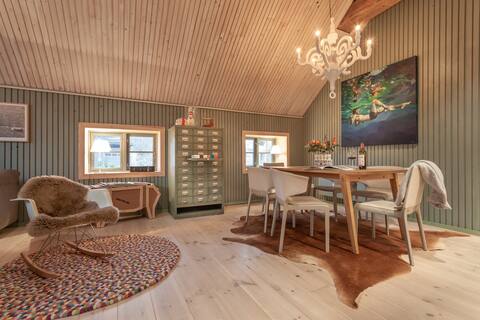
Top Performing Airbnb Properties in Putbus (2026)
Benchmark your potential! Explore examples of top-performing Airbnb properties in Putbusbased on Trailing Twelve Month (TTM) revenue. Analyze their characteristics, revenue, occupancy rate, and ADR to understand what drives success in this market.

Your home on Rügen
Entire Place • 1 bedroom
i l s e . dein landloft
Entire Place • 2 bedrooms
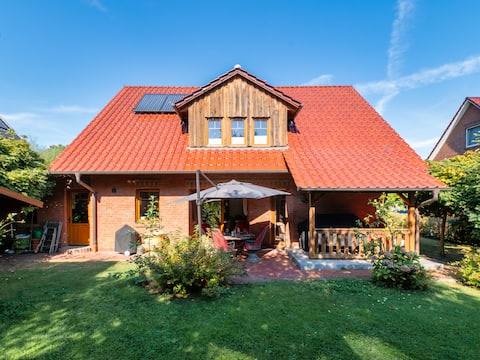
Vacation home "Großer Vilm" – peace and space for everyone!
Entire Place • 4 bedrooms
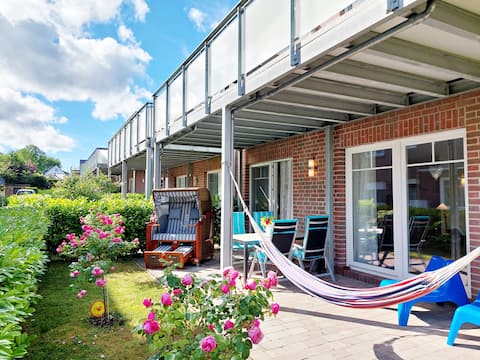
Windrose Lauterbach: harbor flair, large terrace
Entire Place • 2 bedrooms

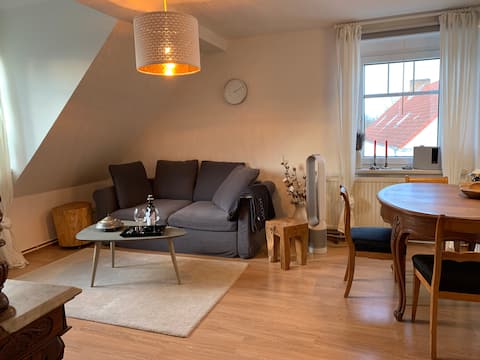
Small chamber: country vacation by the sea | Rügen
Entire Place • 2 bedrooms
FeWo Inselfrisch - right by the harbor - perfect for two
Entire Place • 1 bedroom
Note: Performance varies based on location, size, amenities, seasonality, and management quality. Data reflects the past 12 months.
Top Performing Airbnb Hosts in Putbus (2026)
Learn from the best! This table showcases top-performing Airbnb hosts in Putbus based on the number of properties managed and estimated total revenue over the past year. Analyze their scale and performance metrics.
| Host Name | Properties | Grossing Revenue | Stay Reviews | Avg Rating |
|---|---|---|---|---|
| Rügener | 8 | $57,747 | 15 | 4.13/5.0 |
| Artur | 2 | $52,614 | 35 | 4.86/5.0 |
| Susann | 8 | $48,243 | 61 | 4.96/5.0 |
| Matteo | 1 | $40,876 | 72 | 4.89/5.0 |
| Elisa | 2 | $36,833 | 54 | 4.83/5.0 |
| Maike | 1 | $36,035 | 130 | 4.98/5.0 |
| Bettina & Florian | 1 | $30,614 | 204 | 4.93/5.0 |
| Eva-Maria | 1 | $26,240 | 77 | 4.94/5.0 |
| Manja | 1 | $22,994 | 131 | 4.82/5.0 |
| Laurent | 1 | $22,172 | 7 | 4.86/5.0 |
Analyzing the strategies of top hosts, such as their property selection, pricing, and guest communication, can offer valuable lessons for optimizing your own Airbnb operations in Putbus.
Dive Deeper: Advanced Putbus STR Market Data (2026)
Ready to unlock more insights? AirROI provides access to advanced metrics and comprehensive Airbnb data for Putbus. Explore detailed analytics beyond this report to refine your investment strategy, optimize pricing, and maximize your vacation rental profits.
Explore Advanced MetricsPutbus Short-Term Rental Market Composition (2026): Property & Room Types
Room Type Distribution
Property Type Distribution
Market Composition Insights for Putbus
- The Putbus Airbnb market composition is heavily skewed towards Entire Home/Apt listings, which make up 94.7% of the 95 active rentals. This indicates strong guest preference for privacy and space.
- Looking at the property type distribution in Putbus, Apartment/Condo properties are the most common (75.8%), reflecting the local real estate landscape.
- Houses represent a significant 17.9% portion, catering likely to families or larger groups.
- The presence of 5.3% Hotel/Boutique listings indicates integration with traditional hospitality.
- Smaller segments like others (combined 1.1%) offer potential for unique stay experiences.
Putbus Airbnb Room Capacity Analysis (2026): Bedroom Distribution
Distribution of Listings by Number of Bedrooms
Room Capacity Insights for Putbus
- The dominant room capacity in Putbus is 1 bedroom listings, making up 53.7% of the market. This suggests a strong demand for properties suitable for couples or solo travelers.
- Together, 1 bedroom and 2 bedrooms properties represent 85.3% of the active Airbnb listings in Putbus, indicating a high concentration in these sizes.
- With over half the market (53.7%) consisting of studios or 1-bedroom units, Putbus is particularly well-suited for individuals or couples.
Putbus Vacation Rental Guest Capacity Trends (2026)
Distribution of Listings by Guest Capacity
Guest Capacity Insights for Putbus
- The most common guest capacity trend in Putbus vacation rentals is listings accommodating 4 guests (37.9%). This suggests the primary traveler segment is likely small families or groups.
- Properties designed for 4 guests and 2 guests dominate the Putbus STR market, accounting for 68.4% of listings.
- 12.7% of properties accommodate 6+ guests, serving the market segment for larger families or group travel in Putbus.
- On average, properties in Putbus are equipped to host 3.7 guests.
Putbus Airbnb Booking Patterns (2026): Available vs. Booked Days
Available Days Distribution
Booked Days Distribution
Booking Pattern Insights for Putbus
- The most common availability pattern in Putbus falls within the 271-366 days range, representing 76.8% of listings. This suggests many properties have significant open periods on their calendars.
- Approximately 94.7% of listings show high availability (181+ days open annually), indicating potential for increased bookings or specific owner usage patterns.
- For booked days, the 1-30 days range is most frequent in Putbus (43.2%), reflecting common guest stay durations or potential owner blocking patterns.
- A notable 5.3% of properties secure long booking periods (181+ days booked per year), highlighting successful long-term rental strategies or significant owner usage.
Putbus Airbnb Minimum Stay Requirements Analysis
Distribution of Listings by Minimum Night Requirement
1 Night
5 listings
5.3% of total
2 Nights
7 listings
7.4% of total
3 Nights
7 listings
7.4% of total
4-6 Nights
16 listings
16.8% of total
7-29 Nights
2 listings
2.1% of total
30+ Nights
58 listings
61.1% of total
Key Insights
- The most prevalent minimum stay requirement in Putbus is 30+ Nights, adopted by 61.1% of listings. This highlights the market's preference for longer commitments.
- Very short stays (1-2 nights) are less common (12.7%), suggesting hosts prefer slightly longer bookings to optimize turnover.
- A significant segment (61.1%) caters to monthly stays (30+ nights) in Putbus, pointing to opportunities in the extended-stay market.
Recommendations
- Align with the market by considering a 30+ Nights minimum stay, as 61.1% of Putbus hosts use this setting.
- If feasible, allowing 1-night stays, especially midweek or during low season, could capture last-minute bookings, as only 5.3% currently do.
- Explore offering discounts for stays of 30+ nights to attract the 61.1% of the market seeking extended stays.
- Adjust minimum nights based on seasonality – potentially shorter during low season and longer during peak demand periods in Putbus.
Putbus Airbnb Cancellation Policy Trends Analysis (2026)
Super Strict 30 Days
14 listings
14.7% of total
Flexible
3 listings
3.2% of total
Moderate
12 listings
12.6% of total
Firm
51 listings
53.7% of total
Strict
15 listings
15.8% of total
Cancellation Policy Insights for Putbus
- The prevailing Airbnb cancellation policy trend in Putbus is Firm, used by 53.7% of listings.
- A majority (69.5%) of hosts in Putbus utilize Firm or Strict policies, indicating a market where hosts prioritize booking security.
Recommendations for Hosts
- Consider adopting a Firm policy to align with the 53.7% market standard in Putbus.
- Regularly review your cancellation policy against competitors and market demand shifts in Putbus.
Putbus STR Booking Lead Time Analysis (2026)
Average Booking Lead Time by Month
Booking Lead Time Insights for Putbus
- The overall average booking lead time for vacation rentals in Putbus is 75 days.
- Guests book furthest in advance for stays during August (average 93 days), likely coinciding with peak travel demand or local events.
- The shortest booking windows occur for stays in February (average 18 days), indicating more last-minute travel plans during this time.
- Seasonally, Summer (87 days avg.) sees the longest lead times, while Winter (39 days avg.) has the shortest, reflecting typical travel planning cycles.
Recommendations for Hosts
- Use the overall average lead time (75 days) as a baseline for your pricing and availability strategy in Putbus.
- For August stays, consider implementing length-of-stay discounts or slightly higher rates for bookings made less than 93 days out to capitalize on advance planning.
- Target marketing efforts for the Summer season well in advance (at least 87 days) to capture early planners.
- Monitor your own booking lead times against these Putbus averages to identify opportunities for dynamic pricing adjustments.
Popular & Essential Airbnb Amenities in Putbus (2026)
Amenity Prevalence
Amenity Insights for Putbus
- Popular amenities like TV, Free parking on premises, Refrigerator are common but not universal. Offering these can provide a competitive edge.
- Warning: Wifi is not universally provided but is considered essential globally. Ensure reliable Wifi is offered.
Recommendations for Hosts
- Consider adding popular differentiators like TV or Free parking on premises to increase appeal.
- Highlight unique or less common amenities you offer (e.g., hot tub, dedicated workspace, EV charger) in your listing description and photos.
- Regularly check competitor amenities in Putbus to stay competitive.
Putbus Airbnb Guest Demographics & Profile Analysis (2026)
Guest Profile Summary for Putbus
- The typical guest profile for Airbnb in Putbus consists of primarily domestic travelers (77%), often arriving from nearby Berlin, typically belonging to the Post-2000s (Gen Z/Alpha) group (50%), primarily speaking English or German.
- Domestic travelers account for 76.5% of guests.
- Key international markets include Germany (76.5%) and Netherlands (5.6%).
- Top languages spoken are English (37.8%) followed by German (35.2%).
- A significant demographic segment is the Post-2000s (Gen Z/Alpha) group, representing 50% of guests.
Recommendations for Hosts
- Target domestic marketing efforts towards travelers from Berlin and Hamburg.
- Tailor amenities and listing descriptions to appeal to the dominant Post-2000s (Gen Z/Alpha) demographic (e.g., highlight fast WiFi, smart home features, local guides).
- Highlight unique local experiences or amenities relevant to the primary guest profile.
- Consider seasonal promotions aligned with peak travel times for key origin markets.
Nearby Short-Term Rental Market Comparison
How does the Putbus Airbnb market stack up against its neighbors? Compare key performance metrics like average monthly revenue, ADR, and occupancy rates in surrounding areas to understand the broader regional STR landscape.
| Market | Active Properties | Monthly Revenue | Daily Rate | Avg. Occupancy |
|---|---|---|---|---|
| Gallin-Kuppentin | 14 | $2,958 | $358.55 | 30% |
| Luckow | 18 | $2,751 | $265.42 | 40% |
| Groß Nemerow | 13 | $2,404 | $135.17 | 60% |
| Heiligengrabe | 12 | $2,400 | $226.39 | 39% |
| Copenhagen | 9,111 | $2,347 | $222.94 | 52% |
| Råbylille Strand | 31 | $2,254 | $190.70 | 45% |
| Tejn | 60 | $2,181 | $275.98 | 43% |
| Alt Sührkow | 10 | $2,175 | $426.32 | 28% |
| Zastań | 28 | $2,135 | $265.12 | 34% |
| Vogelsang-Warsin | 11 | $2,123 | $227.20 | 35% |