Prerow Airbnb Market Analysis 2026: Short Term Rental Data & Vacation Rental Statistics in Mecklenburg-Vorpommern, Germany
Is Airbnb profitable in Prerow in 2026? Explore comprehensive Airbnb analytics for Prerow, Mecklenburg-Vorpommern, Germany to uncover income potential. This 2026 STR market report for Prerow, based on AirROI data from February 2025 to January 2026, reveals key trends in the niche market of 174 active listings.
Whether you're considering an Airbnb investment in Prerow, optimizing your existing vacation rental, or exploring rental arbitrage opportunities, understanding the Prerow Airbnb data is crucial. Leveraging the low regulation environment is key to maximizing your short term rental income potential. Let's dive into the specifics.
Key Prerow Airbnb Performance Metrics Overview
Monthly Airbnb Revenue Variations & Income Potential in Prerow (2026)
Understanding the monthly revenue variations for Airbnb listings in Prerow is key to maximizing your short term rental income potential. Seasonality significantly impacts earnings. Our analysis, based on data from the past 12 months, shows that the peak revenue month for STRs in Prerow is typically August, while January often presents the lowest earnings, highlighting opportunities for strategic pricing adjustments during shoulder and low seasons. Explore the typical Airbnb income in Prerow across different performance tiers:
- Best-in-class properties (Top 10%) achieve $3,297+ monthly, often utilizing dynamic pricing and superior guest experiences.
- Strong performing properties (Top 25%) earn $2,182 or more, indicating effective management and desirable locations/amenities.
- Typical properties (Median) generate around $1,118 per month, representing the average market performance.
- Entry-level properties (Bottom 25%) see earnings around $494, often with potential for optimization.
Average Monthly Airbnb Earnings Trend in Prerow
Prerow Airbnb Occupancy Rate Trends (2026)
Maximize your bookings by understanding the Prerow STR occupancy trends. Seasonal demand shifts significantly influence how often properties are booked. Typically, Augustsees the highest demand (peak season occupancy), while January experiences the lowest (low season). Effective strategies, like adjusting minimum stays or offering promotions, can boost occupancy during slower periods. Here's how different property tiers perform in Prerow:
- Best-in-class properties (Top 10%) achieve 64%+ occupancy, indicating high desirability and potentially optimized availability.
- Strong performing properties (Top 25%) maintain 46% or higher occupancy, suggesting good market fit and guest satisfaction.
- Typical properties (Median) have an occupancy rate around 24%.
- Entry-level properties (Bottom 25%) average 10% occupancy, potentially facing higher vacancy.
Average Monthly Occupancy Rate Trend in Prerow
Average Daily Rate (ADR) Airbnb Trends in Prerow (2026)
Effective short term rental pricing strategy in Prerow involves understanding monthly ADR fluctuations. The Average Daily Rate (ADR) for Airbnb in Prerow typically peaks in August and dips lowest during February. Leveraging Airbnb dynamic pricing tools or strategies based on this seasonality can significantly boost revenue. Here's a look at the typical nightly rates achieved:
- Best-in-class properties (Top 10%) command rates of $246+ per night, often due to premium features or locations.
- Strong performing properties (Top 25%) achieve nightly rates of $193 or more.
- Typical properties (Median) charge around $151 per night.
- Entry-level properties (Bottom 25%) earn around $120 per night.
Average Daily Rate (ADR) Trend by Month in Prerow
Get Live Prerow Market Intelligence 👇

Explore Real-time Analytics
Airbnb Seasonality Analysis & Trends in Prerow (2026)
Peak Season (August, July, September)
- Revenue averages $2,463 per month
- Occupancy rates average 42.9%
- Daily rates average $181
Shoulder Season
- Revenue averages $1,432 per month
- Occupancy maintains around 30.2%
- Daily rates hold near $161
Low Season (January, February, December)
- Revenue drops to average $862 per month
- Occupancy decreases to average 17.7%
- Daily rates adjust to average $164
Seasonality Insights for Prerow
- The Airbnb seasonality in Prerow shows highly seasonal trends requiring careful strategy. While the sections above show seasonal averages, it's also insightful to look at the extremes:
- During the high season, the absolute peak month showcases Prerow's highest earning potential, with monthly revenues capable of climbing to $2,752, occupancy reaching a high of 48.5%, and ADRs peaking at $182.
- Conversely, the slowest single month of the year, typically falling within the low season, marks the market's lowest point. In this month, revenue might dip to $743, occupancy could drop to 11.3%, and ADRs may adjust down to $137.
- Understanding both the seasonal averages and these monthly peaks and troughs in revenue, occupancy, and ADR is crucial for maximizing your Airbnb profit potential in Prerow.
Seasonal Strategies for Maximizing Profit
- Peak Season: Maximize revenue through premium pricing and potentially longer minimum stays. Ensure high availability.
- Low Season: Offer competitive pricing, special promotions (e.g., extended stay discounts), and flexible cancellation policies. Target off-season travelers like remote workers or budget-conscious guests.
- Shoulder Seasons: Implement dynamic pricing that balances peak and low rates. Target weekend travelers or specific events. Offer slightly more flexible terms than peak season.
- Regularly analyze your own performance against these Prerow seasonality benchmarks and adjust your pricing and availability strategy accordingly.
Best Areas for Airbnb Investment in Prerow (2026)
Exploring the top neighborhoods for short-term rentals in Prerow? This section highlights key areas, outlining why they are attractive for hosts and guests, along with notable local attractions. Consider these locations based on your target guest profile and investment strategy.
| Neighborhood / Area | Why Host Here? (Target Guests & Appeal) | Key Attractions & Landmarks |
|---|---|---|
| Darß Peninsula | A stunning natural landscape with beautiful beaches and forests, perfect for nature lovers and outdoor activities. Attracts families and tourists seeking relaxation and nature. | Western Pomerania Lagoon Area National Park, Darßer Ort Lighthouse, Prerow Beach, Rugensee Lake, Biking trails through nature |
| Prerow Beach | Popular beach destination known for its wide sandy shores and clear waters. Ideal for tourists looking for a beach getaway with various water activities. | Prerow Beach, Water sports rentals, Seebrücke Prerow (pier), Beach volleyball, Lifeguard services |
| Prerow Village | Charming village atmosphere with traditional architecture and local shops. Attracts visitors who appreciate cultural experiences and local cuisine. | Local shops and boutiques, Restaurants serving regional cuisine, Historic houses, Cultural events |
| Zingst | Nearby coastal resort town with a focus on tourism and wellness. Popular for its spa services and beautiful beach, making it a perfect complement to staying in Prerow. | Zingst Beach, Gallery Zingst, Natural History Museum, Wellness spas, Photography workshops |
| Ahrenshoop | Known for its artistic vibe and picturesque landscapes. Attracts creatives and tourists looking for inspiration and tranquility by the sea. | Artists' colony, Ahrenshoop Beach, Kunstkaten Gallery, Local art studios, Walking paths through nature |
| Born | A small village close to the Baltic Sea, offering a peaceful retreat with access to both nature and water activities. | Born's historical village center, Access to Bodden waters, Nature trails, Birdwatching opportunities |
| Wustrow | A quaint seaside village that provides a relaxed atmosphere and beautiful beaches, ideal for families and beachgoers. | Wustrow Beach, Fischerbastei (fisherman's bastion), Local fish markets, Biking paths to neighboring towns |
| Ribnitz-Damgarten | A larger town that serves as a gateway to the Fischland-Darß-Zingst peninsula, with various amenities and attractions for guests. | Ribnitz Museum of Amber, Historic town center, Ribnitz Town Park, Lakes and recreational areas |
Understanding Airbnb License Requirements & STR Laws in Prerow (2026)
While Prerow, Mecklenburg-Vorpommern, Germany currently shows low STR regulations, specific Airbnb license requirements might still exist or change. Always verify the latest short term rental regulations and Airbnb license requirements directly with local government authorities for Prerow to ensure full compliance before hosting.
(Source: AirROI data, 2026, based on 1% licensed listings)
Top Performing Airbnb Properties in Prerow (2026)
Benchmark your potential! Explore examples of top-performing Airbnb properties in Prerowbased on Trailing Twelve Month (TTM) revenue. Analyze their characteristics, revenue, occupancy rate, and ADR to understand what drives success in this market.

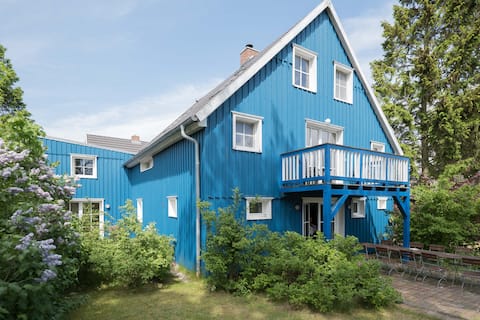
The Blue Swallow House Prerow
Entire Place • 6 bedrooms

Architectural house 5*** ** with fireplace, sauna + view
Entire Place • 3 bedrooms
The Blue Swallow's Nest Prerow
Entire Place • 5 bedrooms
Close to the beach, sauna, fireplace, 5 bedrooms, 3 bathrooms
Entire Place • 5 bedrooms

Dream house Auri in Prerow/Baltic Sea on the Darß
Entire Place • 3 bedrooms

ReetTraum Sunrise Suite with balcony
Entire Place • 1 bedroom
Note: Performance varies based on location, size, amenities, seasonality, and management quality. Data reflects the past 12 months.
Top Performing Airbnb Hosts in Prerow (2026)
Learn from the best! This table showcases top-performing Airbnb hosts in Prerow based on the number of properties managed and estimated total revenue over the past year. Analyze their scale and performance metrics.
| Host Name | Properties | Grossing Revenue | Stay Reviews | Avg Rating |
|---|---|---|---|---|
| Weststrandbooking | 10 | $194,428 | 335 | 4.67/5.0 |
| Saskia | 7 | $181,871 | 73 | 4.93/5.0 |
| Hajö | 3 | $131,814 | 66 | 4.78/5.0 |
| Nicole | 16 | $110,000 | 48 | 4.75/5.0 |
| Saskia | 6 | $98,527 | 39 | 4.81/5.0 |
| Buchungsservice SECRA Bookings | 11 | $90,749 | 21 | 4.90/5.0 |
| Traumurlaub | 17 | $87,596 | 25 | Not Rated |
| Vermietungsservice SECRA Booki | 13 | $62,444 | 20 | 4.83/5.0 |
| Matthias | 2 | $57,554 | 48 | 4.99/5.0 |
| Saskia | 2 | $51,529 | 103 | 4.93/5.0 |
Analyzing the strategies of top hosts, such as their property selection, pricing, and guest communication, can offer valuable lessons for optimizing your own Airbnb operations in Prerow.
Dive Deeper: Advanced Prerow STR Market Data (2026)
Ready to unlock more insights? AirROI provides access to advanced metrics and comprehensive Airbnb data for Prerow. Explore detailed analytics beyond this report to refine your investment strategy, optimize pricing, and maximize your vacation rental profits.
Explore Advanced MetricsPrerow Short-Term Rental Market Composition (2026): Property & Room Types
Room Type Distribution
Property Type Distribution
Market Composition Insights for Prerow
- The Prerow Airbnb market composition is heavily skewed towards Entire Home/Apt listings, which make up 98.3% of the 174 active rentals. This indicates strong guest preference for privacy and space.
- Looking at the property type distribution in Prerow, Apartment/Condo properties are the most common (66.7%), reflecting the local real estate landscape.
- Houses represent a significant 31.6% portion, catering likely to families or larger groups.
- Smaller segments like outdoor/unique (combined 1.7%) offer potential for unique stay experiences.
Prerow Airbnb Room Capacity Analysis (2026): Bedroom Distribution
Distribution of Listings by Number of Bedrooms
Room Capacity Insights for Prerow
- The dominant room capacity in Prerow is 1 bedroom listings, making up 35.6% of the market. This suggests a strong demand for properties suitable for couples or solo travelers.
- Together, 1 bedroom and 2 bedrooms properties represent 71.2% of the active Airbnb listings in Prerow, indicating a high concentration in these sizes.
Prerow Vacation Rental Guest Capacity Trends (2026)
Distribution of Listings by Guest Capacity
Guest Capacity Insights for Prerow
- The most common guest capacity trend in Prerow vacation rentals is listings accommodating 4 guests (31.6%). This suggests the primary traveler segment is likely small families or groups.
- Properties designed for 4 guests and 2 guests dominate the Prerow STR market, accounting for 58.0% of listings.
- 19.0% of properties accommodate 6+ guests, serving the market segment for larger families or group travel in Prerow.
- On average, properties in Prerow are equipped to host 3.8 guests.
Prerow Airbnb Booking Patterns (2026): Available vs. Booked Days
Available Days Distribution
Booked Days Distribution
Booking Pattern Insights for Prerow
- The most common availability pattern in Prerow falls within the 271-366 days range, representing 74.1% of listings. This suggests many properties have significant open periods on their calendars.
- Approximately 94.2% of listings show high availability (181+ days open annually), indicating potential for increased bookings or specific owner usage patterns.
- For booked days, the 1-30 days range is most frequent in Prerow (48.9%), reflecting common guest stay durations or potential owner blocking patterns.
- A notable 6.3% of properties secure long booking periods (181+ days booked per year), highlighting successful long-term rental strategies or significant owner usage.
Prerow Airbnb Minimum Stay Requirements Analysis
Distribution of Listings by Minimum Night Requirement
1 Night
8 listings
4.6% of total
2 Nights
10 listings
5.8% of total
3 Nights
8 listings
4.6% of total
4-6 Nights
26 listings
15% of total
7-29 Nights
9 listings
5.2% of total
30+ Nights
112 listings
64.7% of total
Key Insights
- The most prevalent minimum stay requirement in Prerow is 30+ Nights, adopted by 64.7% of listings. This highlights the market's preference for longer commitments.
- Very short stays (1-2 nights) are less common (10.4%), suggesting hosts prefer slightly longer bookings to optimize turnover.
- A significant segment (64.7%) caters to monthly stays (30+ nights) in Prerow, pointing to opportunities in the extended-stay market.
Recommendations
- Align with the market by considering a 30+ Nights minimum stay, as 64.7% of Prerow hosts use this setting.
- If feasible, allowing 1-night stays, especially midweek or during low season, could capture last-minute bookings, as only 4.6% currently do.
- Explore offering discounts for stays of 30+ nights to attract the 64.7% of the market seeking extended stays.
- Adjust minimum nights based on seasonality – potentially shorter during low season and longer during peak demand periods in Prerow.
Prerow Airbnb Cancellation Policy Trends Analysis (2026)
Super Strict 60 Days
12 listings
6.9% of total
Super Strict 30 Days
16 listings
9.2% of total
Limited
1 listings
0.6% of total
Flexible
6 listings
3.4% of total
Moderate
10 listings
5.7% of total
Firm
95 listings
54.6% of total
Strict
34 listings
19.5% of total
Cancellation Policy Insights for Prerow
- The prevailing Airbnb cancellation policy trend in Prerow is Firm, used by 54.6% of listings.
- A majority (74.1%) of hosts in Prerow utilize Firm or Strict policies, indicating a market where hosts prioritize booking security.
Recommendations for Hosts
- Consider adopting a Firm policy to align with the 54.6% market standard in Prerow.
- Regularly review your cancellation policy against competitors and market demand shifts in Prerow.
Prerow STR Booking Lead Time Analysis (2026)
Average Booking Lead Time by Month
Booking Lead Time Insights for Prerow
- The overall average booking lead time for vacation rentals in Prerow is 85 days.
- Guests book furthest in advance for stays during August (average 117 days), likely coinciding with peak travel demand or local events.
- The shortest booking windows occur for stays in February (average 41 days), indicating more last-minute travel plans during this time.
- Seasonally, Summer (98 days avg.) sees the longest lead times, while Spring (79 days avg.) has the shortest, reflecting typical travel planning cycles.
Recommendations for Hosts
- Use the overall average lead time (85 days) as a baseline for your pricing and availability strategy in Prerow.
- For August stays, consider implementing length-of-stay discounts or slightly higher rates for bookings made less than 117 days out to capitalize on advance planning.
- Target marketing efforts for the Summer season well in advance (at least 98 days) to capture early planners.
- Monitor your own booking lead times against these Prerow averages to identify opportunities for dynamic pricing adjustments.
Popular & Essential Airbnb Amenities in Prerow (2026)
Amenity Prevalence
Amenity Insights for Prerow
- Essential amenities in Prerow that guests expect include: TV, Kitchen, Heating. Lacking these (any) could significantly impact bookings.
- Popular amenities like Coffee maker, Refrigerator, Wifi are common but not universal. Offering these can provide a competitive edge.
- Warning: Wifi is not universally provided but is considered essential globally. Ensure reliable Wifi is offered.
Recommendations for Hosts
- Ensure your listing includes all essential amenities for Prerow: TV, Kitchen, Heating.
- Prioritize adding missing essentials: TV, Kitchen, Heating.
- Consider adding popular differentiators like Coffee maker or Refrigerator to increase appeal.
- Highlight unique or less common amenities you offer (e.g., hot tub, dedicated workspace, EV charger) in your listing description and photos.
- Regularly check competitor amenities in Prerow to stay competitive.
Prerow Airbnb Guest Demographics & Profile Analysis (2026)
Guest Profile Summary for Prerow
- The typical guest profile for Airbnb in Prerow consists of primarily domestic travelers (94%), often arriving from nearby Berlin, typically belonging to the Post-2000s (Gen Z/Alpha) group (50%), primarily speaking German or English.
- Domestic travelers account for 94.0% of guests.
- Key international markets include Germany (94%) and Switzerland (3%).
- Top languages spoken are German (41.6%) followed by English (38.9%).
- A significant demographic segment is the Post-2000s (Gen Z/Alpha) group, representing 50% of guests.
Recommendations for Hosts
- Target domestic marketing efforts towards travelers from Berlin and Leipzig.
- Tailor amenities and listing descriptions to appeal to the dominant Post-2000s (Gen Z/Alpha) demographic (e.g., highlight fast WiFi, smart home features, local guides).
- Highlight unique local experiences or amenities relevant to the primary guest profile.
- Consider seasonal promotions aligned with peak travel times for key origin markets.
Nearby Short-Term Rental Market Comparison
How does the Prerow Airbnb market stack up against its neighbors? Compare key performance metrics like average monthly revenue, ADR, and occupancy rates in surrounding areas to understand the broader regional STR landscape.
| Market | Active Properties | Monthly Revenue | Daily Rate | Avg. Occupancy |
|---|---|---|---|---|
| Gallin-Kuppentin | 14 | $2,958 | $358.55 | 30% |
| Wittenbeck | 14 | $2,937 | $224.34 | 43% |
| Groß Nemerow | 13 | $2,404 | $135.17 | 60% |
| Heiligengrabe | 12 | $2,400 | $226.39 | 39% |
| Copenhagen | 9,111 | $2,347 | $222.94 | 52% |
| Råbylille Strand | 31 | $2,254 | $190.70 | 45% |
| Alt Sührkow | 10 | $2,175 | $426.32 | 28% |
| Frederiksberg | 1,015 | $2,062 | $217.28 | 50% |
| Solrød Strand | 54 | $2,032 | $249.51 | 48% |
| Hellerup | 11 | $1,973 | $298.07 | 51% |