Nienhagen Airbnb Market Analysis 2026: Short Term Rental Data & Vacation Rental Statistics in Mecklenburg-Vorpommern, Germany
Is Airbnb profitable in Nienhagen in 2026? Explore comprehensive Airbnb analytics for Nienhagen, Mecklenburg-Vorpommern, Germany to uncover income potential. This 2026 STR market report for Nienhagen, based on AirROI data from February 2025 to January 2026, reveals key trends in the niche market of 20 active listings.
Whether you're considering an Airbnb investment in Nienhagen, optimizing your existing vacation rental, or exploring rental arbitrage opportunities, understanding the Nienhagen Airbnb data is crucial. Leveraging the low regulation environment is key to maximizing your short term rental income potential. Let's dive into the specifics.
Key Nienhagen Airbnb Performance Metrics Overview
Monthly Airbnb Revenue Variations & Income Potential in Nienhagen (2026)
Understanding the monthly revenue variations for Airbnb listings in Nienhagen is key to maximizing your short term rental income potential. Seasonality significantly impacts earnings. Our analysis, based on data from the past 12 months, shows that the peak revenue month for STRs in Nienhagen is typically July, while February often presents the lowest earnings, highlighting opportunities for strategic pricing adjustments during shoulder and low seasons. Explore the typical Airbnb income in Nienhagen across different performance tiers:
- Best-in-class properties (Top 10%) achieve $2,948+ monthly, often utilizing dynamic pricing and superior guest experiences.
- Strong performing properties (Top 25%) earn $2,072 or more, indicating effective management and desirable locations/amenities.
- Typical properties (Median) generate around $1,326 per month, representing the average market performance.
- Entry-level properties (Bottom 25%) see earnings around $841, often with potential for optimization.
Average Monthly Airbnb Earnings Trend in Nienhagen
Nienhagen Airbnb Occupancy Rate Trends (2026)
Maximize your bookings by understanding the Nienhagen STR occupancy trends. Seasonal demand shifts significantly influence how often properties are booked. Typically, Julysees the highest demand (peak season occupancy), while January experiences the lowest (low season). Effective strategies, like adjusting minimum stays or offering promotions, can boost occupancy during slower periods. Here's how different property tiers perform in Nienhagen:
- Best-in-class properties (Top 10%) achieve 72%+ occupancy, indicating high desirability and potentially optimized availability.
- Strong performing properties (Top 25%) maintain 52% or higher occupancy, suggesting good market fit and guest satisfaction.
- Typical properties (Median) have an occupancy rate around 34%.
- Entry-level properties (Bottom 25%) average 22% occupancy, potentially facing higher vacancy.
Average Monthly Occupancy Rate Trend in Nienhagen
Average Daily Rate (ADR) Airbnb Trends in Nienhagen (2026)
Effective short term rental pricing strategy in Nienhagen involves understanding monthly ADR fluctuations. The Average Daily Rate (ADR) for Airbnb in Nienhagen typically peaks in October and dips lowest during February. Leveraging Airbnb dynamic pricing tools or strategies based on this seasonality can significantly boost revenue. Here's a look at the typical nightly rates achieved:
- Best-in-class properties (Top 10%) command rates of $187+ per night, often due to premium features or locations.
- Strong performing properties (Top 25%) achieve nightly rates of $158 or more.
- Typical properties (Median) charge around $132 per night.
- Entry-level properties (Bottom 25%) earn around $102 per night.
Average Daily Rate (ADR) Trend by Month in Nienhagen
Get Live Nienhagen Market Intelligence 👇

Explore Real-time Analytics
Airbnb Seasonality Analysis & Trends in Nienhagen (2026)
Peak Season (July, August, September)
- Revenue averages $2,732 per month
- Occupancy rates average 64.4%
- Daily rates average $142
Shoulder Season
- Revenue averages $1,407 per month
- Occupancy maintains around 34.1%
- Daily rates hold near $138
Low Season (January, February, March)
- Revenue drops to average $684 per month
- Occupancy decreases to average 18.9%
- Daily rates adjust to average $121
Seasonality Insights for Nienhagen
- The Airbnb seasonality in Nienhagen shows highly seasonal trends requiring careful strategy. While the sections above show seasonal averages, it's also insightful to look at the extremes:
- During the high season, the absolute peak month showcases Nienhagen's highest earning potential, with monthly revenues capable of climbing to $3,217, occupancy reaching a high of 72.2%, and ADRs peaking at $160.
- Conversely, the slowest single month of the year, typically falling within the low season, marks the market's lowest point. In this month, revenue might dip to $594, occupancy could drop to 16.2%, and ADRs may adjust down to $102.
- Understanding both the seasonal averages and these monthly peaks and troughs in revenue, occupancy, and ADR is crucial for maximizing your Airbnb profit potential in Nienhagen.
Seasonal Strategies for Maximizing Profit
- Peak Season: Maximize revenue through premium pricing and potentially longer minimum stays. Ensure high availability.
- Low Season: Offer competitive pricing, special promotions (e.g., extended stay discounts), and flexible cancellation policies. Target off-season travelers like remote workers or budget-conscious guests.
- Shoulder Seasons: Implement dynamic pricing that balances peak and low rates. Target weekend travelers or specific events. Offer slightly more flexible terms than peak season.
- Regularly analyze your own performance against these Nienhagen seasonality benchmarks and adjust your pricing and availability strategy accordingly.
Best Areas for Airbnb Investment in Nienhagen (2026)
Exploring the top neighborhoods for short-term rentals in Nienhagen? This section highlights key areas, outlining why they are attractive for hosts and guests, along with notable local attractions. Consider these locations based on your target guest profile and investment strategy.
| Neighborhood / Area | Why Host Here? (Target Guests & Appeal) | Key Attractions & Landmarks |
|---|---|---|
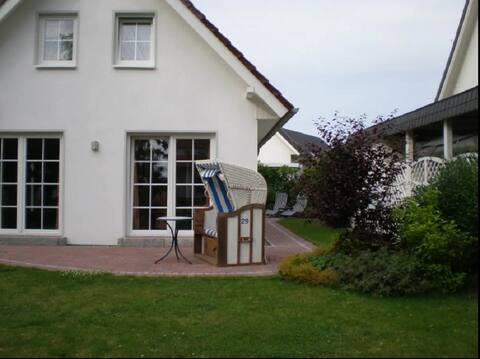
| Nienhagen Beach | Popular for its beautiful sandy beach, perfect for families and tourists seeking a relaxing getaway by the sea. The area has good access to various coastal activities and water sports. | Nienhagen Beach, Rostock Warnemünde, Beach promenade, Cliff walking paths, Local beach cafes, Sailing activities |
| Local Town Center | Offers a charming mix of local shops, eateries, and cultural experiences. This area attracts visitors who appreciate a quaint and authentic German town atmosphere. | Town square, Historical buildings, Local cuisine restaurants, Art galleries, Farmers market, Cafés |
| Warnemünde | A nearby trendy seaside resort known for its marina, lighthouse, and beautiful beach. It is a hotspot for tourists eager to enjoy seaside activities and fresh seafood. | Warnemünde Lighthouse, Seabridge, Beach bars, Fischmarkt (Fish market), Kurhaus, Promenade |
| Rostock Region | The larger neighboring town offers rich cultural heritage, nightlife, and shopping. Ideal for travelers looking to explore urban attractions while being close to nature. | University of Rostock, Rostock Zoo, Historic city center, Shopping center, Cafés and pubs, Cultural events |
| Kühlungsborn | Trendy coastal town nearby that is especially popular in summer, with a vibrant boardwalk and numerous events. Attracts beachgoers and families during the holiday season. | Kühlungsborn Beach, Promenade, Beach sports, Pier activities, Cycle paths |
| Heiligendamm | Famous for its upscale spa resorts and historic hotels. Attracts visitors looking for luxury and relaxation by the sea. | Grandhotel Heiligendamm, Historical spa architecture, Golf courses nearby, Walking trails, Fine dining restaurants |
| Bardowick | A quieter village offering a glimpse of rural life and nature, popular with visitors seeking tranquility and outdoor activities such as hiking and cycling. | Natural parks, Hiking trails, Cultural heritage sites, Birdwatching spots |
| North Coast Hiking Trails | Attracts nature lovers and adventure seekers interested in hiking and exploring the scenic coastal regions. It's ideal for guests interested in outdoor activities. | Nordufer Hiking Trail, Cliffs and sea views, Wildlife watching, Cycling paths |
Understanding Airbnb License Requirements & STR Laws in Nienhagen (2026)
While Nienhagen, Mecklenburg-Vorpommern, Germany currently shows low STR regulations, specific Airbnb license requirements might still exist or change. Always verify the latest short term rental regulations and Airbnb license requirements directly with local government authorities for Nienhagen to ensure full compliance before hosting.
(Source: AirROI data, 2026, finding no licensed listings among those analyzed)
Top Performing Airbnb Properties in Nienhagen (2026)
Benchmark your potential! Explore examples of top-performing Airbnb properties in Nienhagenbased on Trailing Twelve Month (TTM) revenue. Analyze their characteristics, revenue, occupancy rate, and ADR to understand what drives success in this market.

Apartment with sea view
Entire Place • 2 bedrooms
Beach Pearl Vacation Home
Entire Place • 3 bedrooms

Sea view - Nienhagen Baltic seaside resort
Entire Place • 2 bedrooms

Sunny Apartment Close to the Sea
Entire Place • 1 bedroom
Nienhagen Baltic Sea Garden
Entire Place • 1 bedroom
Elisa
Entire Place • 2 bedrooms
Note: Performance varies based on location, size, amenities, seasonality, and management quality. Data reflects the past 12 months.
Top Performing Airbnb Hosts in Nienhagen (2026)
Learn from the best! This table showcases top-performing Airbnb hosts in Nienhagen based on the number of properties managed and estimated total revenue over the past year. Analyze their scale and performance metrics.
| Host Name | Properties | Grossing Revenue | Stay Reviews | Avg Rating |
|---|---|---|---|---|
| Martina | 1 | $29,827 | 46 | 4.91/5.0 |
| Favorent | 2 | $29,749 | 12 | 3.89/5.0 |
| Carl | 1 | $21,774 | 56 | 4.57/5.0 |
| Stephan | 1 | $20,997 | 138 | 4.90/5.0 |
| Michael | 1 | $20,440 | 19 | 4.84/5.0 |
| Favorent | 1 | $20,069 | 14 | 4.57/5.0 |
| Catrin | 2 | $18,523 | 4 | 5.00/5.0 |
| Philipp | 1 | $15,645 | 4 | 4.50/5.0 |
| Felix | 2 | $13,502 | 154 | 4.64/5.0 |
| Dirk | 1 | $11,474 | 18 | 4.83/5.0 |
Analyzing the strategies of top hosts, such as their property selection, pricing, and guest communication, can offer valuable lessons for optimizing your own Airbnb operations in Nienhagen.
Dive Deeper: Advanced Nienhagen STR Market Data (2026)
Ready to unlock more insights? AirROI provides access to advanced metrics and comprehensive Airbnb data for Nienhagen. Explore detailed analytics beyond this report to refine your investment strategy, optimize pricing, and maximize your vacation rental profits.
Explore Advanced MetricsNienhagen Short-Term Rental Market Composition (2026): Property & Room Types
Room Type Distribution
Property Type Distribution
Market Composition Insights for Nienhagen
- The Nienhagen Airbnb market composition is heavily skewed towards Entire Home/Apt listings, which make up 100% of the 20 active rentals. This indicates strong guest preference for privacy and space.
- Looking at the property type distribution in Nienhagen, Apartment/Condo properties are the most common (55%), reflecting the local real estate landscape.
- Houses represent a significant 45% portion, catering likely to families or larger groups.
Nienhagen Airbnb Room Capacity Analysis (2026): Bedroom Distribution
Distribution of Listings by Number of Bedrooms
Room Capacity Insights for Nienhagen
- The dominant room capacity in Nienhagen is 1 bedroom listings, making up 50% of the market. This suggests a strong demand for properties suitable for couples or solo travelers.
- Together, 1 bedroom and 2 bedrooms properties represent 95.0% of the active Airbnb listings in Nienhagen, indicating a high concentration in these sizes.
- Listings with 3+ bedrooms (5.0%) represent a smaller niche, potentially indicating an underserved market for larger group accommodations in Nienhagen.
Nienhagen Vacation Rental Guest Capacity Trends (2026)
Distribution of Listings by Guest Capacity
Guest Capacity Insights for Nienhagen
- The most common guest capacity trend in Nienhagen vacation rentals is listings accommodating 4 guests (60%). This suggests the primary traveler segment is likely small families or groups.
- Properties designed for 4 guests and 3 guests dominate the Nienhagen STR market, accounting for 75.0% of listings.
- On average, properties in Nienhagen are equipped to host 4.1 guests.
Nienhagen Airbnb Booking Patterns (2026): Available vs. Booked Days
Available Days Distribution
Booked Days Distribution
Booking Pattern Insights for Nienhagen
- The most common availability pattern in Nienhagen falls within the 271-366 days range, representing 55% of listings. This suggests many properties have significant open periods on their calendars.
- Approximately 90.0% of listings show high availability (181+ days open annually), indicating potential for increased bookings or specific owner usage patterns.
- For booked days, the 91-180 days range is most frequent in Nienhagen (35%), reflecting common guest stay durations or potential owner blocking patterns.
- A notable 10.0% of properties secure long booking periods (181+ days booked per year), highlighting successful long-term rental strategies or significant owner usage.
Nienhagen Airbnb Minimum Stay Requirements Analysis
Distribution of Listings by Minimum Night Requirement
1 Night
1 listings
5% of total
2 Nights
1 listings
5% of total
3 Nights
1 listings
5% of total
4-6 Nights
4 listings
20% of total
30+ Nights
13 listings
65% of total
Key Insights
- The most prevalent minimum stay requirement in Nienhagen is 30+ Nights, adopted by 65% of listings. This highlights the market's preference for longer commitments.
- Very short stays (1-2 nights) are less common (10.0%), suggesting hosts prefer slightly longer bookings to optimize turnover.
- A significant segment (65%) caters to monthly stays (30+ nights) in Nienhagen, pointing to opportunities in the extended-stay market.
Recommendations
- Align with the market by considering a 30+ Nights minimum stay, as 65% of Nienhagen hosts use this setting.
- If feasible, allowing 1-night stays, especially midweek or during low season, could capture last-minute bookings, as only 5% currently do.
- Explore offering discounts for stays of 30+ nights to attract the 65% of the market seeking extended stays.
- Adjust minimum nights based on seasonality – potentially shorter during low season and longer during peak demand periods in Nienhagen.
Nienhagen Airbnb Cancellation Policy Trends Analysis (2026)
Super Strict 30 Days
2 listings
10% of total
Flexible
3 listings
15% of total
Moderate
3 listings
15% of total
Firm
10 listings
50% of total
Strict
2 listings
10% of total
Cancellation Policy Insights for Nienhagen
- The prevailing Airbnb cancellation policy trend in Nienhagen is Firm, used by 50% of listings.
- A majority (60.0%) of hosts in Nienhagen utilize Firm or Strict policies, indicating a market where hosts prioritize booking security.
Recommendations for Hosts
- Consider adopting a Firm policy to align with the 50% market standard in Nienhagen.
- Using a Strict policy might deter some guests, as only 10% of listings use it. Evaluate if potential revenue protection outweighs possible lower booking rates.
- Regularly review your cancellation policy against competitors and market demand shifts in Nienhagen.
Nienhagen STR Booking Lead Time Analysis (2026)
Average Booking Lead Time by Month
Booking Lead Time Insights for Nienhagen
- The overall average booking lead time for vacation rentals in Nienhagen is 76 days.
- Guests book furthest in advance for stays during August (average 142 days), likely coinciding with peak travel demand or local events.
- The shortest booking windows occur for stays in February (average 13 days), indicating more last-minute travel plans during this time.
- Seasonally, Summer (123 days avg.) sees the longest lead times, while Fall (45 days avg.) has the shortest, reflecting typical travel planning cycles.
Recommendations for Hosts
- Use the overall average lead time (76 days) as a baseline for your pricing and availability strategy in Nienhagen.
- For August stays, consider implementing length-of-stay discounts or slightly higher rates for bookings made less than 142 days out to capitalize on advance planning.
- During February, focus on last-minute booking availability and promotions, as guests book with very short notice (13 days avg.).
- Target marketing efforts for the Summer season well in advance (at least 123 days) to capture early planners.
- Monitor your own booking lead times against these Nienhagen averages to identify opportunities for dynamic pricing adjustments.
Popular & Essential Airbnb Amenities in Nienhagen (2026)
Amenity Prevalence
Amenity Insights for Nienhagen
- Essential amenities in Nienhagen that guests expect include: TV, Free parking on premises. Lacking these (any) could significantly impact bookings.
- Popular amenities like Kitchen, Heating, Patio or balcony are common but not universal. Offering these can provide a competitive edge.
- Warning: Wifi is not universally provided but is considered essential globally. Ensure reliable Wifi is offered.
Recommendations for Hosts
- Ensure your listing includes all essential amenities for Nienhagen: TV, Free parking on premises.
- Prioritize adding missing essentials: TV, Free parking on premises.
- Consider adding popular differentiators like Kitchen or Heating to increase appeal.
- Highlight unique or less common amenities you offer (e.g., hot tub, dedicated workspace, EV charger) in your listing description and photos.
- Regularly check competitor amenities in Nienhagen to stay competitive.
Nienhagen Airbnb Guest Demographics & Profile Analysis (2026)
Guest Profile Summary for Nienhagen
- The typical guest profile for Airbnb in Nienhagen consists of primarily domestic travelers (81%), often arriving from nearby Berlin, typically belonging to the Post-2000s (Gen Z/Alpha) group (50%), primarily speaking German or English.
- Domestic travelers account for 80.6% of guests.
- Key international markets include Germany (80.6%) and Czechia (12.9%).
- Top languages spoken are German (38.6%) followed by English (36.4%).
- A significant demographic segment is the Post-2000s (Gen Z/Alpha) group, representing 50% of guests.
Recommendations for Hosts
- Target domestic marketing efforts towards travelers from Berlin and Hanover.
- Tailor amenities and listing descriptions to appeal to the dominant Post-2000s (Gen Z/Alpha) demographic (e.g., highlight fast WiFi, smart home features, local guides).
- Highlight unique local experiences or amenities relevant to the primary guest profile.
- Consider seasonal promotions aligned with peak travel times for key origin markets.
Nearby Short-Term Rental Market Comparison
How does the Nienhagen Airbnb market stack up against its neighbors? Compare key performance metrics like average monthly revenue, ADR, and occupancy rates in surrounding areas to understand the broader regional STR landscape.
| Market | Active Properties | Monthly Revenue | Daily Rate | Avg. Occupancy |
|---|---|---|---|---|
| Gallin-Kuppentin | 14 | $2,958 | $358.55 | 30% |
| Wittenbeck | 14 | $2,937 | $224.34 | 43% |
| Lohals | 20 | $2,866 | $331.99 | 40% |
| Heiligengrabe | 12 | $2,400 | $226.39 | 39% |
| Copenhagen | 9,111 | $2,347 | $222.94 | 52% |
| Bissee | 13 | $2,338 | $180.13 | 48% |
| Råbylille Strand | 31 | $2,254 | $190.70 | 45% |
| Rude Strand | 27 | $2,198 | $254.15 | 41% |
| Korshavn | 14 | $2,192 | $244.24 | 41% |
| Alt Sührkow | 10 | $2,175 | $426.32 | 28% |