Insel Poel Airbnb Market Analysis 2026: Short Term Rental Data & Vacation Rental Statistics in Mecklenburg-Vorpommern, Germany
Is Airbnb profitable in Insel Poel in 2026? Explore comprehensive Airbnb analytics for Insel Poel, Mecklenburg-Vorpommern, Germany to uncover income potential. This 2026 STR market report for Insel Poel, based on AirROI data from February 2025 to January 2026, reveals key trends in the niche market of 100 active listings.
Whether you're considering an Airbnb investment in Insel Poel, optimizing your existing vacation rental, or exploring rental arbitrage opportunities, understanding the Insel Poel Airbnb data is crucial. Leveraging the low regulation environment is key to maximizing your short term rental income potential. Let's dive into the specifics.
Key Insel Poel Airbnb Performance Metrics Overview
Monthly Airbnb Revenue Variations & Income Potential in Insel Poel (2026)
Understanding the monthly revenue variations for Airbnb listings in Insel Poel is key to maximizing your short term rental income potential. Seasonality significantly impacts earnings. Our analysis, based on data from the past 12 months, shows that the peak revenue month for STRs in Insel Poel is typically August, while January often presents the lowest earnings, highlighting opportunities for strategic pricing adjustments during shoulder and low seasons. Explore the typical Airbnb income in Insel Poel across different performance tiers:
- Best-in-class properties (Top 10%) achieve $2,514+ monthly, often utilizing dynamic pricing and superior guest experiences.
- Strong performing properties (Top 25%) earn $1,587 or more, indicating effective management and desirable locations/amenities.
- Typical properties (Median) generate around $596 per month, representing the average market performance.
- Entry-level properties (Bottom 25%) see earnings around $394, often with potential for optimization.
Average Monthly Airbnb Earnings Trend in Insel Poel
Insel Poel Airbnb Occupancy Rate Trends (2026)
Maximize your bookings by understanding the Insel Poel STR occupancy trends. Seasonal demand shifts significantly influence how often properties are booked. Typically, Marchsees the highest demand (peak season occupancy), while January experiences the lowest (low season). Effective strategies, like adjusting minimum stays or offering promotions, can boost occupancy during slower periods. Here's how different property tiers perform in Insel Poel:
- Best-in-class properties (Top 10%) achieve 60%+ occupancy, indicating high desirability and potentially optimized availability.
- Strong performing properties (Top 25%) maintain 36% or higher occupancy, suggesting good market fit and guest satisfaction.
- Typical properties (Median) have an occupancy rate around 13%.
- Entry-level properties (Bottom 25%) average 10% occupancy, potentially facing higher vacancy.
Average Monthly Occupancy Rate Trend in Insel Poel
Average Daily Rate (ADR) Airbnb Trends in Insel Poel (2026)
Effective short term rental pricing strategy in Insel Poel involves understanding monthly ADR fluctuations. The Average Daily Rate (ADR) for Airbnb in Insel Poel typically peaks in August and dips lowest during February. Leveraging Airbnb dynamic pricing tools or strategies based on this seasonality can significantly boost revenue. Here's a look at the typical nightly rates achieved:
- Best-in-class properties (Top 10%) command rates of $252+ per night, often due to premium features or locations.
- Strong performing properties (Top 25%) achieve nightly rates of $199 or more.
- Typical properties (Median) charge around $146 per night.
- Entry-level properties (Bottom 25%) earn around $110 per night.
Average Daily Rate (ADR) Trend by Month in Insel Poel
Get Live Insel Poel Market Intelligence 👇

Explore Real-time Analytics
Airbnb Seasonality Analysis & Trends in Insel Poel (2026)
Peak Season (August, July, March)
- Revenue averages $1,466 per month
- Occupancy rates average 30.7%
- Daily rates average $162
Shoulder Season
- Revenue averages $1,152 per month
- Occupancy maintains around 26.4%
- Daily rates hold near $159
Low Season (January, November, December)
- Revenue drops to average $735 per month
- Occupancy decreases to average 15.5%
- Daily rates adjust to average $163
Seasonality Insights for Insel Poel
- The Airbnb seasonality in Insel Poel shows highly seasonal trends requiring careful strategy. While the sections above show seasonal averages, it's also insightful to look at the extremes:
- During the high season, the absolute peak month showcases Insel Poel's highest earning potential, with monthly revenues capable of climbing to $1,519, occupancy reaching a high of 33.6%, and ADRs peaking at $173.
- Conversely, the slowest single month of the year, typically falling within the low season, marks the market's lowest point. In this month, revenue might dip to $636, occupancy could drop to 13.1%, and ADRs may adjust down to $139.
- Understanding both the seasonal averages and these monthly peaks and troughs in revenue, occupancy, and ADR is crucial for maximizing your Airbnb profit potential in Insel Poel.
Seasonal Strategies for Maximizing Profit
- Peak Season: Maximize revenue through premium pricing and potentially longer minimum stays. Ensure high availability.
- Low Season: Offer competitive pricing, special promotions (e.g., extended stay discounts), and flexible cancellation policies. Target off-season travelers like remote workers or budget-conscious guests.
- Shoulder Seasons: Implement dynamic pricing that balances peak and low rates. Target weekend travelers or specific events. Offer slightly more flexible terms than peak season.
- Regularly analyze your own performance against these Insel Poel seasonality benchmarks and adjust your pricing and availability strategy accordingly.
Best Areas for Airbnb Investment in Insel Poel (2026)
Exploring the top neighborhoods for short-term rentals in Insel Poel? This section highlights key areas, outlining why they are attractive for hosts and guests, along with notable local attractions. Consider these locations based on your target guest profile and investment strategy.
| Neighborhood / Area | Why Host Here? (Target Guests & Appeal) | Key Attractions & Landmarks |
|---|---|---|
| Zweedorf | Quiet village atmosphere with close proximity to beaches. Ideal for families and those seeking a peaceful retreat while being able to enjoy island activities. | Fischland-Darß-Zingst Nature Reserve, Küstenwald, Zweedorfer Wiesen, Hiking Trails, Bike Paths |
| Gollwitz | Picturesque coastal village known for its beautiful sandy beaches and natural surroundings. Perfect for beach lovers and outdoor enthusiasts looking for relaxation. | Gollwitz Beach, Dünenweg, Nature Walks, Local Cafés, Water Sports Activities |
| Timmendorf | Lively beach area that offers a vibrant holiday atmosphere. Great for tourists who enjoy sunbathing, beach walks, and local events throughout the summer. | Timmendorfer Strand, Beach Promenade, Watersports, Coastal Restaurants, Summer Festivals |
| Bäckerstraße | A charming street area that provides access to local shops and eateries, making it convenient for guests to experience local culture and cuisine. | Local Markets, Restaurants and Cafes, Souvenir Shops, Cultural Events |
| Warnemünde | Popular seaside resort with a wide beach and a charming promenade. Strong draw for tourists looking for a lively seaside vacation. | Warnemünde Beach, Seabridge, Lighthouse, Local Fish Restaurants, Beach Bars |
| Hövt | A small, tranquil area known for its scenic landscapes and rural charm. Attractive for visitors seeking a calm getaway close to nature. | Rural Cycling Routes, Scenic Views, Nature Reserves, Hiking Trails |
| Boltenhagen | A well-known coastal resort town that features a long sandy beach and various leisure activities. Ideal for vacationers looking for classic beach experiences. | Boltenhagen Beach, Promenade, Beach Volleyball, Water Sports Events |
| Insel Poel Village | The main village of Insel Poel with historical significance. Offers cultural insights and a convenient base for exploring the island's beauty. | Local Museum, Historical Buildings, Community Events, Access to Ferry |
Understanding Airbnb License Requirements & STR Laws in Insel Poel (2026)
While Insel Poel, Mecklenburg-Vorpommern, Germany currently shows low STR regulations, specific Airbnb license requirements might still exist or change. Always verify the latest short term rental regulations and Airbnb license requirements directly with local government authorities for Insel Poel to ensure full compliance before hosting.
(Source: AirROI data, 2026, based on 1% licensed listings)
Top Performing Airbnb Properties in Insel Poel (2026)
Benchmark your potential! Explore examples of top-performing Airbnb properties in Insel Poelbased on Trailing Twelve Month (TTM) revenue. Analyze their characteristics, revenue, occupancy rate, and ADR to understand what drives success in this market.
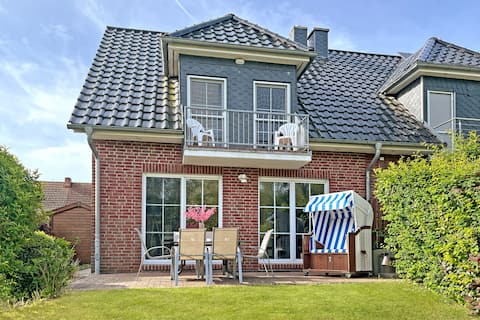
Zanzibar on Poel - 700 m to the beach with sauna & fireplace
Entire Place • 3 bedrooms
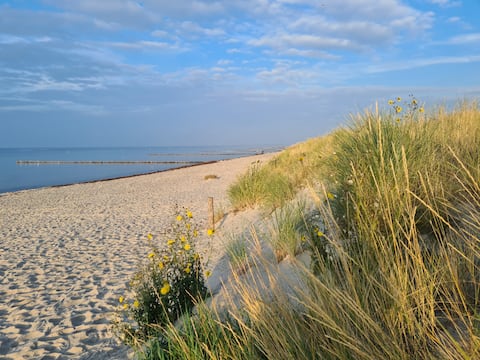
Poel Island, overlooking the Baltic Sea
Entire Place • 3 bedrooms
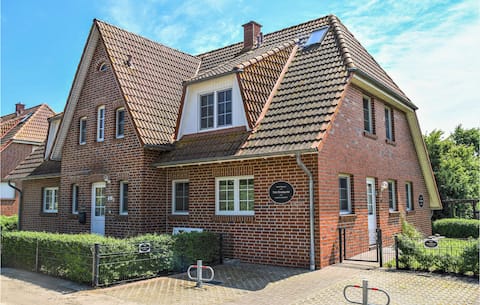
Meeresbrise
Entire Place • 3 bedrooms
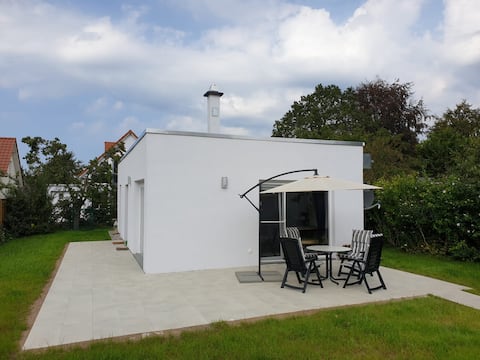
Cozy vacation home with garden and terrace
Entire Place • 2 bedrooms
A dream vacation right on the beach
Entire Place • 3 bedrooms
Beachfront house with fireplace, upper floor
Entire Place • 1 bedroom
Note: Performance varies based on location, size, amenities, seasonality, and management quality. Data reflects the past 12 months.
Top Performing Airbnb Hosts in Insel Poel (2026)
Learn from the best! This table showcases top-performing Airbnb hosts in Insel Poel based on the number of properties managed and estimated total revenue over the past year. Analyze their scale and performance metrics.
| Host Name | Properties | Grossing Revenue | Stay Reviews | Avg Rating |
|---|---|---|---|---|
| Stefanie | 45 | $277,052 | 59 | 4.78/5.0 |
| Novasol | 4 | $62,624 | 11 | 3.60/5.0 |
| Nicola | 2 | $54,407 | 251 | 4.75/5.0 |
| Claudia | 2 | $44,798 | 30 | 4.96/5.0 |
| Nancy | 1 | $42,239 | 17 | 4.88/5.0 |
| Monika | 1 | $39,399 | 66 | 4.98/5.0 |
| Martina - Interhome | 11 | $36,121 | 39 | 4.15/5.0 |
| Sybrand | 3 | $35,281 | 7 | 4.67/5.0 |
| Norbert | 1 | $35,253 | 24 | 4.92/5.0 |
| Elke | 2 | $33,662 | 9 | 5.00/5.0 |
Analyzing the strategies of top hosts, such as their property selection, pricing, and guest communication, can offer valuable lessons for optimizing your own Airbnb operations in Insel Poel.
Dive Deeper: Advanced Insel Poel STR Market Data (2026)
Ready to unlock more insights? AirROI provides access to advanced metrics and comprehensive Airbnb data for Insel Poel. Explore detailed analytics beyond this report to refine your investment strategy, optimize pricing, and maximize your vacation rental profits.
Explore Advanced MetricsInsel Poel Short-Term Rental Market Composition (2026): Property & Room Types
Room Type Distribution
Property Type Distribution
Market Composition Insights for Insel Poel
- The Insel Poel Airbnb market composition is heavily skewed towards Entire Home/Apt listings, which make up 99% of the 100 active rentals. This indicates strong guest preference for privacy and space.
- Looking at the property type distribution in Insel Poel, Apartment/Condo properties are the most common (68%), reflecting the local real estate landscape.
- Houses represent a significant 32% portion, catering likely to families or larger groups.
Insel Poel Airbnb Room Capacity Analysis (2026): Bedroom Distribution
Distribution of Listings by Number of Bedrooms
Room Capacity Insights for Insel Poel
- The dominant room capacity in Insel Poel is 2 bedrooms listings, making up 37% of the market. This suggests a strong demand for properties suitable for couples or solo travelers.
- Together, 2 bedrooms and 1 bedroom properties represent 73.0% of the active Airbnb listings in Insel Poel, indicating a high concentration in these sizes.
Insel Poel Vacation Rental Guest Capacity Trends (2026)
Distribution of Listings by Guest Capacity
Guest Capacity Insights for Insel Poel
- The most common guest capacity trend in Insel Poel vacation rentals is listings accommodating 4 guests (46%). This suggests the primary traveler segment is likely small families or groups.
- Properties designed for 4 guests and 2 guests dominate the Insel Poel STR market, accounting for 67.0% of listings.
- 15.0% of properties accommodate 6+ guests, serving the market segment for larger families or group travel in Insel Poel.
- On average, properties in Insel Poel are equipped to host 4.0 guests.
Insel Poel Airbnb Booking Patterns (2026): Available vs. Booked Days
Available Days Distribution
Booked Days Distribution
Booking Pattern Insights for Insel Poel
- The most common availability pattern in Insel Poel falls within the 271-366 days range, representing 74% of listings. This suggests many properties have significant open periods on their calendars.
- Approximately 94.0% of listings show high availability (181+ days open annually), indicating potential for increased bookings or specific owner usage patterns.
- For booked days, the 31-90 days range is most frequent in Insel Poel (57%), reflecting common guest stay durations or potential owner blocking patterns.
- A notable 8.0% of properties secure long booking periods (181+ days booked per year), highlighting successful long-term rental strategies or significant owner usage.
Insel Poel Airbnb Minimum Stay Requirements Analysis
Distribution of Listings by Minimum Night Requirement
1 Night
4 listings
4% of total
2 Nights
8 listings
8% of total
3 Nights
6 listings
6% of total
4-6 Nights
4 listings
4% of total
7-29 Nights
1 listings
1% of total
30+ Nights
77 listings
77% of total
Key Insights
- The most prevalent minimum stay requirement in Insel Poel is 30+ Nights, adopted by 77% of listings. This highlights the market's preference for longer commitments.
- Very short stays (1-2 nights) are less common (12.0%), suggesting hosts prefer slightly longer bookings to optimize turnover.
- A significant segment (77%) caters to monthly stays (30+ nights) in Insel Poel, pointing to opportunities in the extended-stay market.
Recommendations
- Align with the market by considering a 30+ Nights minimum stay, as 77% of Insel Poel hosts use this setting.
- If feasible, allowing 1-night stays, especially midweek or during low season, could capture last-minute bookings, as only 4% currently do.
- Explore offering discounts for stays of 30+ nights to attract the 77% of the market seeking extended stays.
- Adjust minimum nights based on seasonality – potentially shorter during low season and longer during peak demand periods in Insel Poel.
Insel Poel Airbnb Cancellation Policy Trends Analysis (2026)
Super Strict 60 Days
36 listings
36% of total
Super Strict 30 Days
20 listings
20% of total
Flexible
5 listings
5% of total
Moderate
3 listings
3% of total
Firm
29 listings
29% of total
Strict
7 listings
7% of total
Cancellation Policy Insights for Insel Poel
- The prevailing Airbnb cancellation policy trend in Insel Poel is Super Strict 60 Days, used by 36% of listings.
- There's a relatively balanced mix between guest-friendly (8.0%) and stricter (36.0%) policies, offering choices for different guest needs.
- Strict cancellation policies are quite rare (7%), potentially making listings with this policy less competitive unless justified by high demand or property type.
Recommendations for Hosts
- Consider adopting a Super Strict 60 Days policy to align with the 36% market standard in Insel Poel.
- Using a Strict policy might deter some guests, as only 7% of listings use it. Evaluate if potential revenue protection outweighs possible lower booking rates.
- Regularly review your cancellation policy against competitors and market demand shifts in Insel Poel.
Insel Poel STR Booking Lead Time Analysis (2026)
Average Booking Lead Time by Month
Booking Lead Time Insights for Insel Poel
- The overall average booking lead time for vacation rentals in Insel Poel is 47 days.
- Guests book furthest in advance for stays during December (average 73 days), likely coinciding with peak travel demand or local events.
- The shortest booking windows occur for stays in January (average 16 days), indicating more last-minute travel plans during this time.
- Seasonally, Summer (51 days avg.) sees the longest lead times, while Spring (28 days avg.) has the shortest, reflecting typical travel planning cycles.
Recommendations for Hosts
- Use the overall average lead time (47 days) as a baseline for your pricing and availability strategy in Insel Poel.
- For December stays, consider implementing length-of-stay discounts or slightly higher rates for bookings made less than 73 days out to capitalize on advance planning.
- Target marketing efforts for the Summer season well in advance (at least 51 days) to capture early planners.
- Monitor your own booking lead times against these Insel Poel averages to identify opportunities for dynamic pricing adjustments.
Popular & Essential Airbnb Amenities in Insel Poel (2026)
Amenity Prevalence
Amenity Insights for Insel Poel
- Essential amenities in Insel Poel that guests expect include: TV, Heating, Dishes and silverware. Lacking these (any) could significantly impact bookings.
- Popular amenities like Smoke alarm, Refrigerator, Coffee maker are common but not universal. Offering these can provide a competitive edge.
Recommendations for Hosts
- Ensure your listing includes all essential amenities for Insel Poel: TV, Heating, Dishes and silverware.
- Prioritize adding missing essentials: TV, Heating, Dishes and silverware.
- Consider adding popular differentiators like Smoke alarm or Refrigerator to increase appeal.
- Highlight unique or less common amenities you offer (e.g., hot tub, dedicated workspace, EV charger) in your listing description and photos.
- Regularly check competitor amenities in Insel Poel to stay competitive.
Insel Poel Airbnb Guest Demographics & Profile Analysis (2026)
Guest Profile Summary for Insel Poel
- The typical guest profile for Airbnb in Insel Poel consists of primarily domestic travelers (92%), often arriving from nearby Berlin, typically belonging to the Post-2000s (Gen Z/Alpha) group (50%), primarily speaking German or English.
- Domestic travelers account for 91.6% of guests.
- Key international markets include Germany (91.6%) and Switzerland (1.9%).
- Top languages spoken are German (39.6%) followed by English (38.6%).
- A significant demographic segment is the Post-2000s (Gen Z/Alpha) group, representing 50% of guests.
Recommendations for Hosts
- Target domestic marketing efforts towards travelers from Berlin and Hamburg.
- Tailor amenities and listing descriptions to appeal to the dominant Post-2000s (Gen Z/Alpha) demographic (e.g., highlight fast WiFi, smart home features, local guides).
- Highlight unique local experiences or amenities relevant to the primary guest profile.
- Consider seasonal promotions aligned with peak travel times for key origin markets.
Nearby Short-Term Rental Market Comparison
How does the Insel Poel Airbnb market stack up against its neighbors? Compare key performance metrics like average monthly revenue, ADR, and occupancy rates in surrounding areas to understand the broader regional STR landscape.
| Market | Active Properties | Monthly Revenue | Daily Rate | Avg. Occupancy |
|---|---|---|---|---|
| Gallin-Kuppentin | 14 | $2,958 | $358.55 | 30% |
| Wittenbeck | 14 | $2,937 | $224.34 | 43% |
| Lohals | 20 | $2,866 | $331.99 | 40% |
| Heiligengrabe | 12 | $2,400 | $226.39 | 39% |
| Copenhagen | 9,111 | $2,347 | $222.94 | 52% |
| Bissee | 13 | $2,338 | $180.13 | 48% |
| Råbylille Strand | 31 | $2,254 | $190.70 | 45% |
| Rude Strand | 27 | $2,198 | $254.15 | 41% |
| Korshavn | 14 | $2,192 | $244.24 | 41% |
| Alt Sührkow | 10 | $2,175 | $426.32 | 28% |