Dierhagen Airbnb Market Analysis 2026: Short Term Rental Data & Vacation Rental Statistics in Mecklenburg-Vorpommern, Germany
Is Airbnb profitable in Dierhagen in 2026? Explore comprehensive Airbnb analytics for Dierhagen, Mecklenburg-Vorpommern, Germany to uncover income potential. This 2026 STR market report for Dierhagen, based on AirROI data from February 2025 to January 2026, reveals key trends in the niche market of 76 active listings.
Whether you're considering an Airbnb investment in Dierhagen, optimizing your existing vacation rental, or exploring rental arbitrage opportunities, understanding the Dierhagen Airbnb data is crucial. Leveraging the low regulation environment is key to maximizing your short term rental income potential. Let's dive into the specifics.
Key Dierhagen Airbnb Performance Metrics Overview
Monthly Airbnb Revenue Variations & Income Potential in Dierhagen (2026)
Understanding the monthly revenue variations for Airbnb listings in Dierhagen is key to maximizing your short term rental income potential. Seasonality significantly impacts earnings. Our analysis, based on data from the past 12 months, shows that the peak revenue month for STRs in Dierhagen is typically August, while January often presents the lowest earnings, highlighting opportunities for strategic pricing adjustments during shoulder and low seasons. Explore the typical Airbnb income in Dierhagen across different performance tiers:
- Best-in-class properties (Top 10%) achieve $3,709+ monthly, often utilizing dynamic pricing and superior guest experiences.
- Strong performing properties (Top 25%) earn $2,540 or more, indicating effective management and desirable locations/amenities.
- Typical properties (Median) generate around $1,610 per month, representing the average market performance.
- Entry-level properties (Bottom 25%) see earnings around $949, often with potential for optimization.
Average Monthly Airbnb Earnings Trend in Dierhagen
Dierhagen Airbnb Occupancy Rate Trends (2026)
Maximize your bookings by understanding the Dierhagen STR occupancy trends. Seasonal demand shifts significantly influence how often properties are booked. Typically, Augustsees the highest demand (peak season occupancy), while January experiences the lowest (low season). Effective strategies, like adjusting minimum stays or offering promotions, can boost occupancy during slower periods. Here's how different property tiers perform in Dierhagen:
- Best-in-class properties (Top 10%) achieve 71%+ occupancy, indicating high desirability and potentially optimized availability.
- Strong performing properties (Top 25%) maintain 58% or higher occupancy, suggesting good market fit and guest satisfaction.
- Typical properties (Median) have an occupancy rate around 39%.
- Entry-level properties (Bottom 25%) average 23% occupancy, potentially facing higher vacancy.
Average Monthly Occupancy Rate Trend in Dierhagen
Average Daily Rate (ADR) Airbnb Trends in Dierhagen (2026)
Effective short term rental pricing strategy in Dierhagen involves understanding monthly ADR fluctuations. The Average Daily Rate (ADR) for Airbnb in Dierhagen typically peaks in September and dips lowest during February. Leveraging Airbnb dynamic pricing tools or strategies based on this seasonality can significantly boost revenue. Here's a look at the typical nightly rates achieved:
- Best-in-class properties (Top 10%) command rates of $311+ per night, often due to premium features or locations.
- Strong performing properties (Top 25%) achieve nightly rates of $205 or more.
- Typical properties (Median) charge around $156 per night.
- Entry-level properties (Bottom 25%) earn around $118 per night.
Average Daily Rate (ADR) Trend by Month in Dierhagen
Get Live Dierhagen Market Intelligence 👇

Explore Real-time Analytics
Airbnb Seasonality Analysis & Trends in Dierhagen (2026)
Peak Season (August, July, June)
- Revenue averages $3,267 per month
- Occupancy rates average 63.0%
- Daily rates average $193
Shoulder Season
- Revenue averages $1,797 per month
- Occupancy maintains around 36.8%
- Daily rates hold near $183
Low Season (January, February, November)
- Revenue drops to average $1,253 per month
- Occupancy decreases to average 26.6%
- Daily rates adjust to average $182
Seasonality Insights for Dierhagen
- The Airbnb seasonality in Dierhagen shows highly seasonal trends requiring careful strategy. While the sections above show seasonal averages, it's also insightful to look at the extremes:
- During the high season, the absolute peak month showcases Dierhagen's highest earning potential, with monthly revenues capable of climbing to $3,733, occupancy reaching a high of 73.1%, and ADRs peaking at $196.
- Conversely, the slowest single month of the year, typically falling within the low season, marks the market's lowest point. In this month, revenue might dip to $774, occupancy could drop to 14.0%, and ADRs may adjust down to $166.
- Understanding both the seasonal averages and these monthly peaks and troughs in revenue, occupancy, and ADR is crucial for maximizing your Airbnb profit potential in Dierhagen.
Seasonal Strategies for Maximizing Profit
- Peak Season: Maximize revenue through premium pricing and potentially longer minimum stays. Ensure high availability.
- Low Season: Offer competitive pricing, special promotions (e.g., extended stay discounts), and flexible cancellation policies. Target off-season travelers like remote workers or budget-conscious guests.
- Shoulder Seasons: Implement dynamic pricing that balances peak and low rates. Target weekend travelers or specific events. Offer slightly more flexible terms than peak season.
- Regularly analyze your own performance against these Dierhagen seasonality benchmarks and adjust your pricing and availability strategy accordingly.
Best Areas for Airbnb Investment in Dierhagen (2026)
Exploring the top neighborhoods for short-term rentals in Dierhagen? This section highlights key areas, outlining why they are attractive for hosts and guests, along with notable local attractions. Consider these locations based on your target guest profile and investment strategy.
| Neighborhood / Area | Why Host Here? (Target Guests & Appeal) | Key Attractions & Landmarks |
|---|---|---|
| Dierhagen Strand | Popular beach destination known for its beautiful sandy beaches and calm waters. Ideal for families and beach lovers seeking a relaxing holiday by the sea. | Dierhagen Beach, Boddenpromenade, Küstenwald, Beach volleyball courts, Water sports activities |
| Dierhagen Ost | A quiet area known for its natural beauty and access to walking paths and the nearby sea. Appeals to nature lovers and those seeking a peaceful retreat. | Nature trails, Bodden landscape, Bird watching, Fishing spots |
| Dierhagen West | A less crowded beach area featuring quaint accommodations and close proximity to local cafes and restaurants. Perfect for visitors wanting a chill beach vibe. | Local beach spots, Restaurants and cafes, Cycling paths, Scenic views |
| Weststrand | Famous for its breathtaking cliffs and forested areas, this location draws visitors looking to explore nature and enjoy scenic hikes. | Weststrand Beach, Jasmund National Park, Hiking trails, Scenic cliffs |
| Fischland-Darß-Zingst Peninsula | Known for its stunning coastal landscapes and wildlife, it's a sought-after destination for outdoor activities like kite surfing and hiking. | Kite surfing opportunities, Wildlife watching, National Parks, Cultural events |
| Ahrenshoop | Artistic village famous for its vibrant art scene and galleries. Attracts culture enthusiasts and art lovers from around the world. | Ahrenshoop Art Gallery, Local artisan shops, Beautiful beaches, Art events |
| Ribnitz-Damgarten | Nearby town with rich history and charming architecture, providing additional options for tourists who want to explore the surrounding areas. | Ribnitz Damgarten Museum, Historic town center, Local markets, Scenic parks |
| Rosenhof | A tranquil area perfect for a relaxing getaway close to nature, ideal for couples and families seeking a serene vacation environment. | Bodden views, Nature parks, Cycling paths, Quiet cafes |
Understanding Airbnb License Requirements & STR Laws in Dierhagen (2026)
While Dierhagen, Mecklenburg-Vorpommern, Germany currently shows low STR regulations, specific Airbnb license requirements might still exist or change. Always verify the latest short term rental regulations and Airbnb license requirements directly with local government authorities for Dierhagen to ensure full compliance before hosting.
(Source: AirROI data, 2026, finding no licensed listings among those analyzed)
Top Performing Airbnb Properties in Dierhagen (2026)
Benchmark your potential! Explore examples of top-performing Airbnb properties in Dierhagenbased on Trailing Twelve Month (TTM) revenue. Analyze their characteristics, revenue, occupancy rate, and ADR to understand what drives success in this market.

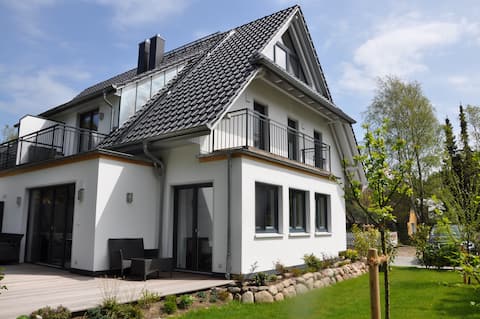
Dünenhaus Dierhagen
Entire Place • 3 bedrooms
Exclusive holiday home by the forest, beach access, sauna
Entire Place • 4 bedrooms

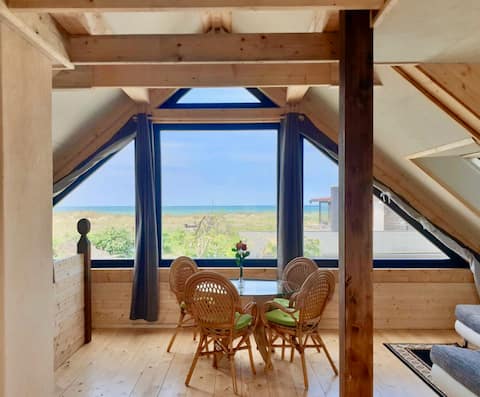
Dünenwald vacation home
Entire Place • 2 bedrooms
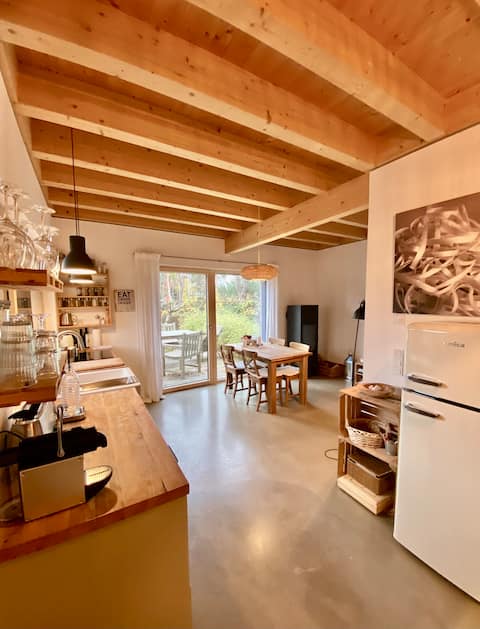
Eco-Friendly Wooden House in Beach Proximity
Entire Place • 2 bedrooms
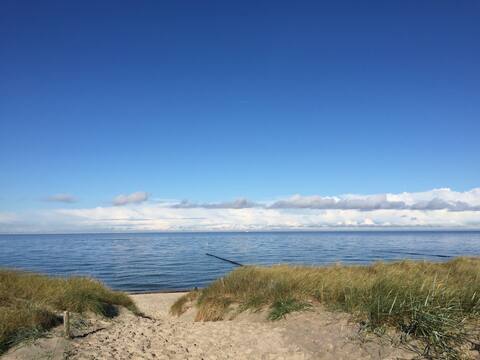
Right on the beach of the Baltic Sea resort Dierhagen 40 sqm
Entire Place • 1 bedroom
Dars-Ostsee-Dierhagen Blockhaus Apartment 1
Entire Place • 1 bedroom
Note: Performance varies based on location, size, amenities, seasonality, and management quality. Data reflects the past 12 months.
Top Performing Airbnb Hosts in Dierhagen (2026)
Learn from the best! This table showcases top-performing Airbnb hosts in Dierhagen based on the number of properties managed and estimated total revenue over the past year. Analyze their scale and performance metrics.
| Host Name | Properties | Grossing Revenue | Stay Reviews | Avg Rating |
|---|---|---|---|---|
| Weststrandbooking | 1 | $108,425 | 6 | 5.00/5.0 |
| Dara Und Uli | 4 | $81,040 | 889 | 4.84/5.0 |
| Anneliese | 2 | $74,929 | 15 | 5.00/5.0 |
| Steven | 3 | $73,147 | 100 | 4.71/5.0 |
| Rabea | 4 | $55,973 | 109 | 4.90/5.0 |
| Sabine | 1 | $42,495 | 121 | 4.97/5.0 |
| Uta | 1 | $41,206 | 82 | 4.95/5.0 |
| Pia | 2 | $35,158 | 72 | 4.79/5.0 |
| Jana | 2 | $29,406 | 78 | 4.93/5.0 |
| Andre' / Romy | 1 | $29,356 | 122 | 4.96/5.0 |
Analyzing the strategies of top hosts, such as their property selection, pricing, and guest communication, can offer valuable lessons for optimizing your own Airbnb operations in Dierhagen.
Dive Deeper: Advanced Dierhagen STR Market Data (2026)
Ready to unlock more insights? AirROI provides access to advanced metrics and comprehensive Airbnb data for Dierhagen. Explore detailed analytics beyond this report to refine your investment strategy, optimize pricing, and maximize your vacation rental profits.
Explore Advanced MetricsDierhagen Short-Term Rental Market Composition (2026): Property & Room Types
Room Type Distribution
Property Type Distribution
Market Composition Insights for Dierhagen
- The Dierhagen Airbnb market composition is heavily skewed towards Entire Home/Apt listings, which make up 94.7% of the 76 active rentals. This indicates strong guest preference for privacy and space.
- Looking at the property type distribution in Dierhagen, Apartment/Condo properties are the most common (57.9%), reflecting the local real estate landscape.
- Houses represent a significant 32.9% portion, catering likely to families or larger groups.
- Smaller segments like others, hotel/boutique (combined 3.9%) offer potential for unique stay experiences.
Dierhagen Airbnb Room Capacity Analysis (2026): Bedroom Distribution
Distribution of Listings by Number of Bedrooms
Room Capacity Insights for Dierhagen
- The dominant room capacity in Dierhagen is 1 bedroom listings, making up 40.8% of the market. This suggests a strong demand for properties suitable for couples or solo travelers.
- Together, 1 bedroom and 2 bedrooms properties represent 75.0% of the active Airbnb listings in Dierhagen, indicating a high concentration in these sizes.
Dierhagen Vacation Rental Guest Capacity Trends (2026)
Distribution of Listings by Guest Capacity
Guest Capacity Insights for Dierhagen
- The most common guest capacity trend in Dierhagen vacation rentals is listings accommodating 4 guests (38.2%). This suggests the primary traveler segment is likely small families or groups.
- Properties designed for 4 guests and 2 guests dominate the Dierhagen STR market, accounting for 55.3% of listings.
- 19.7% of properties accommodate 6+ guests, serving the market segment for larger families or group travel in Dierhagen.
- On average, properties in Dierhagen are equipped to host 3.8 guests.
Dierhagen Airbnb Booking Patterns (2026): Available vs. Booked Days
Available Days Distribution
Booked Days Distribution
Booking Pattern Insights for Dierhagen
- The most common availability pattern in Dierhagen falls within the 271-366 days range, representing 52.6% of listings. This suggests many properties have significant open periods on their calendars.
- Approximately 89.4% of listings show high availability (181+ days open annually), indicating potential for increased bookings or specific owner usage patterns.
- For booked days, the 91-180 days range is most frequent in Dierhagen (36.8%), reflecting common guest stay durations or potential owner blocking patterns.
- A notable 13.1% of properties secure long booking periods (181+ days booked per year), highlighting successful long-term rental strategies or significant owner usage.
Dierhagen Airbnb Minimum Stay Requirements Analysis
Distribution of Listings by Minimum Night Requirement
1 Night
2 listings
2.6% of total
2 Nights
2 listings
2.6% of total
3 Nights
10 listings
13.2% of total
4-6 Nights
20 listings
26.3% of total
30+ Nights
42 listings
55.3% of total
Key Insights
- The most prevalent minimum stay requirement in Dierhagen is 30+ Nights, adopted by 55.3% of listings. This highlights the market's preference for longer commitments.
- Very short stays (1-2 nights) are less common (5.2%), suggesting hosts prefer slightly longer bookings to optimize turnover.
- A significant segment (55.3%) caters to monthly stays (30+ nights) in Dierhagen, pointing to opportunities in the extended-stay market.
Recommendations
- Align with the market by considering a 30+ Nights minimum stay, as 55.3% of Dierhagen hosts use this setting.
- If feasible, allowing 1-night stays, especially midweek or during low season, could capture last-minute bookings, as only 2.6% currently do.
- Explore offering discounts for stays of 30+ nights to attract the 55.3% of the market seeking extended stays.
- Adjust minimum nights based on seasonality – potentially shorter during low season and longer during peak demand periods in Dierhagen.
Dierhagen Airbnb Cancellation Policy Trends Analysis (2026)
Super Strict 30 Days
1 listings
1.3% of total
Super Strict 60 Days
2 listings
2.6% of total
Flexible
11 listings
14.5% of total
Moderate
4 listings
5.3% of total
Firm
46 listings
60.5% of total
Strict
12 listings
15.8% of total
Cancellation Policy Insights for Dierhagen
- The prevailing Airbnb cancellation policy trend in Dierhagen is Firm, used by 60.5% of listings.
- A majority (76.3%) of hosts in Dierhagen utilize Firm or Strict policies, indicating a market where hosts prioritize booking security.
Recommendations for Hosts
- Consider adopting a Firm policy to align with the 60.5% market standard in Dierhagen.
- Regularly review your cancellation policy against competitors and market demand shifts in Dierhagen.
Dierhagen STR Booking Lead Time Analysis (2026)
Average Booking Lead Time by Month
Booking Lead Time Insights for Dierhagen
- The overall average booking lead time for vacation rentals in Dierhagen is 97 days.
- Guests book furthest in advance for stays during July (average 144 days), likely coinciding with peak travel demand or local events.
- The shortest booking windows occur for stays in February (average 49 days), indicating more last-minute travel plans during this time.
- Seasonally, Summer (129 days avg.) sees the longest lead times, while Winter (76 days avg.) has the shortest, reflecting typical travel planning cycles.
Recommendations for Hosts
- Use the overall average lead time (97 days) as a baseline for your pricing and availability strategy in Dierhagen.
- For July stays, consider implementing length-of-stay discounts or slightly higher rates for bookings made less than 144 days out to capitalize on advance planning.
- Target marketing efforts for the Summer season well in advance (at least 129 days) to capture early planners.
- Monitor your own booking lead times against these Dierhagen averages to identify opportunities for dynamic pricing adjustments.
Popular & Essential Airbnb Amenities in Dierhagen (2026)
Amenity Prevalence
Amenity Insights for Dierhagen
- Essential amenities in Dierhagen that guests expect include: Free parking on premises, Kitchen, TV. Lacking these (any) could significantly impact bookings.
- Popular amenities like Wifi, Heating, Refrigerator are common but not universal. Offering these can provide a competitive edge.
- Warning: Wifi is not universally provided but is considered essential globally. Ensure reliable Wifi is offered.
Recommendations for Hosts
- Ensure your listing includes all essential amenities for Dierhagen: Free parking on premises, Kitchen, TV.
- Prioritize adding missing essentials: Free parking on premises, Kitchen, TV.
- Consider adding popular differentiators like Wifi or Heating to increase appeal.
- Highlight unique or less common amenities you offer (e.g., hot tub, dedicated workspace, EV charger) in your listing description and photos.
- Regularly check competitor amenities in Dierhagen to stay competitive.
Dierhagen Airbnb Guest Demographics & Profile Analysis (2026)
Guest Profile Summary for Dierhagen
- The typical guest profile for Airbnb in Dierhagen consists of primarily domestic travelers (91%), often arriving from nearby Berlin, typically belonging to the Post-2000s (Gen Z/Alpha) group (50%), primarily speaking German or English.
- Domestic travelers account for 91.3% of guests.
- Key international markets include Germany (91.3%) and Netherlands (1.9%).
- Top languages spoken are German (39.9%) followed by English (38.7%).
- A significant demographic segment is the Post-2000s (Gen Z/Alpha) group, representing 50% of guests.
Recommendations for Hosts
- Target domestic marketing efforts towards travelers from Berlin and Dresden.
- Tailor amenities and listing descriptions to appeal to the dominant Post-2000s (Gen Z/Alpha) demographic (e.g., highlight fast WiFi, smart home features, local guides).
- Highlight unique local experiences or amenities relevant to the primary guest profile.
- Consider seasonal promotions aligned with peak travel times for key origin markets.
Nearby Short-Term Rental Market Comparison
How does the Dierhagen Airbnb market stack up against its neighbors? Compare key performance metrics like average monthly revenue, ADR, and occupancy rates in surrounding areas to understand the broader regional STR landscape.
| Market | Active Properties | Monthly Revenue | Daily Rate | Avg. Occupancy |
|---|---|---|---|---|
| Gallin-Kuppentin | 14 | $2,958 | $358.55 | 30% |
| Wittenbeck | 14 | $2,937 | $224.34 | 43% |
| Groß Nemerow | 13 | $2,404 | $135.17 | 60% |
| Heiligengrabe | 12 | $2,400 | $226.39 | 39% |
| Copenhagen | 9,111 | $2,347 | $222.94 | 52% |
| Råbylille Strand | 31 | $2,254 | $190.70 | 45% |
| Alt Sührkow | 10 | $2,175 | $426.32 | 28% |
| Frederiksberg | 1,015 | $2,062 | $217.28 | 50% |
| Solrød Strand | 54 | $2,032 | $249.51 | 48% |
| Hellerup | 11 | $1,973 | $298.07 | 51% |