Wurster Nordseeküste Airbnb Market Analysis 2026: Short Term Rental Data & Vacation Rental Statistics in Lower Saxony, Germany
Is Airbnb profitable in Wurster Nordseeküste in 2026? Explore comprehensive Airbnb analytics for Wurster Nordseeküste, Lower Saxony, Germany to uncover income potential. This 2026 STR market report for Wurster Nordseeküste, based on AirROI data from February 2025 to January 2026, reveals key trends in the niche market of 168 active listings.
Whether you're considering an Airbnb investment in Wurster Nordseeküste, optimizing your existing vacation rental, or exploring rental arbitrage opportunities, understanding the Wurster Nordseeküste Airbnb data is crucial. Leveraging the low regulation environment is key to maximizing your short term rental income potential. Let's dive into the specifics.
Key Wurster Nordseeküste Airbnb Performance Metrics Overview
Monthly Airbnb Revenue Variations & Income Potential in Wurster Nordseeküste (2026)
Understanding the monthly revenue variations for Airbnb listings in Wurster Nordseeküste is key to maximizing your short term rental income potential. Seasonality significantly impacts earnings. Our analysis, based on data from the past 12 months, shows that the peak revenue month for STRs in Wurster Nordseeküste is typically August, while January often presents the lowest earnings, highlighting opportunities for strategic pricing adjustments during shoulder and low seasons. Explore the typical Airbnb income in Wurster Nordseeküste across different performance tiers:
- Best-in-class properties (Top 10%) achieve $2,679+ monthly, often utilizing dynamic pricing and superior guest experiences.
- Strong performing properties (Top 25%) earn $1,794 or more, indicating effective management and desirable locations/amenities.
- Typical properties (Median) generate around $957 per month, representing the average market performance.
- Entry-level properties (Bottom 25%) see earnings around $421, often with potential for optimization.
Average Monthly Airbnb Earnings Trend in Wurster Nordseeküste
Wurster Nordseeküste Airbnb Occupancy Rate Trends (2026)
Maximize your bookings by understanding the Wurster Nordseeküste STR occupancy trends. Seasonal demand shifts significantly influence how often properties are booked. Typically, Augustsees the highest demand (peak season occupancy), while January experiences the lowest (low season). Effective strategies, like adjusting minimum stays or offering promotions, can boost occupancy during slower periods. Here's how different property tiers perform in Wurster Nordseeküste:
- Best-in-class properties (Top 10%) achieve 69%+ occupancy, indicating high desirability and potentially optimized availability.
- Strong performing properties (Top 25%) maintain 51% or higher occupancy, suggesting good market fit and guest satisfaction.
- Typical properties (Median) have an occupancy rate around 31%.
- Entry-level properties (Bottom 25%) average 12% occupancy, potentially facing higher vacancy.
Average Monthly Occupancy Rate Trend in Wurster Nordseeküste
Average Daily Rate (ADR) Airbnb Trends in Wurster Nordseeküste (2026)
Effective short term rental pricing strategy in Wurster Nordseeküste involves understanding monthly ADR fluctuations. The Average Daily Rate (ADR) for Airbnb in Wurster Nordseeküste typically peaks in October and dips lowest during February. Leveraging Airbnb dynamic pricing tools or strategies based on this seasonality can significantly boost revenue. Here's a look at the typical nightly rates achieved:
- Best-in-class properties (Top 10%) command rates of $196+ per night, often due to premium features or locations.
- Strong performing properties (Top 25%) achieve nightly rates of $154 or more.
- Typical properties (Median) charge around $118 per night.
- Entry-level properties (Bottom 25%) earn around $88 per night.
Average Daily Rate (ADR) Trend by Month in Wurster Nordseeküste
Get Live Wurster Nordseeküste Market Intelligence 👇

Explore Real-time Analytics
Airbnb Seasonality Analysis & Trends in Wurster Nordseeküste (2026)
Peak Season (August, July, October)
- Revenue averages $1,890 per month
- Occupancy rates average 47.6%
- Daily rates average $135
Shoulder Season
- Revenue averages $1,266 per month
- Occupancy maintains around 33.5%
- Daily rates hold near $130
Low Season (January, February, March)
- Revenue drops to average $711 per month
- Occupancy decreases to average 21.8%
- Daily rates adjust to average $119
Seasonality Insights for Wurster Nordseeküste
- The Airbnb seasonality in Wurster Nordseeküste shows highly seasonal trends requiring careful strategy. While the sections above show seasonal averages, it's also insightful to look at the extremes:
- During the high season, the absolute peak month showcases Wurster Nordseeküste's highest earning potential, with monthly revenues capable of climbing to $2,128, occupancy reaching a high of 53.0%, and ADRs peaking at $152.
- Conversely, the slowest single month of the year, typically falling within the low season, marks the market's lowest point. In this month, revenue might dip to $618, occupancy could drop to 14.0%, and ADRs may adjust down to $101.
- Understanding both the seasonal averages and these monthly peaks and troughs in revenue, occupancy, and ADR is crucial for maximizing your Airbnb profit potential in Wurster Nordseeküste.
Seasonal Strategies for Maximizing Profit
- Peak Season: Maximize revenue through premium pricing and potentially longer minimum stays. Ensure high availability.
- Low Season: Offer competitive pricing, special promotions (e.g., extended stay discounts), and flexible cancellation policies. Target off-season travelers like remote workers or budget-conscious guests.
- Shoulder Seasons: Implement dynamic pricing that balances peak and low rates. Target weekend travelers or specific events. Offer slightly more flexible terms than peak season.
- Regularly analyze your own performance against these Wurster Nordseeküste seasonality benchmarks and adjust your pricing and availability strategy accordingly.
Best Areas for Airbnb Investment in Wurster Nordseeküste (2026)
Exploring the top neighborhoods for short-term rentals in Wurster Nordseeküste? This section highlights key areas, outlining why they are attractive for hosts and guests, along with notable local attractions. Consider these locations based on your target guest profile and investment strategy.
| Neighborhood / Area | Why Host Here? (Target Guests & Appeal) | Key Attractions & Landmarks |
|---|---|---|
| Cuxhaven | A charming coastal town known for its beautiful beaches and the UNESCO World Heritage Site of Wadden Sea. It offers opportunities for water sports and relaxing beach holidays, making it attractive for families and nature lovers. | Cuxhaven Beach, Wadden Sea National Park, Kugelbake, Alte Liebe, Cuxhaven Harbour |
| Norddeich | This seaside resort is famous for its family-friendly beaches, tidal flats, and the Norddeich Sea Wave spa. Perfect for families seeking relaxation and leisure activities. | Norddeich Beach, Ocean Wave Water Park, Seehundstation Norddeich, Norddeich Windmill, Badestrand Norddeich |
| Bremerhaven | A vibrant port city with a rich maritime history. It's an attraction for ocean enthusiasts and visitors interested in museums and aquariums. | German Emigration Center, Klimahaus Bremerhaven 8° Ost, Zoo am Meer, Columbus Center, Old Port Area |
| Wilhelmshaven | Known for its naval base and the stunning coastline. Offers a mix of history, nature, and seaside activities, appealing to both tourists and business travelers. | Wilhelmshaven Maritime Museum, JadeWeserPort, Küstenmuseum, South Beach, Wilhelmshaven Beach |
| Sahlenburg | A tranquil beach location with a focus on nature and relaxation, attracting visitors to its serene beaches and surrounding landscapes. | Sahlenburg Beach, Sahlenburg Dunes, German South Sea Museum, Cuxhaven Duhnen Beach, Nationalpark Niedersächsisches Wattenmeer |
| Borkum | The largest of the East Frisian Islands, Borkum is famous for its fresh air and sandy beaches, attracting health tourists and those seeking relaxation. | Borkum Beach, Küstenmuseum Borkum, Dünenmeer, Borkum Lighthouse, Seabridge |
| Norderney | As a popular North Sea resort, Norderney offers a mix of health-conscious tourism and recreational activities, attracting visitors throughout the year. | Norderney Beach, Badehaus Norderney, Wadden Sea World Heritage Site, Norderney Lighthouse, Kurplatz |
| Dangast | A small coastal village known for its historical charm and artistic community. It’s perfect for visitors seeking a quieter beach experience and cultural events. | Dangast Beach, Kunsthaus Dangast, Vareler Hafen, Dangast Artists' Colony, Historical Museums |
Understanding Airbnb License Requirements & STR Laws in Wurster Nordseeküste (2026)
While Wurster Nordseeküste, Lower Saxony, Germany currently shows low STR regulations, specific Airbnb license requirements might still exist or change. Always verify the latest short term rental regulations and Airbnb license requirements directly with local government authorities for Wurster Nordseeküste to ensure full compliance before hosting.
(Source: AirROI data, 2026, based on 1% licensed listings)
Top Performing Airbnb Properties in Wurster Nordseeküste (2026)
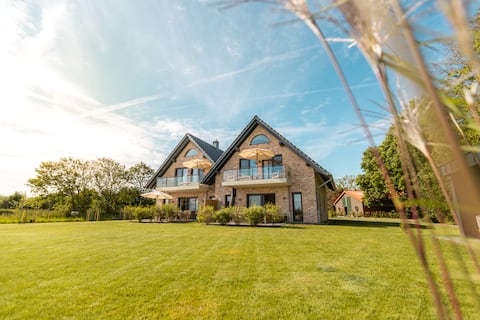
Benchmark your potential! Explore examples of top-performing Airbnb properties in Wurster Nordseeküstebased on Trailing Twelve Month (TTM) revenue. Analyze their characteristics, revenue, occupancy rate, and ADR to understand what drives success in this market.

Nordseehof Brömmer vacation home
Entire Place • 2 bedrooms

Marica´s seafood wellness
Entire Place • 3 bedrooms

Lovely home in Wurster North Sea coast
Entire Place • 5 bedrooms
Nordseehof Brömmer Wattenhus
Entire Place • 4 bedrooms
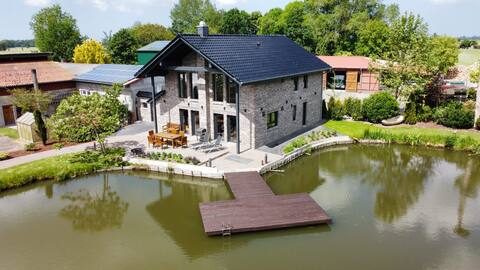
Exclusive lake house
Entire Place • 4 bedrooms

Exclusive country house with wellness area / North Sea
Entire Place • 4 bedrooms
Note: Performance varies based on location, size, amenities, seasonality, and management quality. Data reflects the past 12 months.
Top Performing Airbnb Hosts in Wurster Nordseeküste (2026)
Learn from the best! This table showcases top-performing Airbnb hosts in Wurster Nordseeküste based on the number of properties managed and estimated total revenue over the past year. Analyze their scale and performance metrics.
| Host Name | Properties | Grossing Revenue | Stay Reviews | Avg Rating |
|---|---|---|---|---|
| Christine | 9 | $273,366 | 373 | 4.97/5.0 |
| Claudia | 8 | $92,763 | 112 | 4.85/5.0 |
| Deine | 16 | $92,249 | 63 | 4.85/5.0 |
| Jan-Hinrik | 10 | $89,294 | 178 | 4.81/5.0 |
| Constanze | 11 | $60,602 | 193 | 4.46/5.0 |
| Jörg | 2 | $55,974 | 27 | 5.00/5.0 |
| Manuel | 11 | $49,096 | 260 | 4.97/5.0 |
| Kai | 1 | $45,957 | 48 | 4.90/5.0 |
| Novasol | 1 | $44,081 | 5 | 5.00/5.0 |
| Simon Und Corinna | 1 | $40,281 | 13 | 4.46/5.0 |
Analyzing the strategies of top hosts, such as their property selection, pricing, and guest communication, can offer valuable lessons for optimizing your own Airbnb operations in Wurster Nordseeküste.
Dive Deeper: Advanced Wurster Nordseeküste STR Market Data (2026)
Ready to unlock more insights? AirROI provides access to advanced metrics and comprehensive Airbnb data for Wurster Nordseeküste. Explore detailed analytics beyond this report to refine your investment strategy, optimize pricing, and maximize your vacation rental profits.
Explore Advanced MetricsWurster Nordseeküste Short-Term Rental Market Composition (2026): Property & Room Types
Room Type Distribution
Property Type Distribution
Market Composition Insights for Wurster Nordseeküste
- The Wurster Nordseeküste Airbnb market composition is heavily skewed towards Entire Home/Apt listings, which make up 94% of the 168 active rentals. This indicates strong guest preference for privacy and space.
- Looking at the property type distribution in Wurster Nordseeküste, Apartment/Condo properties are the most common (66.7%), reflecting the local real estate landscape.
- Houses represent a significant 24.4% portion, catering likely to families or larger groups.
- Smaller segments like outdoor/unique, unique stays, hotel/boutique (combined 9.0%) offer potential for unique stay experiences.
Wurster Nordseeküste Airbnb Room Capacity Analysis (2026): Bedroom Distribution
Distribution of Listings by Number of Bedrooms
Room Capacity Insights for Wurster Nordseeküste
- The dominant room capacity in Wurster Nordseeküste is 1 bedroom listings, making up 43.5% of the market. This suggests a strong demand for properties suitable for couples or solo travelers.
- Together, 1 bedroom and 2 bedrooms properties represent 79.8% of the active Airbnb listings in Wurster Nordseeküste, indicating a high concentration in these sizes.
Wurster Nordseeküste Vacation Rental Guest Capacity Trends (2026)
Distribution of Listings by Guest Capacity
Guest Capacity Insights for Wurster Nordseeküste
- The most common guest capacity trend in Wurster Nordseeküste vacation rentals is listings accommodating 4 guests (41.1%). This suggests the primary traveler segment is likely small families or groups.
- Properties designed for 4 guests and 2 guests dominate the Wurster Nordseeküste STR market, accounting for 65.5% of listings.
- 20.9% of properties accommodate 6+ guests, serving the market segment for larger families or group travel in Wurster Nordseeküste.
- On average, properties in Wurster Nordseeküste are equipped to host 3.8 guests.
Wurster Nordseeküste Airbnb Booking Patterns (2026): Available vs. Booked Days
Available Days Distribution
Booked Days Distribution
Booking Pattern Insights for Wurster Nordseeküste
- The most common availability pattern in Wurster Nordseeküste falls within the 271-366 days range, representing 63.1% of listings. This suggests many properties have significant open periods on their calendars.
- Approximately 89.9% of listings show high availability (181+ days open annually), indicating potential for increased bookings or specific owner usage patterns.
- For booked days, the 31-90 days range is most frequent in Wurster Nordseeküste (38.7%), reflecting common guest stay durations or potential owner blocking patterns.
- A notable 11.3% of properties secure long booking periods (181+ days booked per year), highlighting successful long-term rental strategies or significant owner usage.
Wurster Nordseeküste Airbnb Minimum Stay Requirements Analysis
Distribution of Listings by Minimum Night Requirement
1 Night
16 listings
9.5% of total
2 Nights
24 listings
14.3% of total
3 Nights
12 listings
7.1% of total
4-6 Nights
20 listings
11.9% of total
7-29 Nights
4 listings
2.4% of total
30+ Nights
92 listings
54.8% of total
Key Insights
- The most prevalent minimum stay requirement in Wurster Nordseeküste is 30+ Nights, adopted by 54.8% of listings. This highlights the market's preference for longer commitments.
- A significant segment (54.8%) caters to monthly stays (30+ nights) in Wurster Nordseeküste, pointing to opportunities in the extended-stay market.
Recommendations
- Align with the market by considering a 30+ Nights minimum stay, as 54.8% of Wurster Nordseeküste hosts use this setting.
- If feasible, allowing 1-night stays, especially midweek or during low season, could capture last-minute bookings, as only 9.5% currently do.
- Explore offering discounts for stays of 30+ nights to attract the 54.8% of the market seeking extended stays.
- Adjust minimum nights based on seasonality – potentially shorter during low season and longer during peak demand periods in Wurster Nordseeküste.
Wurster Nordseeküste Airbnb Cancellation Policy Trends Analysis (2026)
Super Strict 30 Days
3 listings
1.8% of total
Super Strict 60 Days
5 listings
3% of total
Flexible
36 listings
21.4% of total
Moderate
19 listings
11.3% of total
Firm
74 listings
44% of total
Strict
31 listings
18.5% of total
Cancellation Policy Insights for Wurster Nordseeküste
- The prevailing Airbnb cancellation policy trend in Wurster Nordseeküste is Firm, used by 44% of listings.
- A majority (62.5%) of hosts in Wurster Nordseeküste utilize Firm or Strict policies, indicating a market where hosts prioritize booking security.
Recommendations for Hosts
- Consider adopting a Firm policy to align with the 44% market standard in Wurster Nordseeküste.
- Regularly review your cancellation policy against competitors and market demand shifts in Wurster Nordseeküste.
Wurster Nordseeküste STR Booking Lead Time Analysis (2026)
Average Booking Lead Time by Month
Booking Lead Time Insights for Wurster Nordseeküste
- The overall average booking lead time for vacation rentals in Wurster Nordseeküste is 67 days.
- Guests book furthest in advance for stays during July (average 91 days), likely coinciding with peak travel demand or local events.
- The shortest booking windows occur for stays in January (average 29 days), indicating more last-minute travel plans during this time.
- Seasonally, Summer (83 days avg.) sees the longest lead times, while Winter (35 days avg.) has the shortest, reflecting typical travel planning cycles.
Recommendations for Hosts
- Use the overall average lead time (67 days) as a baseline for your pricing and availability strategy in Wurster Nordseeküste.
- For July stays, consider implementing length-of-stay discounts or slightly higher rates for bookings made less than 91 days out to capitalize on advance planning.
- Target marketing efforts for the Summer season well in advance (at least 83 days) to capture early planners.
- Monitor your own booking lead times against these Wurster Nordseeküste averages to identify opportunities for dynamic pricing adjustments.
Popular & Essential Airbnb Amenities in Wurster Nordseeküste (2026)
Amenity Prevalence
Amenity Insights for Wurster Nordseeküste
- Essential amenities in Wurster Nordseeküste that guests expect include: Heating. Lacking these (this) could significantly impact bookings.
- Popular amenities like Wifi, Free parking on premises, TV are common but not universal. Offering these can provide a competitive edge.
- Warning: Wifi is not universally provided but is considered essential globally. Ensure reliable Wifi is offered.
Recommendations for Hosts
- Ensure your listing includes all essential amenities for Wurster Nordseeküste: Heating.
- Prioritize adding missing essentials: Heating.
- Consider adding popular differentiators like Wifi or Free parking on premises to increase appeal.
- Highlight unique or less common amenities you offer (e.g., hot tub, dedicated workspace, EV charger) in your listing description and photos.
- Regularly check competitor amenities in Wurster Nordseeküste to stay competitive.
Wurster Nordseeküste Airbnb Guest Demographics & Profile Analysis (2026)
Guest Profile Summary for Wurster Nordseeküste
- The typical guest profile for Airbnb in Wurster Nordseeküste consists of primarily domestic travelers (92%), often arriving from nearby Hanover, typically belonging to the Post-2000s (Gen Z/Alpha) group (50%), primarily speaking German or English.
- Domestic travelers account for 92.4% of guests.
- Key international markets include Germany (92.4%) and Netherlands (1.3%).
- Top languages spoken are German (40.9%) followed by English (40.6%).
- A significant demographic segment is the Post-2000s (Gen Z/Alpha) group, representing 50% of guests.
Recommendations for Hosts
- Target domestic marketing efforts towards travelers from Hanover and Hamburg.
- Tailor amenities and listing descriptions to appeal to the dominant Post-2000s (Gen Z/Alpha) demographic (e.g., highlight fast WiFi, smart home features, local guides).
- Highlight unique local experiences or amenities relevant to the primary guest profile.
- Consider seasonal promotions aligned with peak travel times for key origin markets.
Nearby Short-Term Rental Market Comparison
How does the Wurster Nordseeküste Airbnb market stack up against its neighbors? Compare key performance metrics like average monthly revenue, ADR, and occupancy rates in surrounding areas to understand the broader regional STR landscape.
| Market | Active Properties | Monthly Revenue | Daily Rate | Avg. Occupancy |
|---|---|---|---|---|
| Helgoland | 11 | $2,199 | $167.07 | 58% |
| Vlagtwedde | 38 | $2,018 | $352.87 | 31% |
| Oberndorf | 10 | $1,872 | $186.86 | 28% |
| Tetenbüll | 29 | $1,849 | $238.36 | 34% |
| Hamburg | 2,515 | $1,836 | $157.66 | 49% |
| Kampen (Sylt) | 25 | $1,824 | $508.88 | 23% |
| Sehnde | 16 | $1,820 | $148.37 | 41% |
| Brake | 19 | $1,755 | $136.43 | 46% |
| Stapel | 12 | $1,754 | $280.19 | 28% |
| Bad Fallingbostel | 21 | $1,746 | $178.72 | 40% |