Laatzen Airbnb Market Analysis 2026: Short Term Rental Data & Vacation Rental Statistics in Lower Saxony, Germany
Is Airbnb profitable in Laatzen in 2026? Explore comprehensive Airbnb analytics for Laatzen, Lower Saxony, Germany to uncover income potential. This 2026 STR market report for Laatzen, based on AirROI data from February 2025 to January 2026, reveals key trends in the niche market of 191 active listings.
Whether you're considering an Airbnb investment in Laatzen, optimizing your existing vacation rental, or exploring rental arbitrage opportunities, understanding the Laatzen Airbnb data is crucial. Leveraging the low regulation environment is key to maximizing your short term rental income potential. Let's dive into the specifics.
Key Laatzen Airbnb Performance Metrics Overview
Monthly Airbnb Revenue Variations & Income Potential in Laatzen (2026)
Understanding the monthly revenue variations for Airbnb listings in Laatzen is key to maximizing your short term rental income potential. Seasonality significantly impacts earnings. Our analysis, based on data from the past 12 months, shows that the peak revenue month for STRs in Laatzen is typically November, while January often presents the lowest earnings, highlighting opportunities for strategic pricing adjustments during shoulder and low seasons. Explore the typical Airbnb income in Laatzen across different performance tiers:
- Best-in-class properties (Top 10%) achieve $3,280+ monthly, often utilizing dynamic pricing and superior guest experiences.
- Strong performing properties (Top 25%) earn $1,892 or more, indicating effective management and desirable locations/amenities.
- Typical properties (Median) generate around $1,081 per month, representing the average market performance.
- Entry-level properties (Bottom 25%) see earnings around $552, often with potential for optimization.
Average Monthly Airbnb Earnings Trend in Laatzen
Laatzen Airbnb Occupancy Rate Trends (2026)
Maximize your bookings by understanding the Laatzen STR occupancy trends. Seasonal demand shifts significantly influence how often properties are booked. Typically, Novembersees the highest demand (peak season occupancy), while January experiences the lowest (low season). Effective strategies, like adjusting minimum stays or offering promotions, can boost occupancy during slower periods. Here's how different property tiers perform in Laatzen:
- Best-in-class properties (Top 10%) achieve 69%+ occupancy, indicating high desirability and potentially optimized availability.
- Strong performing properties (Top 25%) maintain 43% or higher occupancy, suggesting good market fit and guest satisfaction.
- Typical properties (Median) have an occupancy rate around 24%.
- Entry-level properties (Bottom 25%) average 14% occupancy, potentially facing higher vacancy.
Average Monthly Occupancy Rate Trend in Laatzen
Average Daily Rate (ADR) Airbnb Trends in Laatzen (2026)
Effective short term rental pricing strategy in Laatzen involves understanding monthly ADR fluctuations. The Average Daily Rate (ADR) for Airbnb in Laatzen typically peaks in September and dips lowest during February. Leveraging Airbnb dynamic pricing tools or strategies based on this seasonality can significantly boost revenue. Here's a look at the typical nightly rates achieved:
- Best-in-class properties (Top 10%) command rates of $439+ per night, often due to premium features or locations.
- Strong performing properties (Top 25%) achieve nightly rates of $275 or more.
- Typical properties (Median) charge around $157 per night.
- Entry-level properties (Bottom 25%) earn around $100 per night.
Average Daily Rate (ADR) Trend by Month in Laatzen
Get Live Laatzen Market Intelligence 👇

Explore Real-time Analytics
Airbnb Seasonality Analysis & Trends in Laatzen (2026)
Peak Season (November, September, October)
- Revenue averages $2,257 per month
- Occupancy rates average 37.6%
- Daily rates average $219
Shoulder Season
- Revenue averages $1,544 per month
- Occupancy maintains around 30.7%
- Daily rates hold near $203
Low Season (January, July, December)
- Revenue drops to average $1,257 per month
- Occupancy decreases to average 26.7%
- Daily rates adjust to average $211
Seasonality Insights for Laatzen
- The Airbnb seasonality in Laatzen shows highly seasonal trends requiring careful strategy. While the sections above show seasonal averages, it's also insightful to look at the extremes:
- During the high season, the absolute peak month showcases Laatzen's highest earning potential, with monthly revenues capable of climbing to $2,602, occupancy reaching a high of 39.4%, and ADRs peaking at $224.
- Conversely, the slowest single month of the year, typically falling within the low season, marks the market's lowest point. In this month, revenue might dip to $1,178, occupancy could drop to 23.1%, and ADRs may adjust down to $198.
- Understanding both the seasonal averages and these monthly peaks and troughs in revenue, occupancy, and ADR is crucial for maximizing your Airbnb profit potential in Laatzen.
Seasonal Strategies for Maximizing Profit
- Peak Season: Maximize revenue through premium pricing and potentially longer minimum stays. Ensure high availability.
- Low Season: Offer competitive pricing, special promotions (e.g., extended stay discounts), and flexible cancellation policies. Target off-season travelers like remote workers or budget-conscious guests.
- Shoulder Seasons: Implement dynamic pricing that balances peak and low rates. Target weekend travelers or specific events. Offer slightly more flexible terms than peak season.
- Regularly analyze your own performance against these Laatzen seasonality benchmarks and adjust your pricing and availability strategy accordingly.
Best Areas for Airbnb Investment in Laatzen (2026)
Exploring the top neighborhoods for short-term rentals in Laatzen? This section highlights key areas, outlining why they are attractive for hosts and guests, along with notable local attractions. Consider these locations based on your target guest profile and investment strategy.
| Neighborhood / Area | Why Host Here? (Target Guests & Appeal) | Key Attractions & Landmarks |
|---|---|---|
| Laatzen City Center | The heart of Laatzen, offering easy access to restaurants, shops, and public transportation. Ideal for both business and leisure travelers looking for convenience. | Town Hall Laatzen, Leine Center Laatzen, Public transport connections, Local dining options |
| Expo Park | Home to the Expo 2000 site, this area attracts visitors attending events and exhibitions. Perfect for tourists wanting to explore the exhibition grounds and nearby attractions. | Expo Plaza, TUI Arena, Leine River, Messe Hannover |
| Park der Sinne | A scenic park area ideal for families and nature lovers. Close to walking and biking trails, catering to eco-tourists and outdoor enthusiasts. | Park der Sinne, Nature trails, Playgrounds, Relaxation spots |
| Hannover Zoo area | Located near one of the most visited zoos in Germany, this area appeals to families with children as well as animal lovers. | Hannover Zoo, Adventure playground, Thematic animal exhibits |
| Laatzen-Nord | A quieter residential area that offers a more local experience, ideal for longer stays and those looking for a home away from home. | Local parks, Residential charm, Convenience stores, Community events |
| Höhlenburg | A unique area with historical interest and local attractions, appealing to tourists who enjoy culture and history. | Höhlenburg castle, Local museums, Cultural events |
| Nearby Hannover City | Since Laatzen is adjacent to Hannover, it's beneficial for guests wanting to easily access urban experiences, shopping, and nightlife in the larger city while staying in Laatzen. | Hannover City Center, Maschsee Lake, Hannover Pavilion, Cultural institutions |
| Leineaue Nature Reserve | A pristine natural area perfect for nature lovers and outdoor activities. Great for guests who prefer to stay close to nature while being near urban amenities. | Hiking trails, Bird watching, Picnic spots, Nature observation |
Understanding Airbnb License Requirements & STR Laws in Laatzen (2026)
While Laatzen, Lower Saxony, Germany currently shows low STR regulations, specific Airbnb license requirements might still exist or change. Always verify the latest short term rental regulations and Airbnb license requirements directly with local government authorities for Laatzen to ensure full compliance before hosting.
(Source: AirROI data, 2026, based on 1% licensed listings)
Top Performing Airbnb Properties in Laatzen (2026)
Benchmark your potential! Explore examples of top-performing Airbnb properties in Laatzenbased on Trailing Twelve Month (TTM) revenue. Analyze their characteristics, revenue, occupancy rate, and ADR to understand what drives success in this market.

Modern historic half-timbered house with sauna and fireplace
Entire Place • 5 bedrooms

Modernes Messehaus 140 sqm, 2 Parking Spaces/3-5 Guests
Entire Place • 3 bedrooms

Modern barn with fireplace and sauna
Entire Place • 5 bedrooms
Modern house for trade fair guests
Entire Place • 3 bedrooms
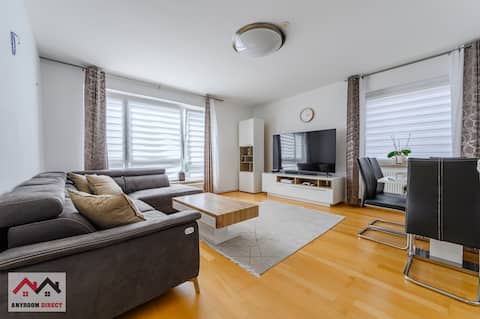
1.9 km to the trade fair 3 room apartment Laatzen ID-3
Entire Place • 2 bedrooms

Apartment in Laatzen! contactless check-in
Entire Place • 4 bedrooms
Note: Performance varies based on location, size, amenities, seasonality, and management quality. Data reflects the past 12 months.
Top Performing Airbnb Hosts in Laatzen (2026)
Learn from the best! This table showcases top-performing Airbnb hosts in Laatzen based on the number of properties managed and estimated total revenue over the past year. Analyze their scale and performance metrics.
| Host Name | Properties | Grossing Revenue | Stay Reviews | Avg Rating |
|---|---|---|---|---|
| Anyroomdirect | 21 | $273,096 | 53 | 4.75/5.0 |
| Ann-Christin Und Nigel Mehlsen | 2 | $272,866 | 111 | 4.94/5.0 |
| Marcel | 6 | $104,472 | 39 | 4.64/5.0 |
| Marcel | 5 | $103,233 | 97 | 4.73/5.0 |
| Christian | 1 | $98,604 | 6 | 4.83/5.0 |
| Helena | 5 | $79,686 | 185 | 4.74/5.0 |
| Viktor | 12 | $52,718 | 28 | 4.89/5.0 |
| Hassen | 1 | $47,029 | 2 | Not Rated |
| Alex | 1 | $41,323 | 16 | 4.88/5.0 |
| Kim | 2 | $39,833 | 12 | 4.91/5.0 |
Analyzing the strategies of top hosts, such as their property selection, pricing, and guest communication, can offer valuable lessons for optimizing your own Airbnb operations in Laatzen.
Dive Deeper: Advanced Laatzen STR Market Data (2026)
Ready to unlock more insights? AirROI provides access to advanced metrics and comprehensive Airbnb data for Laatzen. Explore detailed analytics beyond this report to refine your investment strategy, optimize pricing, and maximize your vacation rental profits.
Explore Advanced MetricsLaatzen Short-Term Rental Market Composition (2026): Property & Room Types
Room Type Distribution
Property Type Distribution
Market Composition Insights for Laatzen
- The Laatzen Airbnb market composition is heavily skewed towards Entire Home/Apt listings, which make up 77% of the 191 active rentals. This indicates strong guest preference for privacy and space.
- Looking at the property type distribution in Laatzen, Apartment/Condo properties are the most common (72.3%), reflecting the local real estate landscape.
- Houses represent a significant 24.6% portion, catering likely to families or larger groups.
- Smaller segments like hotel/boutique, others (combined 3.1%) offer potential for unique stay experiences.
Laatzen Airbnb Room Capacity Analysis (2026): Bedroom Distribution
Distribution of Listings by Number of Bedrooms
Room Capacity Insights for Laatzen
- The dominant room capacity in Laatzen is 1 bedroom listings, making up 33.5% of the market. This suggests a strong demand for properties suitable for couples or solo travelers.
- Together, 1 bedroom and 2 bedrooms properties represent 59.2% of the active Airbnb listings in Laatzen, indicating a high concentration in these sizes.
- A significant 22.5% of listings offer 3+ bedrooms, catering to larger groups and families seeking more space in Laatzen.
Laatzen Vacation Rental Guest Capacity Trends (2026)
Distribution of Listings by Guest Capacity
Guest Capacity Insights for Laatzen
- The most common guest capacity trend in Laatzen vacation rentals is listings accommodating 2 guests (19.9%). This suggests the primary traveler segment is likely couples or solo travelers.
- Properties designed for 2 guests and 4 guests dominate the Laatzen STR market, accounting for 39.3% of listings.
- 11.6% of properties accommodate 6+ guests, serving the market segment for larger families or group travel in Laatzen.
- On average, properties in Laatzen are equipped to host 3.0 guests.
Laatzen Airbnb Booking Patterns (2026): Available vs. Booked Days
Available Days Distribution
Booked Days Distribution
Booking Pattern Insights for Laatzen
- The most common availability pattern in Laatzen falls within the 271-366 days range, representing 71.2% of listings. This suggests many properties have significant open periods on their calendars.
- Approximately 91.6% of listings show high availability (181+ days open annually), indicating potential for increased bookings or specific owner usage patterns.
- For booked days, the 1-30 days range is most frequent in Laatzen (36.6%), reflecting common guest stay durations or potential owner blocking patterns.
- A notable 8.4% of properties secure long booking periods (181+ days booked per year), highlighting successful long-term rental strategies or significant owner usage.
Laatzen Airbnb Minimum Stay Requirements Analysis
Distribution of Listings by Minimum Night Requirement
1 Night
52 listings
27.2% of total
2 Nights
24 listings
12.6% of total
3 Nights
19 listings
9.9% of total
4-6 Nights
68 listings
35.6% of total
7-29 Nights
2 listings
1% of total
30+ Nights
26 listings
13.6% of total
Key Insights
- The most prevalent minimum stay requirement in Laatzen is 4-6 Nights, adopted by 35.6% of listings. This highlights the market's preference for longer commitments.
- A significant segment (13.6%) caters to monthly stays (30+ nights) in Laatzen, pointing to opportunities in the extended-stay market.
Recommendations
- Align with the market by considering a 4-6 Nights minimum stay, as 35.6% of Laatzen hosts use this setting.
- If feasible, allowing 1-night stays, especially midweek or during low season, could capture last-minute bookings, as only 27.2% currently do.
- Explore offering discounts for stays of 30+ nights to attract the 13.6% of the market seeking extended stays.
- Adjust minimum nights based on seasonality – potentially shorter during low season and longer during peak demand periods in Laatzen.
Laatzen Airbnb Cancellation Policy Trends Analysis (2026)
Super Strict 30 Days
2 listings
1.1% of total
Limited
1 listings
0.5% of total
Flexible
43 listings
22.8% of total
Moderate
26 listings
13.8% of total
Firm
53 listings
28% of total
Strict
64 listings
33.9% of total
Cancellation Policy Insights for Laatzen
- The prevailing Airbnb cancellation policy trend in Laatzen is Strict, used by 33.9% of listings.
- A majority (61.9%) of hosts in Laatzen utilize Firm or Strict policies, indicating a market where hosts prioritize booking security.
Recommendations for Hosts
- Consider adopting a Strict policy to align with the 33.9% market standard in Laatzen.
- With 33.9% using Strict terms, this is a viable option in Laatzen, particularly for high-value properties or during peak demand periods.
- Regularly review your cancellation policy against competitors and market demand shifts in Laatzen.
Laatzen STR Booking Lead Time Analysis (2026)
Average Booking Lead Time by Month
Booking Lead Time Insights for Laatzen
- The overall average booking lead time for vacation rentals in Laatzen is 70 days.
- Guests book furthest in advance for stays during November (average 134 days), likely coinciding with peak travel demand or local events.
- The shortest booking windows occur for stays in February (average 30 days), indicating more last-minute travel plans during this time.
- Seasonally, Fall (93 days avg.) sees the longest lead times, while Winter (42 days avg.) has the shortest, reflecting typical travel planning cycles.
Recommendations for Hosts
- Use the overall average lead time (70 days) as a baseline for your pricing and availability strategy in Laatzen.
- For November stays, consider implementing length-of-stay discounts or slightly higher rates for bookings made less than 134 days out to capitalize on advance planning.
- Target marketing efforts for the Fall season well in advance (at least 93 days) to capture early planners.
- Monitor your own booking lead times against these Laatzen averages to identify opportunities for dynamic pricing adjustments.
Popular & Essential Airbnb Amenities in Laatzen (2026)
Amenity Prevalence
Amenity Insights for Laatzen
- Essential amenities in Laatzen that guests expect include: Wifi. Lacking these (this) could significantly impact bookings.
- Popular amenities like TV, Heating, Kitchen are common but not universal. Offering these can provide a competitive edge.
Recommendations for Hosts
- Ensure your listing includes all essential amenities for Laatzen: Wifi.
- Prioritize adding missing essentials: Wifi.
- Consider adding popular differentiators like TV or Heating to increase appeal.
- Highlight unique or less common amenities you offer (e.g., hot tub, dedicated workspace, EV charger) in your listing description and photos.
- Regularly check competitor amenities in Laatzen to stay competitive.
Laatzen Airbnb Guest Demographics & Profile Analysis (2026)
Guest Profile Summary for Laatzen
- The typical guest profile for Airbnb in Laatzen consists of a mix of domestic (63%) and international guests, often arriving from nearby Hamburg, typically belonging to the Post-2000s (Gen Z/Alpha) group (50%), primarily speaking English or German.
- Domestic travelers account for 62.6% of guests.
- Key international markets include Germany (62.6%) and France (5.2%).
- Top languages spoken are English (37.1%) followed by German (29.8%).
- A significant demographic segment is the Post-2000s (Gen Z/Alpha) group, representing 50% of guests.
Recommendations for Hosts
- Target domestic marketing efforts towards travelers from Hamburg and Berlin.
- Tailor amenities and listing descriptions to appeal to the dominant Post-2000s (Gen Z/Alpha) demographic (e.g., highlight fast WiFi, smart home features, local guides).
- Highlight unique local experiences or amenities relevant to the primary guest profile.
- Consider seasonal promotions aligned with peak travel times for key origin markets.
Nearby Short-Term Rental Market Comparison
How does the Laatzen Airbnb market stack up against its neighbors? Compare key performance metrics like average monthly revenue, ADR, and occupancy rates in surrounding areas to understand the broader regional STR landscape.
| Market | Active Properties | Monthly Revenue | Daily Rate | Avg. Occupancy |
|---|---|---|---|---|
| Schwalefeld | 37 | $2,350 | $281.62 | 32% |
| Eslohe | 26 | $2,024 | $230.66 | 37% |
| Rietberg | 14 | $1,889 | $122.21 | 50% |
| Herzberg | 18 | $1,879 | $193.86 | 38% |
| Oberndorf | 10 | $1,872 | $186.86 | 28% |
| Stelle | 20 | $1,857 | $124.29 | 50% |
| Hamburg | 2,515 | $1,836 | $157.66 | 49% |
| Sehnde | 16 | $1,820 | $148.37 | 41% |
| Brake | 19 | $1,755 | $136.43 | 46% |
| Bad Fallingbostel | 21 | $1,746 | $178.72 | 40% |