Schwedt/Oder Airbnb Market Analysis 2026: Short Term Rental Data & Vacation Rental Statistics in Brandenburg, Germany
Is Airbnb profitable in Schwedt/Oder in 2026? Explore comprehensive Airbnb analytics for Schwedt/Oder, Brandenburg, Germany to uncover income potential. This 2026 STR market report for Schwedt/Oder, based on AirROI data from February 2025 to January 2026, reveals key trends in the niche market of 25 active listings.
Whether you're considering an Airbnb investment in Schwedt/Oder, optimizing your existing vacation rental, or exploring rental arbitrage opportunities, understanding the Schwedt/Oder Airbnb data is crucial. Navigating the high regulation landscape is key to maximizing your short term rental income potential. Let's dive into the specifics.
Key Schwedt/Oder Airbnb Performance Metrics Overview
Monthly Airbnb Revenue Variations & Income Potential in Schwedt/Oder (2026)
Understanding the monthly revenue variations for Airbnb listings in Schwedt/Oder is key to maximizing your short term rental income potential. Seasonality significantly impacts earnings. Our analysis, based on data from the past 12 months, shows that the peak revenue month for STRs in Schwedt/Oder is typically December, while January often presents the lowest earnings, highlighting opportunities for strategic pricing adjustments during shoulder and low seasons. Explore the typical Airbnb income in Schwedt/Oder across different performance tiers:
- Best-in-class properties (Top 10%) achieve $2,161+ monthly, often utilizing dynamic pricing and superior guest experiences.
- Strong performing properties (Top 25%) earn $1,256 or more, indicating effective management and desirable locations/amenities.
- Typical properties (Median) generate around $665 per month, representing the average market performance.
- Entry-level properties (Bottom 25%) see earnings around $410, often with potential for optimization.
Average Monthly Airbnb Earnings Trend in Schwedt/Oder
Schwedt/Oder Airbnb Occupancy Rate Trends (2026)
Maximize your bookings by understanding the Schwedt/Oder STR occupancy trends. Seasonal demand shifts significantly influence how often properties are booked. Typically, Augustsees the highest demand (peak season occupancy), while January experiences the lowest (low season). Effective strategies, like adjusting minimum stays or offering promotions, can boost occupancy during slower periods. Here's how different property tiers perform in Schwedt/Oder:
- Best-in-class properties (Top 10%) achieve 50%+ occupancy, indicating high desirability and potentially optimized availability.
- Strong performing properties (Top 25%) maintain 34% or higher occupancy, suggesting good market fit and guest satisfaction.
- Typical properties (Median) have an occupancy rate around 20%.
- Entry-level properties (Bottom 25%) average 13% occupancy, potentially facing higher vacancy.
Average Monthly Occupancy Rate Trend in Schwedt/Oder
Average Daily Rate (ADR) Airbnb Trends in Schwedt/Oder (2026)
Effective short term rental pricing strategy in Schwedt/Oder involves understanding monthly ADR fluctuations. The Average Daily Rate (ADR) for Airbnb in Schwedt/Oder typically peaks in January and dips lowest during March. Leveraging Airbnb dynamic pricing tools or strategies based on this seasonality can significantly boost revenue. Here's a look at the typical nightly rates achieved:
- Best-in-class properties (Top 10%) command rates of $183+ per night, often due to premium features or locations.
- Strong performing properties (Top 25%) achieve nightly rates of $142 or more.
- Typical properties (Median) charge around $123 per night.
- Entry-level properties (Bottom 25%) earn around $82 per night.
Average Daily Rate (ADR) Trend by Month in Schwedt/Oder
Get Live Schwedt/Oder Market Intelligence 👇

Explore Real-time Analytics
Airbnb Seasonality Analysis & Trends in Schwedt/Oder (2026)
Peak Season (December, June, May)
- Revenue averages $1,278 per month
- Occupancy rates average 26.5%
- Daily rates average $165
Shoulder Season
- Revenue averages $1,013 per month
- Occupancy maintains around 26.6%
- Daily rates hold near $167
Low Season (January, April, October)
- Revenue drops to average $747 per month
- Occupancy decreases to average 20.5%
- Daily rates adjust to average $173
Seasonality Insights for Schwedt/Oder
- The Airbnb seasonality in Schwedt/Oder shows highly seasonal trends requiring careful strategy. While the sections above show seasonal averages, it's also insightful to look at the extremes:
- During the high season, the absolute peak month showcases Schwedt/Oder's highest earning potential, with monthly revenues capable of climbing to $1,366, occupancy reaching a high of 30.9%, and ADRs peaking at $187.
- Conversely, the slowest single month of the year, typically falling within the low season, marks the market's lowest point. In this month, revenue might dip to $619, occupancy could drop to 15.3%, and ADRs may adjust down to $151.
- Understanding both the seasonal averages and these monthly peaks and troughs in revenue, occupancy, and ADR is crucial for maximizing your Airbnb profit potential in Schwedt/Oder.
Seasonal Strategies for Maximizing Profit
- Peak Season: Maximize revenue through premium pricing and potentially longer minimum stays. Ensure high availability.
- Low Season: Offer competitive pricing, special promotions (e.g., extended stay discounts), and flexible cancellation policies. Target off-season travelers like remote workers or budget-conscious guests.
- Shoulder Seasons: Implement dynamic pricing that balances peak and low rates. Target weekend travelers or specific events. Offer slightly more flexible terms than peak season.
- Regularly analyze your own performance against these Schwedt/Oder seasonality benchmarks and adjust your pricing and availability strategy accordingly.
Best Areas for Airbnb Investment in Schwedt/Oder (2026)
Exploring the top neighborhoods for short-term rentals in Schwedt/Oder? This section highlights key areas, outlining why they are attractive for hosts and guests, along with notable local attractions. Consider these locations based on your target guest profile and investment strategy.
| Neighborhood / Area | Why Host Here? (Target Guests & Appeal) | Key Attractions & Landmarks |
|---|---|---|
| City Center | The heart of Schwedt, offering easy access to shops, restaurants, and transport connections. A prime location for tourists and business travelers. | Schwedt Town Hall, St. John's Church, Oder Canal, Brandenburger Tor, Parks and green spaces |
| Peenepark | A scenic park area along the Peene River, ideal for outdoor activities and relaxation. Appeals to families and nature lovers. | Peenepark Recreation Area, Cycling paths, Fishing spots, Playgrounds, Nature trails |
| Biosphere Reserve | A UNESCO biosphere reserve providing rich biodiversity and opportunities for eco-tourism. Attracts nature enthusiasts and educational tourists. | Nature walks, Bird watching, Flora and fauna diversity, Guided tours, Environmental education centers |
| Hohensaaten-Friedrichsthal Canal | This area is perfect for water sports and peaceful retreats. It attracts visitors looking for a tranquil experience near water. | Canal boating, Fishing, Walking trails along the water, Picnic spots, Natural landscapes |
| Historical Town Quarter | This area showcases the historical architecture and charm of Schwedt, attracting cultural tourists and history buffs. | Museum Schwedt, Historical buildings, Old market square, Guided city tours, Local eateries |
| Shopping District | The main shopping area of Schwedt, bustling with activity and commerce. Great for short-term rentals for shopping enthusiasts. | Shopping malls, Local boutiques, Dining options, Entertainment venues, Event spaces |
| Nearby Forests | The surrounding forest areas provide opportunities for hiking, cycling, and outdoor recreation. Ideal for those who prefer a nature-centric stay. | Hiking trails, Picnic areas, Wildlife watching, Campsites, Nature tours |
| Cultural Venues | Home to various theaters and cultural institutions, appealing to those interested in the arts and local culture. | Theater Schwedt, Cultural events, Art exhibitions, Music festivals, Local gastronomic experiences |
Understanding Airbnb License Requirements & STR Laws in Schwedt/Oder (2026)
Yes, Schwedt/Oder, Brandenburg, Germany enforces high STR regulations. Obtaining a license and ensuring compliance is almost certainly required according to current 2026 STR laws. Always verify the latest short term rental regulations and Airbnb license requirements directly with local government authorities for Schwedt/Oder to ensure full compliance before hosting.
(Source: AirROI data, 2026, based on 32% licensed listings)
Top Performing Airbnb Properties in Schwedt/Oder (2026)
Benchmark your potential! Explore examples of top-performing Airbnb properties in Schwedt/Oderbased on Trailing Twelve Month (TTM) revenue. Analyze their characteristics, revenue, occupancy rate, and ADR to understand what drives success in this market.

Villa Vierraden for groups of up to 24 people
Entire Place • 8 bedrooms
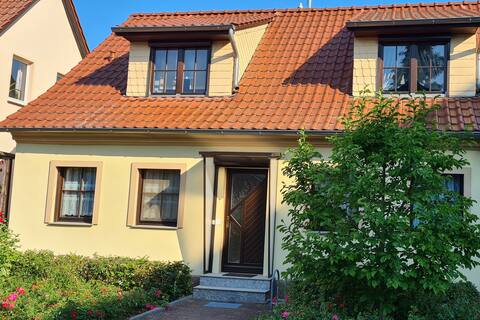
The apartment "Am Kietz"
Entire Place • 2 bedrooms
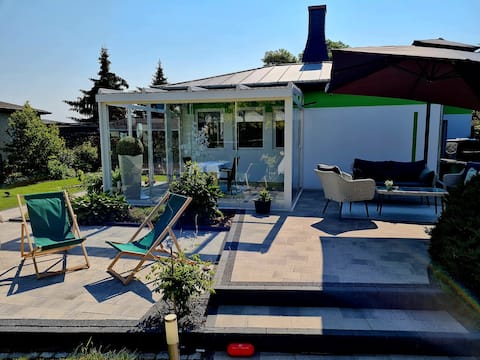
Green Bungalow Vacation Home - Contactless Check-in
Entire Place • 2 bedrooms

(ApA) VIP neu renov. 64.17 m² 3.5 Zi DG 4 Gäste
Entire Place • 3 bedrooms
In the heart of the Uckermark
Entire Place • 10 bedrooms

Vacation home for 4 guests with 40 m² in Schwedt/Oder (245033)
Entire Place • 1 bedroom
Note: Performance varies based on location, size, amenities, seasonality, and management quality. Data reflects the past 12 months.
Top Performing Airbnb Hosts in Schwedt/Oder (2026)
Learn from the best! This table showcases top-performing Airbnb hosts in Schwedt/Oder based on the number of properties managed and estimated total revenue over the past year. Analyze their scale and performance metrics.
| Host Name | Properties | Grossing Revenue | Stay Reviews | Avg Rating |
|---|---|---|---|---|
| Kerstin | 2 | $46,579 | 6 | 4.83/5.0 |
| FJ Personal GmbH | 9 | $44,398 | 47 | 4.72/5.0 |
| Vermietungsservice SECRA Booki | 5 | $23,638 | 11 | 4.89/5.0 |
| Detlef | 1 | $15,995 | 25 | 5.00/5.0 |
| Tatiana | 1 | $15,253 | 17 | 4.82/5.0 |
| Claudia | 2 | $9,015 | 172 | 4.86/5.0 |
| HOLIDAYHOST GmbH | 2 | $7,727 | 7 | 5.00/5.0 |
| Nadine | 1 | $6,419 | 1 | Not Rated |
| Anneliese | 1 | $4,319 | 22 | 4.55/5.0 |
| Brit | 1 | $3,861 | 58 | 4.86/5.0 |
Analyzing the strategies of top hosts, such as their property selection, pricing, and guest communication, can offer valuable lessons for optimizing your own Airbnb operations in Schwedt/Oder.
Dive Deeper: Advanced Schwedt/Oder STR Market Data (2026)
Ready to unlock more insights? AirROI provides access to advanced metrics and comprehensive Airbnb data for Schwedt/Oder. Explore detailed analytics beyond this report to refine your investment strategy, optimize pricing, and maximize your vacation rental profits.
Explore Advanced MetricsSchwedt/Oder Short-Term Rental Market Composition (2026): Property & Room Types
Room Type Distribution
Property Type Distribution
Market Composition Insights for Schwedt/Oder
- The Schwedt/Oder Airbnb market composition is heavily skewed towards Entire Home/Apt listings, which make up 88% of the 25 active rentals. This indicates strong guest preference for privacy and space.
- Looking at the property type distribution in Schwedt/Oder, Apartment/Condo properties are the most common (56%), reflecting the local real estate landscape.
- Houses represent a significant 44% portion, catering likely to families or larger groups.
Schwedt/Oder Airbnb Room Capacity Analysis (2026): Bedroom Distribution
Distribution of Listings by Number of Bedrooms
Room Capacity Insights for Schwedt/Oder
- The dominant room capacity in Schwedt/Oder is 3 bedrooms listings, making up 32% of the market. This suggests a strong demand for properties suitable for families or small groups.
- Together, 3 bedrooms and 1 bedroom properties represent 52.0% of the active Airbnb listings in Schwedt/Oder, indicating a high concentration in these sizes.
- A significant 40.0% of listings offer 3+ bedrooms, catering to larger groups and families seeking more space in Schwedt/Oder.
Schwedt/Oder Vacation Rental Guest Capacity Trends (2026)
Distribution of Listings by Guest Capacity
Guest Capacity Insights for Schwedt/Oder
- The most common guest capacity trend in Schwedt/Oder vacation rentals is listings accommodating 5 guests (40%). This suggests the primary traveler segment is likely larger groups.
- Properties designed for 5 guests and 4 guests dominate the Schwedt/Oder STR market, accounting for 56.0% of listings.
- 12.0% of properties accommodate 6+ guests, serving the market segment for larger families or group travel in Schwedt/Oder.
- On average, properties in Schwedt/Oder are equipped to host 4.0 guests.
Schwedt/Oder Airbnb Booking Patterns (2026): Available vs. Booked Days
Available Days Distribution
Booked Days Distribution
Booking Pattern Insights for Schwedt/Oder
- The most common availability pattern in Schwedt/Oder falls within the 271-366 days range, representing 88% of listings. This suggests many properties have significant open periods on their calendars.
- Approximately 100.0% of listings show high availability (181+ days open annually), indicating potential for increased bookings or specific owner usage patterns.
- For booked days, the 31-90 days range is most frequent in Schwedt/Oder (40%), reflecting common guest stay durations or potential owner blocking patterns.
Schwedt/Oder Airbnb Minimum Stay Requirements Analysis
Distribution of Listings by Minimum Night Requirement
1 Night
8 listings
32% of total
2 Nights
3 listings
12% of total
3 Nights
1 listings
4% of total
4-6 Nights
1 listings
4% of total
30+ Nights
12 listings
48% of total
Key Insights
- The most prevalent minimum stay requirement in Schwedt/Oder is 30+ Nights, adopted by 48% of listings. This highlights the market's preference for longer commitments.
- A significant segment (48%) caters to monthly stays (30+ nights) in Schwedt/Oder, pointing to opportunities in the extended-stay market.
Recommendations
- Align with the market by considering a 30+ Nights minimum stay, as 48% of Schwedt/Oder hosts use this setting.
- Explore offering discounts for stays of 30+ nights to attract the 48% of the market seeking extended stays.
- Adjust minimum nights based on seasonality – potentially shorter during low season and longer during peak demand periods in Schwedt/Oder.
Schwedt/Oder Airbnb Cancellation Policy Trends Analysis (2026)
Super Strict 30 Days
5 listings
20% of total
Flexible
13 listings
52% of total
Moderate
1 listings
4% of total
Firm
5 listings
20% of total
Strict
1 listings
4% of total
Cancellation Policy Insights for Schwedt/Oder
- The prevailing Airbnb cancellation policy trend in Schwedt/Oder is Flexible, used by 52% of listings.
- There's a relatively balanced mix between guest-friendly (56.0%) and stricter (24.0%) policies, offering choices for different guest needs.
- Strict cancellation policies are quite rare (4%), potentially making listings with this policy less competitive unless justified by high demand or property type.
Recommendations for Hosts
- Consider adopting a Flexible policy to align with the 52% market standard in Schwedt/Oder.
- Given the high prevalence of Flexible policies (52%), offering this can enhance booking appeal, especially during shoulder seasons.
- Using a Strict policy might deter some guests, as only 4% of listings use it. Evaluate if potential revenue protection outweighs possible lower booking rates.
- Regularly review your cancellation policy against competitors and market demand shifts in Schwedt/Oder.
Schwedt/Oder STR Booking Lead Time Analysis (2026)
Average Booking Lead Time by Month
Booking Lead Time Insights for Schwedt/Oder
- The overall average booking lead time for vacation rentals in Schwedt/Oder is 52 days.
- Guests book furthest in advance for stays during December (average 108 days), likely coinciding with peak travel demand or local events.
- The shortest booking windows occur for stays in March (average 17 days), indicating more last-minute travel plans during this time.
- Seasonally, Winter (60 days avg.) sees the longest lead times, while Spring (37 days avg.) has the shortest, reflecting typical travel planning cycles.
Recommendations for Hosts
- Use the overall average lead time (52 days) as a baseline for your pricing and availability strategy in Schwedt/Oder.
- For December stays, consider implementing length-of-stay discounts or slightly higher rates for bookings made less than 108 days out to capitalize on advance planning.
- Target marketing efforts for the Winter season well in advance (at least 60 days) to capture early planners.
- Monitor your own booking lead times against these Schwedt/Oder averages to identify opportunities for dynamic pricing adjustments.
Popular & Essential Airbnb Amenities in Schwedt/Oder (2026)
Amenity Prevalence
Amenity Insights for Schwedt/Oder
- Essential amenities in Schwedt/Oder that guests expect include: Kitchen, TV, Wifi. Lacking these (any) could significantly impact bookings.
- Popular amenities like Heating, Free parking on premises, Refrigerator are common but not universal. Offering these can provide a competitive edge.
Recommendations for Hosts
- Ensure your listing includes all essential amenities for Schwedt/Oder: Kitchen, TV, Wifi.
- Prioritize adding missing essentials: Kitchen, TV, Wifi.
- Consider adding popular differentiators like Heating or Free parking on premises to increase appeal.
- Highlight unique or less common amenities you offer (e.g., hot tub, dedicated workspace, EV charger) in your listing description and photos.
- Regularly check competitor amenities in Schwedt/Oder to stay competitive.
Schwedt/Oder Airbnb Guest Demographics & Profile Analysis (2026)
Guest Profile Summary for Schwedt/Oder
- The typical guest profile for Airbnb in Schwedt/Oder consists of primarily domestic travelers (71%), often arriving from nearby Berlin, typically belonging to the Post-2000s (Gen Z/Alpha) group (50%), primarily speaking English or German.
- Domestic travelers account for 71.4% of guests.
- Key international markets include Germany (71.4%) and Poland (7.1%).
- Top languages spoken are English (36.7%) followed by German (34.7%).
- A significant demographic segment is the Post-2000s (Gen Z/Alpha) group, representing 50% of guests.
Recommendations for Hosts
- Target domestic marketing efforts towards travelers from Berlin and Wisła.
- Tailor amenities and listing descriptions to appeal to the dominant Post-2000s (Gen Z/Alpha) demographic (e.g., highlight fast WiFi, smart home features, local guides).
- Highlight unique local experiences or amenities relevant to the primary guest profile.
- Consider seasonal promotions aligned with peak travel times for key origin markets.
Nearby Short-Term Rental Market Comparison
How does the Schwedt/Oder Airbnb market stack up against its neighbors? Compare key performance metrics like average monthly revenue, ADR, and occupancy rates in surrounding areas to understand the broader regional STR landscape.
| Market | Active Properties | Monthly Revenue | Daily Rate | Avg. Occupancy |
|---|---|---|---|---|
| Kremmen | 10 | $3,240 | $335.57 | 31% |
| Luckow | 18 | $2,751 | $265.42 | 40% |
| Groß Nemerow | 13 | $2,404 | $135.17 | 60% |
| Zastań | 28 | $2,135 | $265.12 | 34% |
| Berlin | 6,390 | $2,126 | $168.98 | 50% |
| Vogelsang-Warsin | 11 | $2,123 | $227.20 | 35% |
| Wendisch Rietz | 24 | $1,997 | $214.49 | 42% |
| Rüdersdorf bei Berlin | 11 | $1,953 | $160.80 | 43% |
| Hoppegarten | 21 | $1,926 | $134.44 | 56% |
| Rietz-Neuendorf | 10 | $1,913 | $139.89 | 45% |