Nabburg Airbnb Market Analysis 2025: Short Term Rental Data & Vacation Rental Statistics in Bavaria, Germany
Is Airbnb profitable in Nabburg in 2025? Explore comprehensive Airbnb analytics for Nabburg, Bavaria, Germany to uncover income potential. This 2025 STR market report for Nabburg, based on AirROI data from June 2024 to May 2025, reveals key trends in the niche market of 20 active listings.
Whether you're considering an Airbnb investment in Nabburg, optimizing your existing vacation rental, or exploring rental arbitrage opportunities, understanding the Nabburg Airbnb data is crucial. Leveraging the low regulation environment is key to maximizing your short term rental income potential. Let's dive into the specifics.
Key Nabburg Airbnb Performance Metrics Overview
Monthly Airbnb Revenue Variations & Income Potential in Nabburg (2025)
Understanding the monthly revenue variations for Airbnb listings in Nabburg is key to maximizing your short term rental income potential. Seasonality significantly impacts earnings. Our analysis, based on data from the past 12 months, shows that the peak revenue month for STRs in Nabburg is typically August, while October often presents the lowest earnings, highlighting opportunities for strategic pricing adjustments during shoulder and low seasons. Explore the typical Airbnb income in Nabburg across different performance tiers:
- Best-in-class properties (Top 10%) achieve $2,799+ monthly, often utilizing dynamic pricing and superior guest experiences.
- Strong performing properties (Top 25%) earn $2,021 or more, indicating effective management and desirable locations/amenities.
- Typical properties (Median) generate around $1,043 per month, representing the average market performance.
- Entry-level properties (Bottom 25%) see earnings around $478, often with potential for optimization.
Average Monthly Airbnb Earnings Trend in Nabburg
Nabburg Airbnb Occupancy Rate Trends (2025)
Maximize your bookings by understanding the Nabburg STR occupancy trends. Seasonal demand shifts significantly influence how often properties are booked. Typically, Augustsees the highest demand (peak season occupancy), while March experiences the lowest (low season). Effective strategies, like adjusting minimum stays or offering promotions, can boost occupancy during slower periods. Here's how different property tiers perform in Nabburg:
- Best-in-class properties (Top 10%) achieve 58%+ occupancy, indicating high desirability and potentially optimized availability.
- Strong performing properties (Top 25%) maintain 42% or higher occupancy, suggesting good market fit and guest satisfaction.
- Typical properties (Median) have an occupancy rate around 28%.
- Entry-level properties (Bottom 25%) average 12% occupancy, potentially facing higher vacancy.
Average Monthly Occupancy Rate Trend in Nabburg
Average Daily Rate (ADR) Airbnb Trends in Nabburg (2025)
Effective short term rental pricing strategy in Nabburg involves understanding monthly ADR fluctuations. The Average Daily Rate (ADR) for Airbnb in Nabburg typically peaks in February and dips lowest during November. Leveraging Airbnb dynamic pricing tools or strategies based on this seasonality can significantly boost revenue. Here's a look at the typical nightly rates achieved:
- Best-in-class properties (Top 10%) command rates of $196+ per night, often due to premium features or locations.
- Strong performing properties (Top 25%) achieve nightly rates of $193 or more.
- Typical properties (Median) charge around $190 per night.
- Entry-level properties (Bottom 25%) earn around $114 per night.
Average Daily Rate (ADR) Trend by Month in Nabburg
Get Live Nabburg Market Intelligence 👇

Explore Real-time Analytics
Airbnb Seasonality Analysis & Trends in Nabburg (2025)
Peak Season (August, July, September)
- Revenue averages $2,366 per month
- Occupancy rates average 48.6%
- Daily rates average $161
Shoulder Season
- Revenue averages $1,107 per month
- Occupancy maintains around 27.8%
- Daily rates hold near $160
Low Season (February, October, December)
- Revenue drops to average $891 per month
- Occupancy decreases to average 20.5%
- Daily rates adjust to average $159
Seasonality Insights for Nabburg
- The Airbnb seasonality in Nabburg shows highly seasonal trends requiring careful strategy. While the sections above show seasonal averages, it's also insightful to look at the extremes:
- During the high season, the absolute peak month showcases Nabburg's highest earning potential, with monthly revenues capable of climbing to $3,255, occupancy reaching a high of 62.4%, and ADRs peaking at $167.
- Conversely, the slowest single month of the year, typically falling within the low season, marks the market's lowest point. In this month, revenue might dip to $819, occupancy could drop to 18.4%, and ADRs may adjust down to $147.
- Understanding both the seasonal averages and these monthly peaks and troughs in revenue, occupancy, and ADR is crucial for maximizing your Airbnb profit potential in Nabburg.
Seasonal Strategies for Maximizing Profit
- Peak Season: Maximize revenue through premium pricing and potentially longer minimum stays. Ensure high availability.
- Low Season: Offer competitive pricing, special promotions (e.g., extended stay discounts), and flexible cancellation policies. Target off-season travelers like remote workers or budget-conscious guests.
- Shoulder Seasons: Implement dynamic pricing that balances peak and low rates. Target weekend travelers or specific events. Offer slightly more flexible terms than peak season.
- Regularly analyze your own performance against these Nabburg seasonality benchmarks and adjust your pricing and availability strategy accordingly.
Best Areas for Airbnb Investment in Nabburg (2025)
Exploring the top neighborhoods for short-term rentals in Nabburg? This section highlights key areas, outlining why they are attractive for hosts and guests, along with notable local attractions. Consider these locations based on your target guest profile and investment strategy.
| Neighborhood / Area | Why Host Here? (Target Guests & Appeal) | Key Attractions & Landmarks |
|---|---|---|
| Nabburg Old Town | Charming historic center with medieval architecture, attracting tourists looking for a picturesque Bavarian experience. The old town is known for its stunning historical buildings and quaint atmosphere. | St. Laurentius Church, Nabburger Tor, Kulturfabrik Nabburg, Old Town Square, City Museum Nabburg |
| Alte Schule Park | Beautiful park area that's ideal for relaxation and family gatherings. Close to local amenities and offers a serene environment for visitors. | Playgrounds, Walking paths, Picnic areas, Local events, Nearby cafes |
| Nabburg Market Square | Central hub for local markets and events, making it a hotspot for both locals and visitors. A great place for food enthusiasts and those wanting to experience local culture. | Weekly farmers market, Street food stalls, Cultural festivals, Nearby shops, Local eateries |
| Biergarten Nabburg | A traditional beer garden that offers a true taste of Bavarian hospitality. Ideal for tourists seeking authentic local experiences and cuisine. | Local brews, Traditional Bavarian food, Outdoor seating, Live music events, Family-friendly atmosphere |
| Nabburger Moor | Nature reserve offering trails and opportunities for birdwatching. Perfect for outdoor enthusiasts and families looking to explore natural beauty. | Hiking trails, Birdwatching spots, Scenic nature views, Family-friendly walks, Educational visitor center |
| Nabburg Town Hall | A renowned architectural landmark that draws history buffs and tourists. Close to various cafes and shops, making it a convenient location for visitors. | Architectural tours, Photography spots, Nearby cafes and shops, Local history events, Town square activities |
| Nearby Hiking Trails | Surrounding Nabburg are beautiful hiking areas that attract nature lovers and outdoor adventurers looking for exploration. | Scenic hiking paths, Natural landscapes, Wildlife observation, Outdoor activity groups, Photogenic spots |
| Local Art Galleries | A thriving art scene in Nabburg where visitors can appreciate local artworks and culture. It attracts art enthusiasts here to discover new talent. | Exhibitions by local artists, Workshops, Art events, Community art projects, Nearby artisan shops |
Understanding Airbnb License Requirements & STR Laws in Nabburg (2025)
While Nabburg, Bavaria, Germany currently shows low STR regulations, specific Airbnb license requirements might still exist or change. Always verify the latest short term rental regulations and Airbnb license requirements directly with local government authorities for Nabburg to ensure full compliance before hosting.
(Source: AirROI data, 2025, finding no licensed listings among those analyzed)
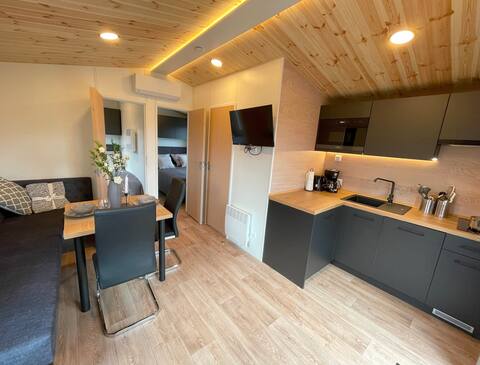
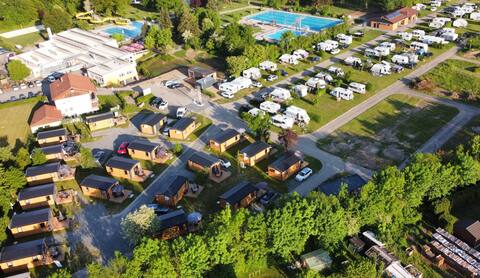
Top Performing Airbnb Properties in Nabburg (2025)
Benchmark your potential! Explore examples of top-performing Airbnb properties in Nabburgbased on Trailing Twelve Month (TTM) revenue. Analyze their characteristics, revenue, occupancy rate, and ADR to understand what drives success in this market.

Naab Chalet 6 (244319)
Entire Place • 2 bedrooms

Mobilheim für 4 Gäste mit 30m² in Nabburg (244325)
Entire Place • 2 bedrooms

Beautiful character cottage
Entire Place • 3 bedrooms
Naab Chalet 14 (244327)
Entire Place • 2 bedrooms
Mobilheim für 4 Gäste mit 30m² in Nabburg (244330)
Entire Place • 2 bedrooms

Mobilheim für 4 Gäste mit 30m² in Nabburg (244318)
Entire Place • 2 bedrooms
Note: Performance varies based on location, size, amenities, seasonality, and management quality. Data reflects the past 12 months.
Top Performing Airbnb Hosts in Nabburg (2025)
Learn from the best! This table showcases top-performing Airbnb hosts in Nabburg based on the number of properties managed and estimated total revenue over the past year. Analyze their scale and performance metrics.
| Host Name | Properties | Grossing Revenue | Stay Reviews | Avg Rating |
|---|---|---|---|---|
| Buchungsservice SECRA Bookings | 16 | $129,633 | 7 | 4.83/5.0 |
| Monika | 1 | $16,493 | 77 | 5.00/5.0 |
| Barbara | 1 | $8,626 | 17 | 4.94/5.0 |
| Sonja | 1 | $3,380 | 23 | 4.78/5.0 |
| Andreas | 1 | $2,576 | 1 | N/A/5.0 |
Analyzing the strategies of top hosts, such as their property selection, pricing, and guest communication, can offer valuable lessons for optimizing your own Airbnb operations in Nabburg.
Dive Deeper: Advanced Nabburg STR Market Data (2025)
Ready to unlock more insights? AirROI provides access to advanced metrics and comprehensive Airbnb data for Nabburg. Explore detailed analytics beyond this report to refine your investment strategy, optimize pricing, and maximize your vacation rental profits.
Explore Advanced MetricsNabburg Short-Term Rental Market Composition (2025): Property & Room Types
Room Type Distribution
Property Type Distribution
Market Composition Insights for Nabburg
- The Nabburg Airbnb market composition is heavily skewed towards Entire Home/Apt listings, which make up 100% of the 20 active rentals. This indicates strong guest preference for privacy and space.
- Looking at the property type distribution in Nabburg, House properties are the most common (75%), reflecting the local real estate landscape.
- Houses represent a significant 75% portion, catering likely to families or larger groups.
Nabburg Airbnb Room Capacity Analysis (2025): Bedroom Distribution
Distribution of Listings by Number of Bedrooms
Room Capacity Insights for Nabburg
- The dominant room capacity in Nabburg is 2 bedrooms listings, making up 75% of the market. This suggests a strong demand for properties suitable for couples or solo travelers.
- Together, 2 bedrooms and 1 bedroom properties represent 95.0% of the active Airbnb listings in Nabburg, indicating a high concentration in these sizes.
- Listings with 3+ bedrooms (5.0%) represent a smaller niche, potentially indicating an underserved market for larger group accommodations in Nabburg.
Nabburg Vacation Rental Guest Capacity Trends (2025)
Distribution of Listings by Guest Capacity
Guest Capacity Insights for Nabburg
- The most common guest capacity trend in Nabburg vacation rentals is listings accommodating 4 guests (75%). This suggests the primary traveler segment is likely small families or groups.
- Properties designed for 4 guests and 2 guests dominate the Nabburg STR market, accounting for 85.0% of listings.
- On average, properties in Nabburg are equipped to host 3.8 guests.
Nabburg Airbnb Booking Patterns (2025): Available vs. Booked Days
Available Days Distribution
Booked Days Distribution
Booking Pattern Insights for Nabburg
- The most common availability pattern in Nabburg falls within the 271-366 days range, representing 80% of listings. This suggests many properties have significant open periods on their calendars.
- Approximately 100.0% of listings show high availability (181+ days open annually), indicating potential for increased bookings or specific owner usage patterns.
- For booked days, the 31-90 days range is most frequent in Nabburg (50%), reflecting common guest stay durations or potential owner blocking patterns.
Nabburg Airbnb Minimum Stay Requirements Analysis
Distribution of Listings by Minimum Night Requirement
1 Night
14 listings
70% of total
2 Nights
2 listings
10% of total
4-6 Nights
1 listings
5% of total
30+ Nights
3 listings
15% of total
Key Insights
- The most prevalent minimum stay requirement in Nabburg is 1 Night, adopted by 70% of listings. This highlights the market's preference for shorter, flexible bookings.
- A strong majority (80.0%) of the Nabburg Airbnb data shows acceptance of very short stays (1-2 nights), indicating a dynamic, high-turnover market.
- A significant segment (15%) caters to monthly stays (30+ nights) in Nabburg, pointing to opportunities in the extended-stay market.
Recommendations
- Align with the market by considering a 1 Night minimum stay, as 70% of Nabburg hosts use this setting.
- Explore offering discounts for stays of 30+ nights to attract the 15% of the market seeking extended stays.
- Adjust minimum nights based on seasonality – potentially shorter during low season and longer during peak demand periods in Nabburg.
Nabburg Airbnb Cancellation Policy Trends Analysis (2025)
Flexible
2 listings
33.3% of total
Moderate
1 listings
16.7% of total
Firm
1 listings
16.7% of total
Strict
2 listings
33.3% of total
Cancellation Policy Insights for Nabburg
- The prevailing Airbnb cancellation policy trend in Nabburg is Flexible, used by 33.3% of listings.
- There's a relatively balanced mix between guest-friendly (50.0%) and stricter (50.0%) policies, offering choices for different guest needs.
Recommendations for Hosts
- Consider adopting a Flexible policy to align with the 33.3% market standard in Nabburg.
- With 33.3% using Strict terms, this is a viable option in Nabburg, particularly for high-value properties or during peak demand periods.
- Regularly review your cancellation policy against competitors and market demand shifts in Nabburg.
Nabburg STR Booking Lead Time Analysis (2025)
Average Booking Lead Time by Month
Booking Lead Time Insights for Nabburg
- The overall average booking lead time for vacation rentals in Nabburg is 29 days.
- Guests book furthest in advance for stays during June (average 117 days), likely coinciding with peak travel demand or local events.
- The shortest booking windows occur for stays in July (average 11 days), indicating more last-minute travel plans during this time.
- Seasonally, Summer (58 days avg.) sees the longest lead times, while Winter (27 days avg.) has the shortest, reflecting typical travel planning cycles.
Recommendations for Hosts
- Use the overall average lead time (29 days) as a baseline for your pricing and availability strategy in Nabburg.
- For June stays, consider implementing length-of-stay discounts or slightly higher rates for bookings made less than 117 days out to capitalize on advance planning.
- During July, focus on last-minute booking availability and promotions, as guests book with very short notice (11 days avg.).
- Target marketing efforts for the Summer season well in advance (at least 58 days) to capture early planners.
- Monitor your own booking lead times against these Nabburg averages to identify opportunities for dynamic pricing adjustments.
Popular & Essential Airbnb Amenities in Nabburg (2025)
Amenity Prevalence
Amenity Insights for Nabburg
- Essential amenities in Nabburg that guests expect include: Kitchen, Wifi, Patio or balcony, Heating, Backyard, Bed linens, Free parking on premises. Lacking these (any) could significantly impact bookings.
- Popular amenities like Smoke alarm, TV, Hair dryer are common but not universal. Offering these can provide a competitive edge.
Recommendations for Hosts
- Ensure your listing includes all essential amenities for Nabburg: Kitchen, Wifi, Patio or balcony, Heating, Backyard, Bed linens, Free parking on premises.
- Prioritize adding missing essentials: Patio or balcony, Heating, Backyard, Bed linens, Free parking on premises.
- Consider adding popular differentiators like Smoke alarm or TV to increase appeal.
- Highlight unique or less common amenities you offer (e.g., hot tub, dedicated workspace, EV charger) in your listing description and photos.
- Regularly check competitor amenities in Nabburg to stay competitive.
Nabburg Airbnb Guest Demographics & Profile Analysis (2025)
Guest Profile Summary for Nabburg
- The typical guest profile for Airbnb in Nabburg consists of primarily domestic travelers (78%), often arriving from nearby Huizen, typically belonging to the Post-2000s (Gen Z/Alpha) group (50%), primarily speaking German or English.
- Domestic travelers account for 77.8% of guests.
- Key international markets include Germany (77.8%) and Netherlands (22.2%).
- Top languages spoken are German (29.4%) followed by English (29.4%).
- A significant demographic segment is the Post-2000s (Gen Z/Alpha) group, representing 50% of guests.
Recommendations for Hosts
- Target domestic marketing efforts towards travelers from Huizen and Regensburg.
- Tailor amenities and listing descriptions to appeal to the dominant Post-2000s (Gen Z/Alpha) demographic (e.g., highlight fast WiFi, smart home features, local guides).
- Highlight unique local experiences or amenities relevant to the primary guest profile.
- Consider seasonal promotions aligned with peak travel times for key origin markets.
Nearby Short-Term Rental Market Comparison
How does the Nabburg Airbnb market stack up against its neighbors? Compare key performance metrics like average monthly revenue, ADR, and occupancy rates in surrounding areas to understand the broader regional STR landscape.
| Market | Active Properties | Monthly Revenue | Daily Rate | Avg. Occupancy |
|---|---|---|---|---|
| Poing | 17 | $2,371 | $159.82 | 57% |
| Drachselsried | 14 | $2,341 | $235.92 | 35% |
| Dorfen | 10 | $2,237 | $168.58 | 51% |
| Unterschleißheim | 19 | $2,125 | $142.92 | 58% |
| Gauting | 35 | $2,077 | $145.17 | 55% |
| Pfaffenhofen an der Ilm | 15 | $2,054 | $161.19 | 44% |
| Dachau | 41 | $2,002 | $142.13 | 51% |
| Kollnburg | 13 | $1,995 | $242.84 | 27% |
| Oberschleißheim | 23 | $1,981 | $118.60 | 66% |
| Gräfelfing | 18 | $1,929 | $151.14 | 53% |