Colmberg Airbnb Market Analysis 2025: Short Term Rental Data & Vacation Rental Statistics in Bavaria, Germany
Is Airbnb profitable in Colmberg in 2025? Explore comprehensive Airbnb analytics for Colmberg, Bavaria, Germany to uncover income potential. This 2025 STR market report for Colmberg, based on AirROI data from June 2024 to May 2025, reveals key trends in the niche market of 30 active listings.
Whether you're considering an Airbnb investment in Colmberg, optimizing your existing vacation rental, or exploring rental arbitrage opportunities, understanding the Colmberg Airbnb data is crucial. Leveraging the low regulation environment is key to maximizing your short term rental income potential. Let's dive into the specifics.
Key Colmberg Airbnb Performance Metrics Overview
Monthly Airbnb Revenue Variations & Income Potential in Colmberg (2025)
Understanding the monthly revenue variations for Airbnb listings in Colmberg is key to maximizing your short term rental income potential. Seasonality significantly impacts earnings. Our analysis, based on data from the past 12 months, shows that the peak revenue month for STRs in Colmberg is typically March, while July often presents the lowest earnings, highlighting opportunities for strategic pricing adjustments during shoulder and low seasons. Explore the typical Airbnb income in Colmberg across different performance tiers:
- Best-in-class properties (Top 10%) achieve $2,568+ monthly, often utilizing dynamic pricing and superior guest experiences.
- Strong performing properties (Top 25%) earn $1,671 or more, indicating effective management and desirable locations/amenities.
- Typical properties (Median) generate around $1,162 per month, representing the average market performance.
- Entry-level properties (Bottom 25%) see earnings around $682, often with potential for optimization.
Average Monthly Airbnb Earnings Trend in Colmberg
Colmberg Airbnb Occupancy Rate Trends (2025)
Maximize your bookings by understanding the Colmberg STR occupancy trends. Seasonal demand shifts significantly influence how often properties are booked. Typically, Augustsees the highest demand (peak season occupancy), while February experiences the lowest (low season). Effective strategies, like adjusting minimum stays or offering promotions, can boost occupancy during slower periods. Here's how different property tiers perform in Colmberg:
- Best-in-class properties (Top 10%) achieve 51%+ occupancy, indicating high desirability and potentially optimized availability.
- Strong performing properties (Top 25%) maintain 32% or higher occupancy, suggesting good market fit and guest satisfaction.
- Typical properties (Median) have an occupancy rate around 22%.
- Entry-level properties (Bottom 25%) average 14% occupancy, potentially facing higher vacancy.
Average Monthly Occupancy Rate Trend in Colmberg
Average Daily Rate (ADR) Airbnb Trends in Colmberg (2025)
Effective short term rental pricing strategy in Colmberg involves understanding monthly ADR fluctuations. The Average Daily Rate (ADR) for Airbnb in Colmberg typically peaks in May and dips lowest during December. Leveraging Airbnb dynamic pricing tools or strategies based on this seasonality can significantly boost revenue. Here's a look at the typical nightly rates achieved:
- Best-in-class properties (Top 10%) command rates of $276+ per night, often due to premium features or locations.
- Strong performing properties (Top 25%) achieve nightly rates of $250 or more.
- Typical properties (Median) charge around $242 per night.
- Entry-level properties (Bottom 25%) earn around $131 per night.
Average Daily Rate (ADR) Trend by Month in Colmberg
Get Live Colmberg Market Intelligence 👇

Explore Real-time Analytics
Airbnb Seasonality Analysis & Trends in Colmberg (2025)
Peak Season (March, May, August)
- Revenue averages $2,088 per month
- Occupancy rates average 35.3%
- Daily rates average $217
Shoulder Season
- Revenue averages $1,190 per month
- Occupancy maintains around 27.3%
- Daily rates hold near $198
Low Season (February, July, November)
- Revenue drops to average $928 per month
- Occupancy decreases to average 17.9%
- Daily rates adjust to average $197
Seasonality Insights for Colmberg
- The Airbnb seasonality in Colmberg shows highly seasonal trends requiring careful strategy. While the sections above show seasonal averages, it's also insightful to look at the extremes:
- During the high season, the absolute peak month showcases Colmberg's highest earning potential, with monthly revenues capable of climbing to $2,225, occupancy reaching a high of 50.8%, and ADRs peaking at $239.
- Conversely, the slowest single month of the year, typically falling within the low season, marks the market's lowest point. In this month, revenue might dip to $812, occupancy could drop to 15.2%, and ADRs may adjust down to $178.
- Understanding both the seasonal averages and these monthly peaks and troughs in revenue, occupancy, and ADR is crucial for maximizing your Airbnb profit potential in Colmberg.
Seasonal Strategies for Maximizing Profit
- Peak Season: Maximize revenue through premium pricing and potentially longer minimum stays. Ensure high availability.
- Low Season: Offer competitive pricing, special promotions (e.g., extended stay discounts), and flexible cancellation policies. Target off-season travelers like remote workers or budget-conscious guests.
- Shoulder Seasons: Implement dynamic pricing that balances peak and low rates. Target weekend travelers or specific events. Offer slightly more flexible terms than peak season.
- Regularly analyze your own performance against these Colmberg seasonality benchmarks and adjust your pricing and availability strategy accordingly.
Best Areas for Airbnb Investment in Colmberg (2025)
Exploring the top neighborhoods for short-term rentals in Colmberg? This section highlights key areas, outlining why they are attractive for hosts and guests, along with notable local attractions. Consider these locations based on your target guest profile and investment strategy.
| Neighborhood / Area | Why Host Here? (Target Guests & Appeal) | Key Attractions & Landmarks |
|---|---|---|
| Colmberg Castle | A historic castle that offers unique accommodation experiences. Attracts tourists interested in medieval history and architecture, making it a prime location for Airbnb hosting. | Colmberg Castle, Bavarian countryside, Hiking trails, Historical tours |
| Bavarian Forest | A stunning natural area known for outdoor activities such as hiking, biking, and skiing. Perfect for nature enthusiasts looking for a rural getaway. | Bavarian Forest National Park, Nature trails, Wildlife watching, Ski resorts |
| Nuremberg | Nearby city with rich history, culture, and vibrant markets. Its proximity to Colmberg makes it an attractive spot for tourists visiting the region. | Nuremberg Castle, Nuremberg Zoo, Documentation Center Nazi Party Rally Grounds, Christkindlesmarkt (Christmas Market) |
| Bad Windsheim | Famous for its spa facilities and historic old town, it attracts visitors looking for wellness and relaxation in a peaceful setting. | Franken-Therme Bad Windsheim, Open Air Museum, St. John Church |
| Rothenburg ob der Tauber | One of the most picturesque medieval towns in Germany. Popular with tourists for its well-preserved medieval buildings and charm. | Rothenburg Town Hall, Plönlein, Medieval Crime Museum |
| Ansbach | Historical town with beautiful Renaissance architecture. Offers cultural experiences and is close to various attractions. | Ansbach Residence, St. Gumbertus Church, Beyler’s Garden |
| Weißenburg in Bayern | A charming town with a rich history and Roman heritage, appealing to history buffs and tourists looking for local flavor. | Imperial Castle, Roman Museum, Old Town |
| Steppe | Quiet rural area ideal for peaceful retreats, attracting visitors looking to escape the hustle and bustle of city life. Great for nature lovers. | Scenic views, Countryside walking paths, Local farms |
Understanding Airbnb License Requirements & STR Laws in Colmberg (2025)
While Colmberg, Bavaria, Germany currently shows low STR regulations, specific Airbnb license requirements might still exist or change. Always verify the latest short term rental regulations and Airbnb license requirements directly with local government authorities for Colmberg to ensure full compliance before hosting.
(Source: AirROI data, 2025, finding no licensed listings among those analyzed)
Top Performing Airbnb Properties in Colmberg (2025)
Benchmark your potential! Explore examples of top-performing Airbnb properties in Colmbergbased on Trailing Twelve Month (TTM) revenue. Analyze their characteristics, revenue, occupancy rate, and ADR to understand what drives success in this market.
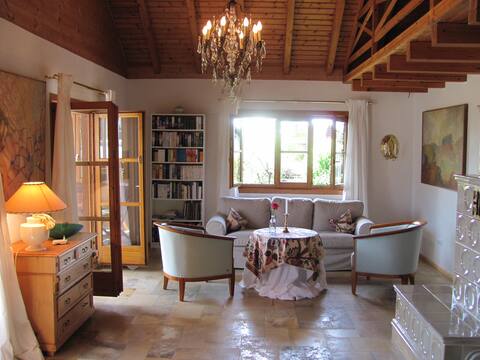
High quality holiday home in romantic Franconia
Entire Place • 4 bedrooms

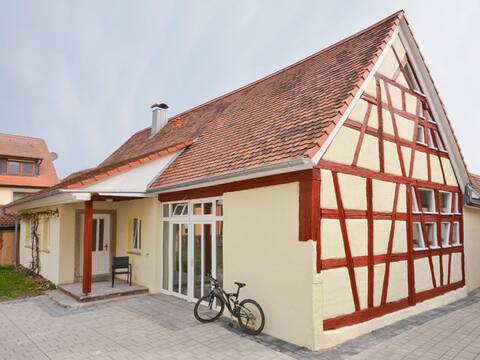
Lovingly furnished cottage with castle views
Entire Place • 3 bedrooms
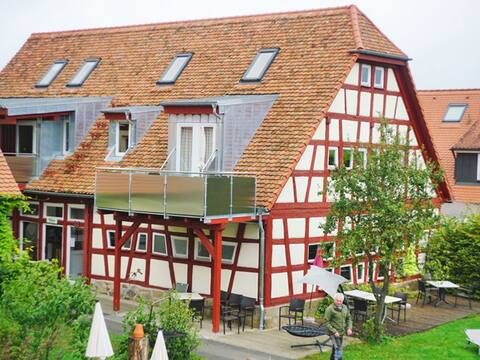
Ferienhaus für 6 Gäste mit 115m² in Colmberg (177329)
Entire Place • 3 bedrooms

Doppelzimmer Komfort + (Gasthaus Schwarzer Adler)
Private Room • 1 bedroom
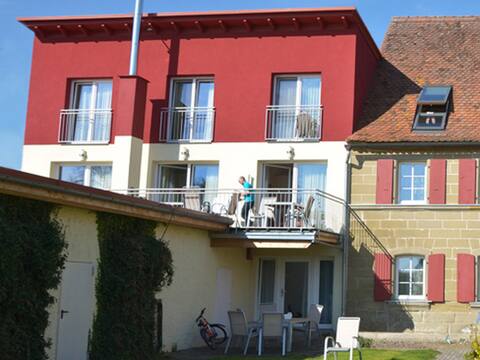
Ferienwohnung/App. für 6 Gäste mit 95m² in Colmberg (177325)
Entire Place • 3 bedrooms
Ferienwohnung/App. für 4 Gäste mit 58m² in Colmberg (177319)
Entire Place • 2 bedrooms
Note: Performance varies based on location, size, amenities, seasonality, and management quality. Data reflects the past 12 months.
Top Performing Airbnb Hosts in Colmberg (2025)
Learn from the best! This table showcases top-performing Airbnb hosts in Colmberg based on the number of properties managed and estimated total revenue over the past year. Analyze their scale and performance metrics.
| Host Name | Properties | Grossing Revenue | Stay Reviews | Avg Rating |
|---|---|---|---|---|
| Host #252498808 | 12 | $121,400 | 0 | N/A/5.0 |
| Host #238028559 | 8 | $82,489 | 0 | N/A/5.0 |
| Anna | 7 | $61,614 | 18 | 4.88/5.0 |
| Christoph | 1 | $33,792 | 25 | 4.96/5.0 |
| Hedwig | 1 | $24,948 | 106 | 4.91/5.0 |
| Host #238030351 | 1 | $5,856 | 0 | N/A/5.0 |
Analyzing the strategies of top hosts, such as their property selection, pricing, and guest communication, can offer valuable lessons for optimizing your own Airbnb operations in Colmberg.
Dive Deeper: Advanced Colmberg STR Market Data (2025)
Ready to unlock more insights? AirROI provides access to advanced metrics and comprehensive Airbnb data for Colmberg. Explore detailed analytics beyond this report to refine your investment strategy, optimize pricing, and maximize your vacation rental profits.
Explore Advanced MetricsColmberg Short-Term Rental Market Composition (2025): Property & Room Types
Room Type Distribution
Property Type Distribution
Market Composition Insights for Colmberg
- The Colmberg Airbnb market composition is heavily skewed towards Entire Home/Apt listings, which make up 80% of the 30 active rentals. This indicates strong guest preference for privacy and space.
- Looking at the property type distribution in Colmberg, Apartment/Condo properties are the most common (60%), reflecting the local real estate landscape.
- Houses represent a significant 26.7% portion, catering likely to families or larger groups.
- The presence of 13.3% Hotel/Boutique listings indicates integration with traditional hospitality.
Colmberg Airbnb Room Capacity Analysis (2025): Bedroom Distribution
Distribution of Listings by Number of Bedrooms
Room Capacity Insights for Colmberg
- The dominant room capacity in Colmberg is 2 bedrooms listings, making up 46.7% of the market. This suggests a strong demand for properties suitable for couples or solo travelers.
- Together, 2 bedrooms and 3 bedrooms properties represent 66.7% of the active Airbnb listings in Colmberg, indicating a high concentration in these sizes.
- A significant 23.3% of listings offer 3+ bedrooms, catering to larger groups and families seeking more space in Colmberg.
Colmberg Vacation Rental Guest Capacity Trends (2025)
Distribution of Listings by Guest Capacity
Guest Capacity Insights for Colmberg
- The most common guest capacity trend in Colmberg vacation rentals is listings accommodating 4 guests (50%). This suggests the primary traveler segment is likely small families or groups.
- Properties designed for 4 guests and 6 guests dominate the Colmberg STR market, accounting for 66.7% of listings.
- 20.0% of properties accommodate 6+ guests, serving the market segment for larger families or group travel in Colmberg.
- On average, properties in Colmberg are equipped to host 3.9 guests.
Colmberg Airbnb Booking Patterns (2025): Available vs. Booked Days
Available Days Distribution
Booked Days Distribution
Booking Pattern Insights for Colmberg
- The most common availability pattern in Colmberg falls within the 271-366 days range, representing 90% of listings. This suggests many properties have significant open periods on their calendars.
- Approximately 93.3% of listings show high availability (181+ days open annually), indicating potential for increased bookings or specific owner usage patterns.
- For booked days, the 31-90 days range is most frequent in Colmberg (73.3%), reflecting common guest stay durations or potential owner blocking patterns.
- A notable 6.7% of properties secure long booking periods (181+ days booked per year), highlighting successful long-term rental strategies or significant owner usage.
Colmberg Airbnb Minimum Stay Requirements Analysis
Distribution of Listings by Minimum Night Requirement
1 Night
27 listings
90% of total
2 Nights
1 listings
3.3% of total
4-6 Nights
1 listings
3.3% of total
30+ Nights
1 listings
3.3% of total
Key Insights
- The most prevalent minimum stay requirement in Colmberg is 1 Night, adopted by 90% of listings. This highlights the market's preference for shorter, flexible bookings.
- A strong majority (93.3%) of the Colmberg Airbnb data shows acceptance of very short stays (1-2 nights), indicating a dynamic, high-turnover market.
Recommendations
- Align with the market by considering a 1 Night minimum stay, as 90% of Colmberg hosts use this setting.
- Adjust minimum nights based on seasonality – potentially shorter during low season and longer during peak demand periods in Colmberg.
Colmberg Airbnb Cancellation Policy Trends Analysis (2025)
Flexible
1 listings
16.7% of total
Firm
5 listings
83.3% of total
Cancellation Policy Insights for Colmberg
- The prevailing Airbnb cancellation policy trend in Colmberg is Firm, used by 83.3% of listings.
- A majority (83.3%) of hosts in Colmberg utilize Firm or Strict policies, indicating a market where hosts prioritize booking security.
Recommendations for Hosts
- Consider adopting a Firm policy to align with the 83.3% market standard in Colmberg.
- Regularly review your cancellation policy against competitors and market demand shifts in Colmberg.
Colmberg STR Booking Lead Time Analysis (2025)
Average Booking Lead Time by Month
Booking Lead Time Insights for Colmberg
- The overall average booking lead time for vacation rentals in Colmberg is 113 days.
- Guests book furthest in advance for stays during May (average 236 days), likely coinciding with peak travel demand or local events.
- The shortest booking windows occur for stays in October (average 51 days), indicating more last-minute travel plans during this time.
- Seasonally, Spring (135 days avg.) sees the longest lead times, while Summer (62 days avg.) has the shortest, reflecting typical travel planning cycles.
Recommendations for Hosts
- Use the overall average lead time (113 days) as a baseline for your pricing and availability strategy in Colmberg.
- For May stays, consider implementing length-of-stay discounts or slightly higher rates for bookings made less than 236 days out to capitalize on advance planning.
- Target marketing efforts for the Spring season well in advance (at least 135 days) to capture early planners.
- Monitor your own booking lead times against these Colmberg averages to identify opportunities for dynamic pricing adjustments.
Popular & Essential Airbnb Amenities in Colmberg (2025)
Amenity Prevalence
Amenity Insights for Colmberg
- Essential amenities in Colmberg that guests expect include: Wifi, Smoke alarm, Bed linens, Free parking on premises, TV, Crib. Lacking these (any) could significantly impact bookings.
- Popular amenities like Washer, Carbon monoxide alarm, Hot water are common but not universal. Offering these can provide a competitive edge.
Recommendations for Hosts
- Ensure your listing includes all essential amenities for Colmberg: Wifi, Smoke alarm, Bed linens, Free parking on premises, TV, Crib.
- Prioritize adding missing essentials: Crib.
- Consider adding popular differentiators like Washer or Carbon monoxide alarm to increase appeal.
- Highlight unique or less common amenities you offer (e.g., hot tub, dedicated workspace, EV charger) in your listing description and photos.
- Regularly check competitor amenities in Colmberg to stay competitive.
Colmberg Airbnb Guest Demographics & Profile Analysis (2025)
Guest Profile Summary for Colmberg
- The typical guest profile for Airbnb in Colmberg consists of predominantly international visitors (70%), with top international origins including United States, typically belonging to the Post-2000s (Gen Z/Alpha) group (50%), primarily speaking English or German.
- Domestic travelers account for 30.3% of guests.
- Key international markets include Germany (30.3%) and United States (27.3%).
- Top languages spoken are English (52.5%) followed by German (17.5%).
- A significant demographic segment is the Post-2000s (Gen Z/Alpha) group, representing 50% of guests.
Recommendations for Hosts
- Focus marketing internationally, particularly towards travelers from United States.
- Tailor amenities and listing descriptions to appeal to the dominant Post-2000s (Gen Z/Alpha) demographic (e.g., highlight fast WiFi, smart home features, local guides).
- Highlight unique local experiences or amenities relevant to the primary guest profile.
- Consider seasonal promotions aligned with peak travel times for key origin markets.
Nearby Short-Term Rental Market Comparison
How does the Colmberg Airbnb market stack up against its neighbors? Compare key performance metrics like average monthly revenue, ADR, and occupancy rates in surrounding areas to understand the broader regional STR landscape.
| Market | Active Properties | Monthly Revenue | Daily Rate | Avg. Occupancy |
|---|---|---|---|---|
| Kusterdingen | 11 | $3,048 | $191.45 | 52% |
| Poing | 17 | $2,371 | $159.82 | 57% |
| Unterschleißheim | 19 | $2,125 | $142.93 | 58% |
| Gauting | 35 | $2,077 | $145.17 | 55% |
| Pfaffenhofen an der Ilm | 15 | $2,054 | $161.19 | 44% |
| Dachau | 41 | $2,002 | $142.13 | 51% |
| Oberschleißheim | 23 | $1,981 | $118.60 | 66% |
| Gräfelfing | 18 | $1,929 | $151.14 | 53% |
| Hohenbrunn | 10 | $1,825 | $144.23 | 47% |
| Rothenburg ob der Tauber | 44 | $1,811 | $139.07 | 43% |